De Witt, Iowa (IA) income map, earnings map, and wages data
The median household income in De Witt, IA in 2022 was $65,724, which was 5.9% less than the median annual income of $69,588 across the entire state of Iowa. Compared to the median income of $44,720 in 2000 this represents an increase of 32.0%. The per capita income in 2022 was $40,537, which means an increase of 51.4% compared to 2000 when it was $19,717.
Whole page based on the data from 2000 / 2022 when the population of De Witt, Iowa was 5,049 / 5,528
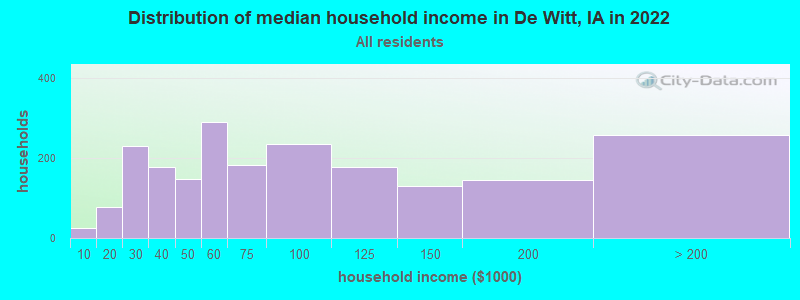
Income statistics for all residents
Median household income in De Witt, IA in 2022:| De Witt: | $65,725 |
| State: | $69,588 |
Change in median household income between 2000 and 2022:| De Witt, Iowa: | +47.0% |
| Iowa: | +76.3% |
Number of households with income < $10k:| De Witt: | 1.2% (25) |
| State: | 4.3% (57,792) |
Number of households with income $10k - 20k:| De Witt: | 3.8% (78) |
| State: | 7.1% (94,476) |
Number of households with income $20k - 30k:| De Witt: | 11.1% (230) |
| State: | 7.5% (99,451) |
Number of households with income $30k - 40k:| De Witt: | 8.6% (178) |
| State: | 7.9% (105,366) |
Number of households with income $40k - 50k:| De Witt: | 7.1% (148) |
| State: | 8.3% (110,374) |
Number of households with income $50k - 60k:| De Witt: | 14.0% (290) |
| State: | 8.0% (106,753) |
Number of households with income $60k - 75k:| De Witt: | 8.8% (183) |
| State: | 10.3% (137,637) |
Number of households with income $75k - 100k:| De Witt: | 11.3% (234) |
| Iowa: | 14.2% (188,515) |
Number of households with income $100k - 125k:| De Witt: | 8.5% (177) |
| State: | 10.3% (136,469) |
Number of households with income $125k - 150k:| De Witt: | 6.3% (131) |
| State: | 7.1% (94,270) |
Number of households with income $150k - 200k:| De Witt: | 7.0% (145) |
| State: | 7.8% (103,165) |
Number of households with income > $200k:| De Witt: | 12.4% (258) |
| State: | 7.3% (96,727) |
Aggregate household income in De Witt in 2022: $214,825,103
Median family income in De Witt in 2022:| De Witt: | $91,487 |
| State: | $90,851 |
Number of families with income $10k - 20k:| De Witt: | 4.6% (67) |
| State: | 3.2% (26,365) |
Number of families with income $20k - 30k:| De Witt: | 4.4% (64) |
| Iowa: | 4.3% (35,635) |
Number of families with income $30k - 40k:| De Witt: | 4.5% (65) |
| Iowa: | 5.4% (44,304) |
Number of families with income $40k - 50k:| De Witt: | 5.0% (73) |
| State: | 6.8% (55,757) |
Number of families with income $50k - 60k:| De Witt: | 11.5% (167) |
| State: | 6.7% (55,443) |
Number of families with income $60k - 75k:| De Witt: | 10.9% (158) |
| State: | 10.2% (83,983) |
Number of families with income $75k - 100k:| De Witt: | 13.6% (197) |
| State: | 16.5% (135,546) |
Number of families with income $100k - 125k:| De Witt: | 11.2% (163) |
| State: | 13.2% (108,552) |
Number of families with income $125k - 150k:| De Witt: | 6.4% (93) |
| Iowa: | 9.7% (79,659) |
Number of families with income $150k - 200k:| De Witt: | 10.0% (145) |
| State: | 11.0% (90,640) |
Number of families with income > $200k:| De Witt: | 17.8% (257) |
| State: | 10.4% (85,202) |
Median non-family income in De Witt in 2022:| De Witt: | $36,218 |
| State: | $41,504 |
Change in median non-family income between 2000 and 2022:| De Witt, Iowa: | +81.1% |
| Iowa: | +84.8% |
Median per capita income in De Witt in 2022:| De Witt: | $40,537 |
| State: | $38,917 |
Change in median per capita income between 2000 and 2022:| De Witt, Iowa: | +105.6% |
| Iowa: | +97.8% |
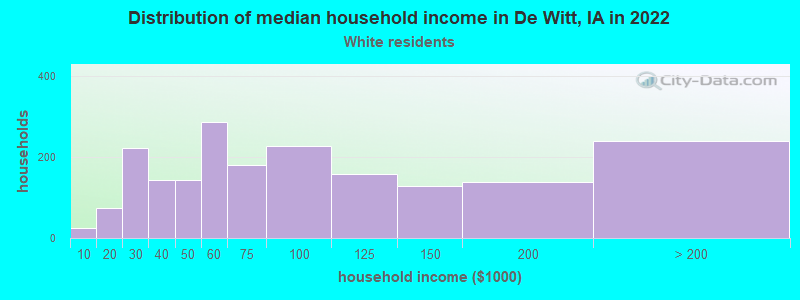
Income statistics for White residents
Median household income in De Witt, IA in 2022:| De Witt: | $65,986 |
| State: | $71,725 |
Change in median household income between 2000 and 2022:| De Witt, Iowa: | +48.1% |
| State: | +79.7% |
Number of households with income < $10k:| De Witt: | 1.3% (25) |
| Iowa: | 4.0% (47,459) |
Number of households with income $10k - 20k:| De Witt: | 3.8% (75) |
| State: | 6.7% (78,901) |
Number of households with income $20k - 30k:| De Witt: | 11.3% (222) |
| State: | 7.1% (83,759) |
Number of households with income $30k - 40k:| De Witt: | 7.3% (144) |
| State: | 7.7% (90,779) |
Number of households with income $40k - 50k:| De Witt: | 7.3% (143) |
| Iowa: | 8.0% (93,777) |
Number of households with income $50k - 60k:| De Witt: | 14.5% (286) |
| State: | 8.0% (94,176) |
Number of households with income $60k - 75k:| De Witt: | 9.2% (181) |
| Iowa: | 10.5% (123,053) |
Number of households with income $75k - 100k:| De Witt: | 11.5% (227) |
| Iowa: | 14.4% (168,483) |
Number of households with income $100k - 125k:| De Witt: | 8.1% (159) |
| Iowa: | 10.6% (124,515) |
Number of households with income $125k - 150k:| De Witt: | 6.6% (129) |
| State: | 7.4% (87,043) |
Number of households with income $150k - 200k:| De Witt: | 7.0% (138) |
| Iowa: | 7.8% (91,953) |
Number of households with income > $200k:| De Witt: | 12.1% (239) |
| Iowa: | 7.6% (88,587) |
Aggregate household income in De Witt in 2022: $203,986,015
Median family income in De Witt in 2022:| De Witt: | $92,116 |
| State: | $93,591 |
Number of families with income $10k - 20k:| De Witt: | 4.5% (62) |
| Iowa: | 2.7% (19,465) |
Number of families with income $20k - 30k:| De Witt: | 4.6% (62) |
| State: | 4.0% (28,678) |
Number of families with income $30k - 40k:| De Witt: | 2.5% (35) |
| State: | 5.0% (36,249) |
Number of families with income $40k - 50k:| De Witt: | 5.0% (68) |
| State: | 6.3% (45,169) |
Number of families with income $50k - 60k:| De Witt: | 12.1% (165) |
| State: | 6.7% (48,577) |
Number of families with income $60k - 75k:| De Witt: | 11.4% (155) |
| Iowa: | 10.4% (75,030) |
Number of families with income $75k - 100k:| De Witt: | 13.9% (189) |
| Iowa: | 16.7% (120,450) |
Number of families with income $100k - 125k:| De Witt: | 11.8% (161) |
| State: | 13.8% (99,746) |
Number of families with income $125k - 150k:| De Witt: | 6.7% (92) |
| State: | 10.2% (73,833) |
Number of families with income $150k - 200k:| De Witt: | 10.2% (139) |
| Iowa: | 11.3% (81,189) |
Number of families with income > $200k:| De Witt: | 17.4% (237) |
| Iowa: | 10.8% (77,838) |
Median non-family income in De Witt in 2022:| De Witt: | $35,192 |
| State: | $41,981 |
Change in median non-family income between 2000 and 2022:| De Witt, Iowa: | +76.0% |
| State: | +85.4% |
Median per capita income in De Witt in 2022:| De Witt: | $39,869 |
| State: | $41,266 |
Change in median per capita income between 2000 and 2022:| De Witt, Iowa: | +101.8% |
| State: | +105.0% |
Income statistics for Asian residents
Number of households with income < $10k:| De Witt: | 0.0% (0) |
| Iowa: | 5.1% (1,350) |
Number of households with income $10k - 20k:| De Witt: | 0.0% (0) |
| State: | 4.3% (1,162) |
Number of households with income $20k - 30k:| De Witt: | 0.0% (0) |
| State: | 12.2% (3,263) |
Number of households with income $30k - 40k:| De Witt: | 0.0% (0) |
| Iowa: | 3.7% (997) |
Number of households with income $40k - 50k:| De Witt: | 0.0% (0) |
| State: | 8.9% (2,391) |
Number of households with income $50k - 60k:| De Witt: | 0.0% (0) |
| State: | 4.0% (1,077) |
Number of households with income $60k - 75k:| De Witt: | 0.0% (0) |
| Iowa: | 7.3% (1,943) |
Number of households with income $75k - 100k:| De Witt: | 0.0% (0) |
| State: | 11.2% (2,983) |
Number of households with income $100k - 125k:| De Witt: | 0.0% (0) |
| State: | 11.9% (3,186) |
Number of households with income $125k - 150k:| De Witt: | 0.0% (0) |
| State: | 6.3% (1,674) |
Number of households with income $150k - 200k:| De Witt: | 0.0% (0) |
| State: | 12.9% (3,452) |
Number of households with income > $200k:| De Witt: | 100.0% (18) |
| State: | 12.1% (3,245) |
Median per capita income in De Witt in 2022:| De Witt: | $59,866 |
| Iowa: | $40,609 |
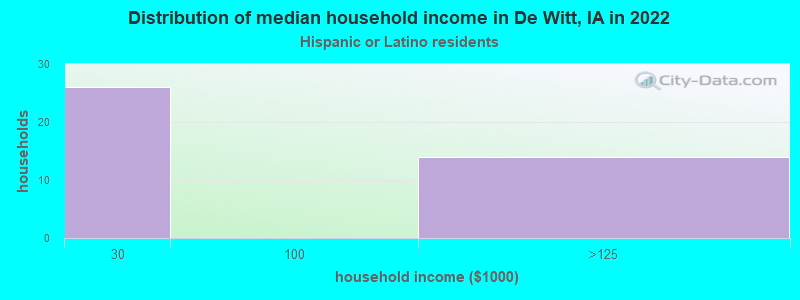
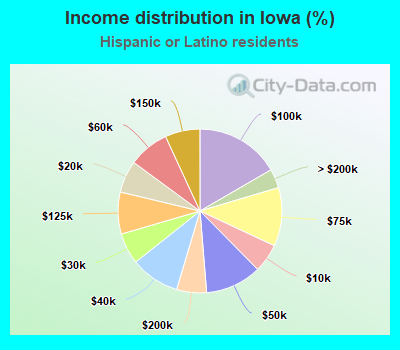
Income statistics for Hispanic or Latino residents
Number of households with income < $10k:| De Witt: | 0.0% (0) |
| State: | 5.6% (3,540) |
Number of households with income $10k - 20k:| De Witt: | 0.0% (0) |
| State: | 6.3% (3,979) |
Number of households with income $20k - 30k:| De Witt: | 65.0% (26) |
| State: | 6.1% (3,857) |
Number of households with income $30k - 40k:| De Witt: | 0.0% (0) |
| State: | 9.7% (6,099) |
Number of households with income $40k - 50k:| De Witt: | 0.0% (0) |
| Iowa: | 11.1% (6,971) |
Number of households with income $50k - 60k:| De Witt: | 0.0% (0) |
| State: | 8.0% (5,046) |
Number of households with income $60k - 75k:| De Witt: | 0.0% (0) |
| State: | 11.6% (7,267) |
Number of households with income $75k - 100k:| De Witt: | 0.0% (0) |
| Iowa: | 16.6% (10,454) |
Number of households with income $100k - 125k:| De Witt: | 35.0% (14) |
| State: | 8.3% (5,202) |
Number of households with income $125k - 150k:| De Witt: | 0.0% (0) |
| Iowa: | 6.9% (4,319) |
Number of households with income $150k - 200k:| De Witt: | 0.0% (0) |
| State: | 5.9% (3,708) |
Number of households with income > $200k:| De Witt: | 0.0% (0) |
| State: | 3.8% (2,363) |
Aggregate household income in De Witt in 2022: $3,539,818
Median per capita income in De Witt in 2022:| De Witt: | $55,401 |
| Iowa: | $23,112 |
Income statistics for Multirace residents
Median per capita income in De Witt in 2022:| De Witt: | $53,721 |
| Iowa: | $24,977 |