Kensington, New Hampshire (NH) income map, earnings map, and wages data
The median household income in Kensington, NH in 2022 was $124,429, which was 27.7% greater than the median annual income of $89,992 across the entire state of New Hampshire. Compared to the median income of $67,344 in 2000 this represents an increase of 45.9%. The per capita income in 2022 was $64,240, which means an increase of 54.4% compared to 2000 when it was $29,265.
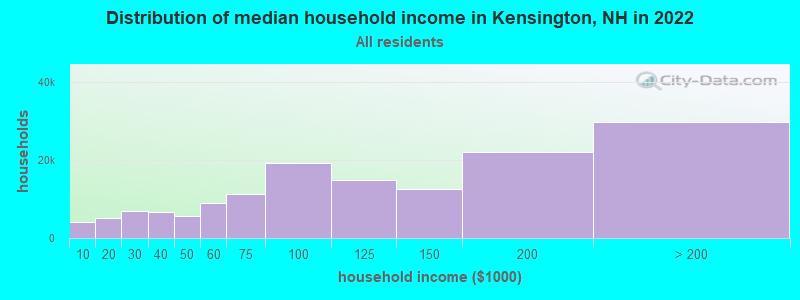
Income statistics for all residents
Median household income in Kensington, NH in 2022:| Kensington: | $124,429 |
| State: | $89,992 |
Change in median household income between 2000 and 2022:| Kensington, New Hampshire: | +84.8% |
| State: | +81.9% |
Number of households with income < $10k:| Kensington: | 2.8% (4,109) |
| State: | 3.1% (17,541) |
Number of households with income $10k - 20k:| Kensington: | 3.4% (5,054) |
| State: | 5.4% (29,916) |
Number of households with income $20k - 30k:| Kensington: | 4.8% (7,047) |
| State: | 5.5% (30,783) |
Number of households with income $30k - 40k:| Kensington: | 4.5% (6,629) |
| State: | 5.9% (32,868) |
Number of households with income $40k - 50k:| Kensington: | 3.8% (5,644) |
| New Hampshire: | 5.9% (32,728) |
Number of households with income $50k - 60k:| Kensington: | 6.2% (9,074) |
| State: | 6.9% (38,422) |
Number of households with income $60k - 75k:| Kensington: | 7.7% (11,370) |
| New Hampshire: | 9.1% (50,552) |
Number of households with income $75k - 100k:| Kensington: | 13.0% (19,156) |
| State: | 13.1% (73,145) |
Number of households with income $100k - 125k:| Kensington: | 10.0% (14,794) |
| New Hampshire: | 10.5% (58,593) |
Number of households with income $125k - 150k:| Kensington: | 8.5% (12,576) |
| State: | 8.1% (44,878) |
Number of households with income $150k - 200k:| Kensington: | 15.0% (22,141) |
| State: | 11.5% (64,340) |
Number of households with income > $200k:| Kensington: | 20.2% (29,822) |
| State: | 15.0% (83,454) |
Aggregate household income in Kensington in 2022: $468,608,846
Median family income in Kensington in 2022:| Kensington: | $154,275 |
| State: | $112,950 |
Median non-family income in Kensington in 2022:| Kensington: | $64,077 |
| State: | $52,292 |
Change in median non-family income between 2000 and 2022:| Kensington, New Hampshire: | +75.8% |
| State: | +80.7% |
Median per capita income in Kensington in 2022:| Kensington: | $64,240 |
| New Hampshire: | $49,281 |
Change in median per capita income between 2000 and 2022:| Kensington, New Hampshire: | +119.5% |
| State: | +106.7% |
Income statistics for White residents
Median household income in Kensington, NH in 2022:| Kensington: | $124,972 |
| State: | $90,839 |
Change in median household income between 2000 and 2022:| Kensington, New Hampshire: | +85.6% |
| State: | +82.8% |
Number of households with income < $10k:| Kensington: | 3.0% (4,016) |
| New Hampshire: | 3.1% (15,499) |
Number of households with income $10k - 20k:| Kensington: | 3.6% (4,888) |
| State: | 5.6% (27,915) |
Number of households with income $20k - 30k:| Kensington: | 4.4% (5,982) |
| State: | 5.4% (27,382) |
Number of households with income $30k - 40k:| Kensington: | 4.6% (6,206) |
| State: | 5.9% (29,681) |
Number of households with income $40k - 50k:| Kensington: | 3.7% (5,023) |
| State: | 5.7% (28,456) |
Number of households with income $50k - 60k:| Kensington: | 6.6% (8,933) |
| State: | 6.9% (34,641) |
Number of households with income $60k - 75k:| Kensington: | 7.8% (10,560) |
| State: | 9.0% (45,144) |
Number of households with income $75k - 100k:| Kensington: | 12.1% (16,356) |
| New Hampshire: | 13.0% (65,259) |
Number of households with income $100k - 125k:| Kensington: | 10.1% (13,666) |
| New Hampshire: | 10.7% (53,931) |
Number of households with income $125k - 150k:| Kensington: | 8.7% (11,750) |
| State: | 8.1% (40,466) |
Number of households with income $150k - 200k:| Kensington: | 15.2% (20,522) |
| State: | 11.9% (59,781) |
Number of households with income > $200k:| Kensington: | 20.2% (27,252) |
| State: | 14.8% (74,387) |
Aggregate household income in Kensington in 2022: $432,824,689
Median family income in Kensington in 2022:| Kensington: | $154,627 |
| State: | $115,125 |
Number of families with income < $10k:| Kensington: | 1.1% (8) |
| State: | 1.5% (4,767) |
Number of families with income $10k - 20k:| Kensington: | 0.7% (5) |
| State: | 2.1% (6,602) |
Number of families with income $20k - 30k:| Kensington: | 0.4% (3) |
| State: | 2.7% (8,511) |
Number of families with income $30k - 40k:| Kensington: | 1.2% (8) |
| New Hampshire: | 4.0% (12,696) |
Number of families with income $40k - 50k:| Kensington: | 1.9% (14) |
| State: | 4.3% (13,626) |
Number of families with income $50k - 60k:| Kensington: | 2.6% (19) |
| New Hampshire: | 5.6% (17,792) |
Number of families with income $60k - 75k:| Kensington: | 6.1% (45) |
| State: | 8.4% (26,945) |
Number of families with income $75k - 100k:| Kensington: | 7.0% (51) |
| State: | 13.8% (44,284) |
Number of families with income $100k - 125k:| Kensington: | 10.6% (77) |
| State: | 12.5% (39,959) |
Number of families with income $125k - 150k:| Kensington: | 12.1% (88) |
| State: | 10.3% (33,038) |
Number of families with income $150k - 200k:| Kensington: | 21.7% (158) |
| New Hampshire: | 15.4% (49,456) |
Number of families with income > $200k:| Kensington: | 34.6% (252) |
| State: | 19.5% (62,442) |
Median non-family income in Kensington in 2022:| Kensington: | $61,655 |
| State: | $51,861 |
Change in median non-family income between 2000 and 2022:| Kensington, New Hampshire: | +67.2% |
| New Hampshire: | +79.2% |
Median per capita income in Kensington in 2022:| Kensington: | $65,373 |
| State: | $50,469 |
Change in median per capita income between 2000 and 2022:| Kensington, New Hampshire: | +121.7% |
| State: | +109.2% |
Income statistics for Black or African American residents
Number of households with income < $10k:| Kensington: | 10.1% (9,953,554) |
| State: | 3.4% (202) |
Number of households with income $10k - 20k:| Kensington: | 11.4% (11,287,763) |
| New Hampshire: | 7.8% (463) |
Number of households with income $20k - 30k:| Kensington: | 9.4% (9,287,106) |
| State: | 6.5% (384) |
Number of households with income $30k - 40k:| Kensington: | 9.5% (9,356,164) |
| State: | 9.2% (544) |
Number of households with income $40k - 50k:| Kensington: | 8.5% (8,386,491) |
| State: | 6.7% (394) |
Number of households with income $50k - 60k:| Kensington: | 7.5% (7,409,053) |
| New Hampshire: | 7.9% (469) |
Number of households with income $60k - 75k:| Kensington: | 9.5% (9,378,673) |
| State: | 11.9% (705) |
Number of households with income $75k - 100k:| Kensington: | 11.3% (11,179,606) |
| State: | 12.9% (761) |
Number of households with income $100k - 125k:| Kensington: | 7.6% (7,553,221) |
| State: | 11.7% (694) |
Number of households with income $125k - 150k:| Kensington: | 4.9% (4,810,015) |
| State: | 7.8% (459) |
Number of households with income $150k - 200k:| Kensington: | 5.4% (5,343,358) |
| State: | 7.7% (456) |
Number of households with income > $200k:| Kensington: | 5.1% (5,007,257) |
| New Hampshire: | 6.4% (377) |
Median per capita income in Kensington in 2022:| Kensington: | $182,676 |
| New Hampshire: | $31,675 |
Change in median per capita income between 2000 and 2022:| Kensington, New Hampshire: | +100.7% |
| New Hampshire: | +85.9% |
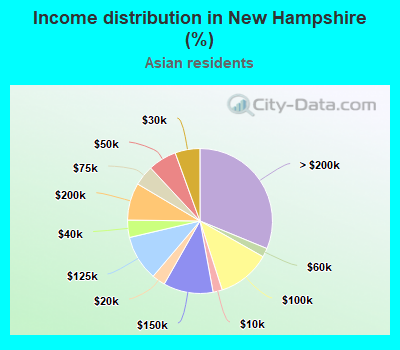
Income statistics for Asian residents
Median household income in Kensington, NH in 2022:| Kensington: | $96,083 |
| State: | $126,236 |
Change in median household income between 2000 and 2022:| Kensington, New Hampshire: | +87.5% |
| New Hampshire: | +124.0% |
Number of households with income < $10k:| Kensington: | 2.1% (246) |
| State: | 2.1% (271) |
Number of households with income $10k - 20k:| Kensington: | 3.0% (358) |
| State: | 3.0% (393) |
Number of households with income $20k - 30k:| Kensington: | 5.5% (663) |
| New Hampshire: | 5.5% (729) |
Number of households with income $30k - 40k:| Kensington: | 3.9% (464) |
| State: | 3.9% (510) |
Number of households with income $40k - 50k:| Kensington: | 6.4% (766) |
| New Hampshire: | 6.4% (842) |
Number of households with income $50k - 60k:| Kensington: | 2.0% (237) |
| State: | 2.0% (261) |
Number of households with income $60k - 75k:| Kensington: | 4.5% (543) |
| State: | 4.5% (597) |
Number of households with income $75k - 100k:| Kensington: | 11.8% (1,418) |
| State: | 11.8% (1,559) |
Number of households with income $100k - 125k:| Kensington: | 10.1% (1,213) |
| State: | 10.1% (1,334) |
Number of households with income $125k - 150k:| Kensington: | 11.1% (1,331) |
| State: | 11.1% (1,463) |
Number of households with income $150k - 200k:| Kensington: | 8.3% (996) |
| State: | 8.3% (1,095) |
Number of households with income > $200k:| Kensington: | 31.2% (3,739) |
| New Hampshire: | 31.2% (4,111) |
Aggregate household income in Kensington in 2022: $1,266,595
Median family income in Kensington in 2022:| Kensington: | $182,530 |
| State: | $138,456 |
Median non-family income in Kensington in 2022:| Kensington: | $5,475 |
| State: | $95,336 |
Change in median non-family income between 2000 and 2022:| Kensington, New Hampshire: | +119.1% |
| State: | +143.6% |
Median per capita income in Kensington in 2022:| Kensington: | $34,139 |
| State: | $64,014 |
Change in median per capita income between 2000 and 2022:| Kensington, New Hampshire: | +125.3% |
| State: | +197.2% |
Income statistics for Multirace residents
Number of households with income < $10k:| Kensington: | 4.0% (50) |
| State: | 4.0% (1,057) |
Number of households with income $10k - 20k:| Kensington: | 3.2% (40) |
| New Hampshire: | 3.3% (864) |
Number of households with income $20k - 30k:| Kensington: | 6.3% (79) |
| New Hampshire: | 6.3% (1,664) |
Number of households with income $30k - 40k:| Kensington: | 7.9% (98) |
| State: | 7.9% (2,072) |
Number of households with income $40k - 50k:| Kensington: | 5.5% (68) |
| New Hampshire: | 5.4% (1,422) |
Number of households with income $50k - 60k:| Kensington: | 7.6% (95) |
| State: | 7.7% (2,024) |
Number of households with income $60k - 75k:| Kensington: | 11.8% (147) |
| State: | 11.8% (3,109) |
Number of households with income $75k - 100k:| Kensington: | 14.9% (185) |
| State: | 14.8% (3,906) |
Number of households with income $100k - 125k:| Kensington: | 9.6% (120) |
| State: | 9.6% (2,523) |
Number of households with income $125k - 150k:| Kensington: | 6.6% (82) |
| State: | 6.6% (1,734) |
Number of households with income $150k - 200k:| Kensington: | 8.4% (104) |
| New Hampshire: | 8.4% (2,213) |
Number of households with income > $200k:| Kensington: | 14.2% (177) |
| State: | 14.3% (3,765) |
Median per capita income in Kensington in 2022:| Kensington: | $3,694 |
| State: | $34,906 |