Northfield, New Hampshire (NH) income map, earnings map, and wages data
The median household income in Northfield, NH in 2022 was $77,378, which was 16.3% less than the median annual income of $89,992 across the entire state of New Hampshire. Compared to the median income of $44,333 in 2000 this represents an increase of 42.7%. The per capita income in 2022 was $36,989, which means an increase of 50.1% compared to 2000 when it was $18,466.
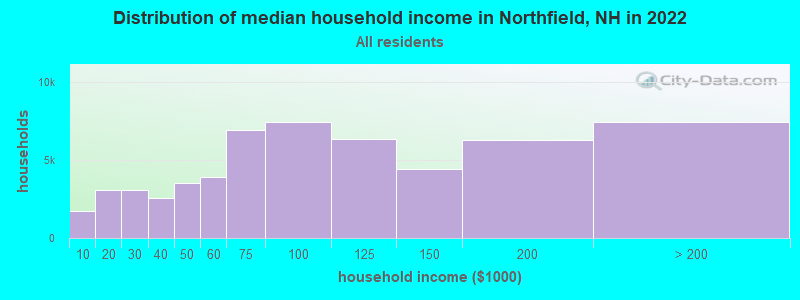
Income statistics for all residents
Median household income in Northfield, NH in 2022:| Northfield: | $77,379 |
| State: | $89,992 |
Change in median household income between 2000 and 2022:| Northfield, New Hampshire: | +74.5% |
| New Hampshire: | +81.9% |
Number of households with income < $10k:| Northfield: | 3.0% (1,719) |
| New Hampshire: | 3.1% (17,541) |
Number of households with income $10k - 20k:| Northfield: | 5.5% (3,097) |
| New Hampshire: | 5.4% (29,916) |
Number of households with income $20k - 30k:| Northfield: | 5.4% (3,060) |
| State: | 5.5% (30,783) |
Number of households with income $30k - 40k:| Northfield: | 4.5% (2,536) |
| State: | 5.9% (32,868) |
Number of households with income $40k - 50k:| Northfield: | 6.2% (3,503) |
| New Hampshire: | 5.9% (32,728) |
Number of households with income $50k - 60k:| Northfield: | 6.9% (3,929) |
| State: | 6.9% (38,422) |
Number of households with income $60k - 75k:| Northfield: | 12.3% (6,954) |
| New Hampshire: | 9.1% (50,552) |
Number of households with income $75k - 100k:| Northfield: | 13.1% (7,420) |
| State: | 13.1% (73,145) |
Number of households with income $100k - 125k:| Northfield: | 11.2% (6,345) |
| New Hampshire: | 10.5% (58,593) |
Number of households with income $125k - 150k:| Northfield: | 7.8% (4,398) |
| State: | 8.1% (44,878) |
Number of households with income $150k - 200k:| Northfield: | 11.1% (6,265) |
| State: | 11.5% (64,340) |
Number of households with income > $200k:| Northfield: | 13.1% (7,445) |
| State: | 15.0% (83,454) |
Aggregate household income in Northfield in 2022: $279,542,714
Median family income in Northfield in 2022:| Northfield: | $93,064 |
| State: | $112,950 |
Median non-family income in Northfield in 2022:| Northfield: | $46,389 |
| State: | $52,292 |
Change in median non-family income between 2000 and 2022:| Northfield, New Hampshire: | +77.5% |
| State: | +80.7% |
Median per capita income in Northfield in 2022:| Northfield: | $36,989 |
| State: | $49,281 |
Change in median per capita income between 2000 and 2022:| Northfield, New Hampshire: | +100.3% |
| New Hampshire: | +106.7% |
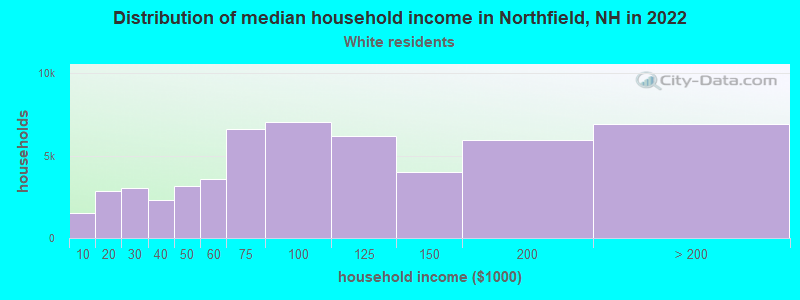
Income statistics for White residents
Median household income in Northfield, NH in 2022:| Northfield: | $77,853 |
| State: | $90,839 |
Change in median household income between 2000 and 2022:| Northfield, New Hampshire: | +74.4% |
| State: | +82.8% |
Number of households with income < $10k:| Northfield: | 2.9% (1,524) |
| State: | 3.1% (15,499) |
Number of households with income $10k - 20k:| Northfield: | 5.3% (2,832) |
| State: | 5.6% (27,915) |
Number of households with income $20k - 30k:| Northfield: | 5.7% (3,011) |
| State: | 5.4% (27,382) |
Number of households with income $30k - 40k:| Northfield: | 4.3% (2,289) |
| State: | 5.9% (29,681) |
Number of households with income $40k - 50k:| Northfield: | 6.0% (3,186) |
| State: | 5.7% (28,456) |
Number of households with income $50k - 60k:| Northfield: | 6.7% (3,576) |
| State: | 6.9% (34,641) |
Number of households with income $60k - 75k:| Northfield: | 12.4% (6,598) |
| State: | 9.0% (45,144) |
Number of households with income $75k - 100k:| Northfield: | 13.3% (7,049) |
| State: | 13.0% (65,259) |
Number of households with income $100k - 125k:| Northfield: | 11.7% (6,224) |
| State: | 10.7% (53,931) |
Number of households with income $125k - 150k:| Northfield: | 7.6% (4,019) |
| State: | 8.1% (40,466) |
Number of households with income $150k - 200k:| Northfield: | 11.2% (5,950) |
| New Hampshire: | 11.9% (59,781) |
Number of households with income > $200k:| Northfield: | 13.0% (6,925) |
| New Hampshire: | 14.8% (74,387) |
Aggregate household income in Northfield in 2022: $261,472,358
Median family income in Northfield in 2022:| Northfield: | $92,997 |
| State: | $115,125 |
Number of families with income < $10k:| Northfield: | 0.7% (6) |
| New Hampshire: | 1.5% (4,767) |
Number of families with income $10k - 20k:| Northfield: | 2.4% (19) |
| State: | 2.1% (6,602) |
Number of families with income $20k - 30k:| Northfield: | 6.3% (52) |
| New Hampshire: | 2.7% (8,511) |
Number of families with income $30k - 40k:| Northfield: | 6.9% (56) |
| State: | 4.0% (12,696) |
Number of families with income $40k - 50k:| Northfield: | 7.9% (64) |
| State: | 4.3% (13,626) |
Number of families with income $50k - 60k:| Northfield: | 6.7% (55) |
| State: | 5.6% (17,792) |
Number of families with income $60k - 75k:| Northfield: | 17.1% (140) |
| State: | 8.4% (26,945) |
Number of families with income $75k - 100k:| Northfield: | 20.2% (165) |
| State: | 13.8% (44,284) |
Number of families with income $100k - 125k:| Northfield: | 17.1% (140) |
| State: | 12.5% (39,959) |
Number of families with income $125k - 150k:| Northfield: | 2.8% (23) |
| State: | 10.3% (33,038) |
Number of families with income > $200k:| Northfield: | 11.8% (97) |
| New Hampshire: | 19.5% (62,442) |
Median non-family income in Northfield in 2022:| Northfield: | $46,694 |
| State: | $51,861 |
Change in median non-family income between 2000 and 2022:| Northfield, New Hampshire: | +77.3% |
| State: | +79.2% |
Median per capita income in Northfield in 2022:| Northfield: | $37,615 |
| State: | $50,469 |
Change in median per capita income between 2000 and 2022:| Northfield, New Hampshire: | +103.5% |
| State: | +109.2% |
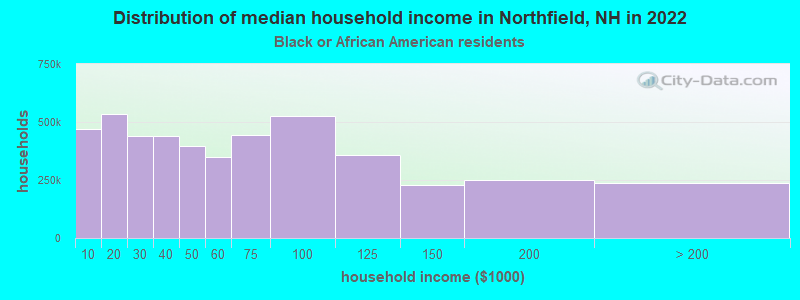
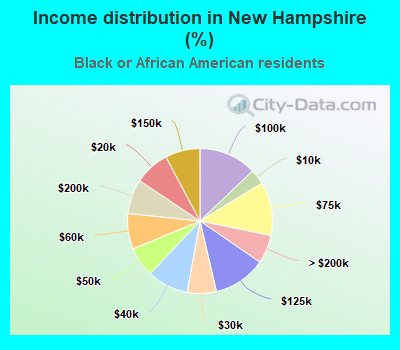
Income statistics for Black or African American residents
Median household income in Northfield, NH in 2022:| Northfield: | $14,623 |
| State: | $70,067 |
Change in median household income between 2000 and 2022:| Northfield, New Hampshire: | +67.1% |
| State: | +61.2% |
Number of households with income < $10k:| Northfield: | 10.1% (469,607) |
| New Hampshire: | 3.4% (202) |
Number of households with income $10k - 20k:| Northfield: | 11.4% (532,555) |
| New Hampshire: | 7.8% (463) |
Number of households with income $20k - 30k:| Northfield: | 9.4% (438,164) |
| State: | 6.5% (384) |
Number of households with income $30k - 40k:| Northfield: | 9.5% (441,422) |
| State: | 9.2% (544) |
Number of households with income $40k - 50k:| Northfield: | 8.5% (395,674) |
| State: | 6.7% (394) |
Number of households with income $50k - 60k:| Northfield: | 7.5% (349,558) |
| State: | 7.9% (469) |
Number of households with income $60k - 75k:| Northfield: | 9.5% (442,484) |
| State: | 11.9% (705) |
Number of households with income $75k - 100k:| Northfield: | 11.3% (527,452) |
| New Hampshire: | 12.9% (761) |
Number of households with income $100k - 125k:| Northfield: | 7.6% (356,360) |
| State: | 11.7% (694) |
Number of households with income $125k - 150k:| Northfield: | 4.9% (226,936) |
| State: | 7.8% (459) |
Number of households with income $150k - 200k:| Northfield: | 5.4% (252,099) |
| State: | 7.7% (456) |
Number of households with income > $200k:| Northfield: | 5.1% (236,242) |
| State: | 6.4% (377) |
Aggregate household income in Northfield in 2022: $184,354
Median per capita income in Northfield in 2022:| Northfield: | $37,130 |
| State: | $31,675 |
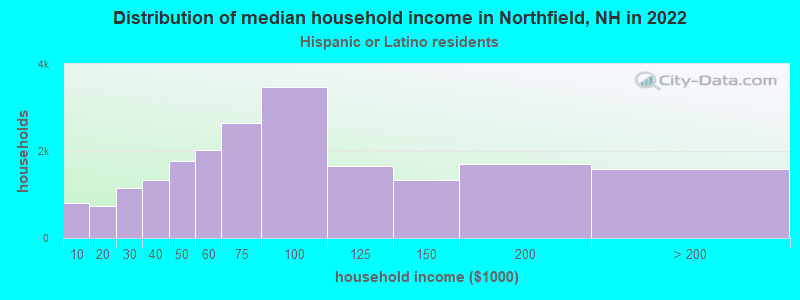
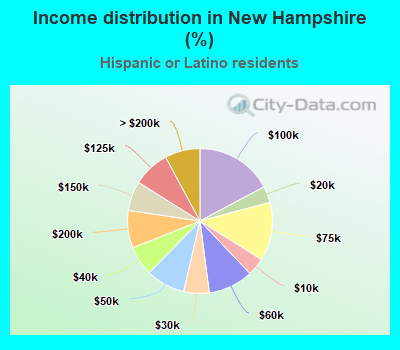
Income statistics for Hispanic or Latino residents
Median household income in Northfield, NH in 2022:| Northfield: | $69,822 |
| New Hampshire: | $73,813 |
Change in median household income between 2000 and 2022:| Northfield, New Hampshire: | +51.0% |
| New Hampshire: | +84.6% |
Number of households with income < $10k:| Northfield: | 4.0% (804) |
| New Hampshire: | 4.0% (695) |
Number of households with income $10k - 20k:| Northfield: | 3.7% (740) |
| New Hampshire: | 3.7% (639) |
Number of households with income $20k - 30k:| Northfield: | 5.7% (1,154) |
| State: | 5.7% (998) |
Number of households with income $30k - 40k:| Northfield: | 6.6% (1,331) |
| New Hampshire: | 6.6% (1,151) |
Number of households with income $40k - 50k:| Northfield: | 8.7% (1,760) |
| State: | 8.7% (1,521) |
Number of households with income $50k - 60k:| Northfield: | 10.0% (2,025) |
| New Hampshire: | 10.0% (1,751) |
Number of households with income $60k - 75k:| Northfield: | 13.1% (2,642) |
| State: | 13.1% (2,284) |
Number of households with income $75k - 100k:| Northfield: | 17.2% (3,475) |
| State: | 17.2% (3,004) |
Number of households with income $100k - 125k:| Northfield: | 8.2% (1,654) |
| New Hampshire: | 8.2% (1,430) |
Number of households with income $125k - 150k:| Northfield: | 6.6% (1,335) |
| State: | 6.6% (1,154) |
Number of households with income $150k - 200k:| Northfield: | 8.4% (1,691) |
| State: | 8.4% (1,462) |
Number of households with income > $200k:| Northfield: | 7.9% (1,586) |
| State: | 7.9% (1,371) |
Aggregate household income in Northfield in 2022: $1,089,990
Median family income in Northfield in 2022:| Northfield: | $72,017 |
| New Hampshire: | $74,056 |
Number of families with income < $10k:| Northfield: | 1.2% (0) |
| State: | 2.6% (310) |
Number of families with income $10k - 20k:| Northfield: | 2.7% (1) |
| New Hampshire: | 2.4% (286) |
Number of families with income $20k - 30k:| Northfield: | 14.4% (5) |
| New Hampshire: | 7.5% (884) |
Number of families with income $30k - 40k:| Northfield: | 15.2% (6) |
| New Hampshire: | 8.4% (994) |
Number of families with income $40k - 50k:| Northfield: | 14.5% (5) |
| State: | 9.9% (1,168) |
Number of families with income $50k - 60k:| Northfield: | 14.3% (5) |
| New Hampshire: | 9.3% (1,090) |
Number of families with income $60k - 75k:| Northfield: | 11.7% (4) |
| New Hampshire: | 10.6% (1,247) |
Number of families with income $75k - 100k:| Northfield: | 12.3% (5) |
| State: | 11.5% (1,349) |
Number of families with income $100k - 125k:| Northfield: | 7.2% (3) |
| New Hampshire: | 9.0% (1,054) |
Number of families with income $125k - 150k:| Northfield: | 1.7% (1) |
| State: | 7.6% (890) |
Number of families with income > $200k:| Northfield: | 4.7% (2) |
| State: | 10.6% (1,248) |
Median per capita income in Northfield in 2022:| Northfield: | $31,270 |
| State: | $32,911 |
Change in median per capita income between 2000 and 2022:| Northfield, New Hampshire: | +15.0% |
| State: | +127.3% |
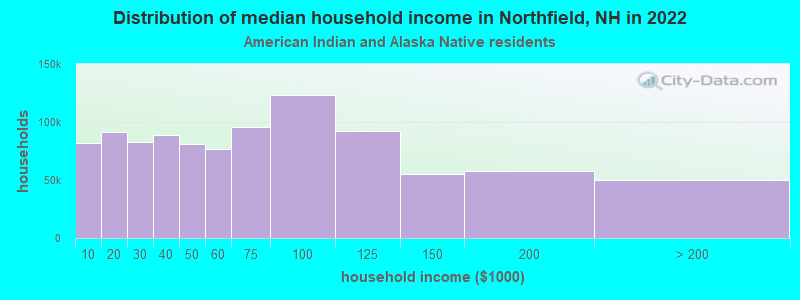
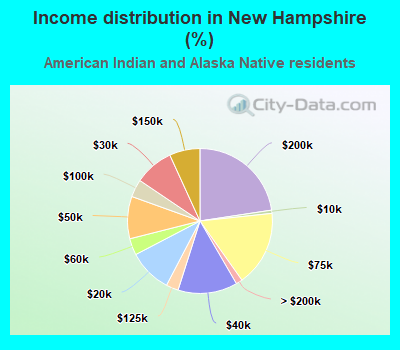
Income statistics for American Indian and Alaska Native residents
Number of households with income < $10k:| Northfield: | 8.2% (8) |
| New Hampshire: | 0.7% (6) |
Number of households with income $10k - 20k:| Northfield: | 9.2% (9) |
| New Hampshire: | 9.7% (81) |
Number of households with income $20k - 30k:| Northfield: | 8.2% (8) |
| State: | 8.7% (73) |
Number of households with income $30k - 40k:| Northfield: | 9.2% (9) |
| State: | 13.3% (111) |
Number of households with income $40k - 50k:| Northfield: | 8.2% (8) |
| New Hampshire: | 9.4% (79) |
Number of households with income $50k - 60k:| Northfield: | 8.2% (8) |
| New Hampshire: | 3.7% (31) |
Number of households with income $60k - 75k:| Northfield: | 10.2% (10) |
| State: | 16.9% (141) |
Number of households with income $75k - 100k:| Northfield: | 12.2% (12) |
| State: | 3.9% (33) |
Number of households with income $100k - 125k:| Northfield: | 9.2% (9) |
| State: | 2.8% (23) |
Number of households with income $125k - 150k:| Northfield: | 6.1% (6) |
| State: | 6.8% (57) |
Number of households with income $150k - 200k:| Northfield: | 6.1% (6) |
| New Hampshire: | 22.6% (189) |
Number of households with income > $200k:| Northfield: | 5.1% (5) |
| State: | 1.4% (12) |
Aggregate household income in Northfield in 2022: $7,605,264
Median per capita income in Northfield in 2022:| Northfield: | $66,024 |
| State: | $75,805 |
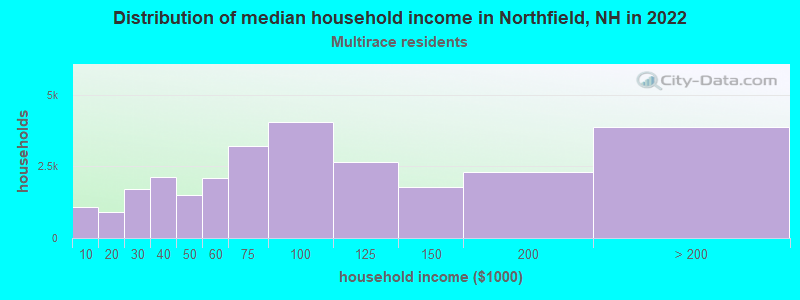
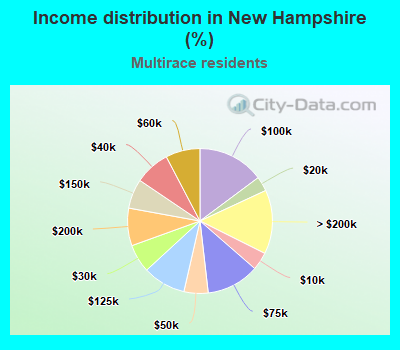
Income statistics for Multirace residents
Median household income in Northfield, NH in 2022:| Northfield: | $159,715 |
| New Hampshire: | $81,037 |
Change in median household income between 2000 and 2022:| Northfield, New Hampshire: | +111.6% |
| State: | +122.6% |
Number of households with income < $10k:| Northfield: | 4.0% (1,099) |
| State: | 4.0% (1,057) |
Number of households with income $10k - 20k:| Northfield: | 3.3% (892) |
| New Hampshire: | 3.3% (864) |
Number of households with income $20k - 30k:| Northfield: | 6.3% (1,725) |
| State: | 6.3% (1,664) |
Number of households with income $30k - 40k:| Northfield: | 7.8% (2,144) |
| State: | 7.9% (2,072) |
Number of households with income $40k - 50k:| Northfield: | 5.4% (1,486) |
| State: | 5.4% (1,422) |
Number of households with income $50k - 60k:| Northfield: | 7.7% (2,092) |
| State: | 7.7% (2,024) |
Number of households with income $60k - 75k:| Northfield: | 11.8% (3,216) |
| State: | 11.8% (3,109) |
Number of households with income $75k - 100k:| Northfield: | 14.8% (4,051) |
| New Hampshire: | 14.8% (3,906) |
Number of households with income $100k - 125k:| Northfield: | 9.7% (2,653) |
| State: | 9.6% (2,523) |
Number of households with income $125k - 150k:| Northfield: | 6.5% (1,788) |
| State: | 6.6% (1,734) |
Number of households with income $150k - 200k:| Northfield: | 8.4% (2,291) |
| State: | 8.4% (2,213) |
Number of households with income > $200k:| Northfield: | 14.2% (3,883) |
| State: | 14.3% (3,765) |
Aggregate household income in Northfield in 2022: $3,909,426
Median family income in Northfield in 2022:| Northfield: | $129,141 |
| New Hampshire: | $87,413 |
Number of families with income $75k - 100k:| Northfield: | 100.0% (65) |
| State: | 17.1% (3,272) |
Median per capita income in Northfield in 2022:| Northfield: | $34,345 |
| State: | $34,906 |
Change in median per capita income between 2000 and 2022:| Northfield, New Hampshire: | +70.6% |
| New Hampshire: | +135.6% |