Plympton, Massachusetts (MA) income map, earnings map, and wages data
The median household income in Plympton, MA in 2022 was $129,942, which was 27.3% greater than the median annual income of $94,488 across the entire state of Massachusetts. Compared to the median income of $70,045 in 2000 this represents an increase of 46.1%. The per capita income in 2022 was $53,190, which means an increase of 54.2% compared to 2000 when it was $24,344.
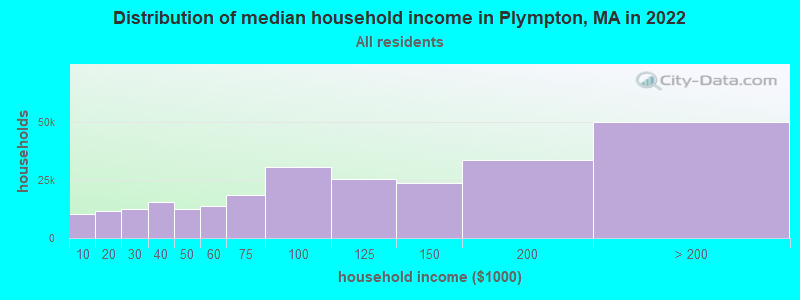
Income statistics for all residents
Median household income in Plympton, MA in 2022:| Plympton: | $129,943 |
| Massachusetts: | $94,488 |
Change in median household income between 2000 and 2022:| Plympton, Massachusetts: | +85.5% |
| State: | +87.1% |
Number of households with income < $10k:| Plympton: | 4.0% (10,407) |
| State: | 5.2% (146,170) |
Number of households with income $10k - 20k:| Plympton: | 4.5% (11,700) |
| Massachusetts: | 6.4% (180,001) |
Number of households with income $20k - 30k:| Plympton: | 4.9% (12,625) |
| Massachusetts: | 5.6% (156,667) |
Number of households with income $30k - 40k:| Plympton: | 6.0% (15,514) |
| State: | 5.6% (157,168) |
Number of households with income $40k - 50k:| Plympton: | 4.8% (12,310) |
| Massachusetts: | 5.4% (151,455) |
Number of households with income $50k - 60k:| Plympton: | 5.4% (13,946) |
| Massachusetts: | 5.1% (142,726) |
Number of households with income $60k - 75k:| Plympton: | 7.1% (18,399) |
| Massachusetts: | 7.6% (212,203) |
Number of households with income $75k - 100k:| Plympton: | 11.8% (30,623) |
| State: | 11.3% (317,064) |
Number of households with income $100k - 125k:| Plympton: | 9.9% (25,577) |
| Massachusetts: | 9.7% (270,603) |
Number of households with income $125k - 150k:| Plympton: | 9.2% (23,731) |
| Massachusetts: | 8.0% (223,140) |
Number of households with income $150k - 200k:| Plympton: | 13.1% (33,732) |
| State: | 11.0% (308,695) |
Number of households with income > $200k:| Plympton: | 19.3% (49,900) |
| State: | 19.0% (531,884) |
Aggregate household income in Plympton in 2022: $864,929,942
Median family income in Plympton in 2022:| Plympton: | $142,831 |
| State: | $120,263 |
Median non-family income in Plympton in 2022:| Plympton: | $56,523 |
| State: | $55,979 |
Change in median non-family income between 2000 and 2022:| Plympton, Massachusetts: | +86.5% |
| State: | +88.0% |
Median per capita income in Plympton in 2022:| Plympton: | $53,191 |
| State: | $54,025 |
Change in median per capita income between 2000 and 2022:| Plympton, Massachusetts: | +118.5% |
| State: | +108.2% |
Income statistics for White residents
Median household income in Plympton, MA in 2022:| Plympton: | $132,031 |
| State: | $101,391 |
Change in median household income between 2000 and 2022:| Plympton, Massachusetts: | +87.1% |
| Massachusetts: | +93.3% |
Number of households with income < $10k:| Plympton: | 3.7% (7,585) |
| State: | 4.4% (91,120) |
Number of households with income $10k - 20k:| Plympton: | 4.0% (8,149) |
| Massachusetts: | 5.9% (122,055) |
Number of households with income $20k - 30k:| Plympton: | 4.7% (9,572) |
| State: | 5.1% (105,311) |
Number of households with income $30k - 40k:| Plympton: | 5.9% (11,984) |
| State: | 5.3% (110,239) |
Number of households with income $40k - 50k:| Plympton: | 4.6% (9,318) |
| State: | 5.0% (104,636) |
Number of households with income $50k - 60k:| Plympton: | 5.0% (10,287) |
| State: | 4.8% (99,486) |
Number of households with income $60k - 75k:| Plympton: | 6.7% (13,684) |
| State: | 7.5% (155,124) |
Number of households with income $75k - 100k:| Plympton: | 11.6% (23,683) |
| Massachusetts: | 11.4% (236,252) |
Number of households with income $100k - 125k:| Plympton: | 10.8% (22,120) |
| State: | 9.9% (204,731) |
Number of households with income $125k - 150k:| Plympton: | 9.3% (19,042) |
| State: | 8.5% (175,324) |
Number of households with income $150k - 200k:| Plympton: | 13.0% (26,639) |
| State: | 11.7% (242,980) |
Number of households with income > $200k:| Plympton: | 20.8% (42,472) |
| Massachusetts: | 20.5% (425,966) |
Aggregate household income in Plympton in 2022: $690,306,337
Median family income in Plympton in 2022:| Plympton: | $149,489 |
| Massachusetts: | $133,153 |
Number of families with income $10k - 20k:| Plympton: | 1.5% (10) |
| State: | 2.1% (26,403) |
Number of families with income $20k - 30k:| Plympton: | 0.1% (0) |
| State: | 2.6% (32,525) |
Number of families with income $30k - 40k:| Plympton: | 4.9% (32) |
| Massachusetts: | 3.9% (48,079) |
Number of families with income $40k - 50k:| Plympton: | 4.0% (26) |
| Massachusetts: | 3.8% (46,908) |
Number of families with income $50k - 60k:| Plympton: | 3.7% (24) |
| State: | 3.8% (46,476) |
Number of families with income $60k - 75k:| Plympton: | 7.1% (47) |
| State: | 6.4% (79,040) |
Number of families with income $75k - 100k:| Plympton: | 16.8% (110) |
| State: | 11.1% (137,395) |
Number of families with income $100k - 125k:| Plympton: | 17.1% (112) |
| State: | 11.1% (136,771) |
Number of families with income $125k - 150k:| Plympton: | 12.6% (83) |
| State: | 10.0% (123,709) |
Number of families with income $150k - 200k:| Plympton: | 16.8% (110) |
| Massachusetts: | 14.7% (181,602) |
Number of families with income > $200k:| Plympton: | 15.3% (100) |
| State: | 28.5% (351,887) |
Median non-family income in Plympton in 2022:| Plympton: | $56,403 |
| Massachusetts: | $59,323 |
Change in median non-family income between 2000 and 2022:| Plympton, Massachusetts: | +86.1% |
| State: | +94.3% |
Median per capita income in Plympton in 2022:| Plympton: | $56,138 |
| Massachusetts: | $60,804 |
Change in median per capita income between 2000 and 2022:| Plympton, Massachusetts: | +127.4% |
| Massachusetts: | +118.7% |
Income statistics for Black or African American residents
Median household income in Plympton, MA in 2022:| Plympton: | $118,813 |
| Massachusetts: | $63,189 |
Change in median household income between 2000 and 2022:| Plympton, Massachusetts: | +121.0% |
| Massachusetts: | +87.4% |
Number of households with income < $10k:| Plympton: | 6.1% (1,279) |
| State: | 9.1% (15,797) |
Number of households with income $10k - 20k:| Plympton: | 7.5% (1,574) |
| State: | 9.4% (16,267) |
Number of households with income $20k - 30k:| Plympton: | 4.0% (832) |
| Massachusetts: | 7.8% (13,520) |
Number of households with income $30k - 40k:| Plympton: | 5.9% (1,251) |
| Massachusetts: | 8.3% (14,412) |
Number of households with income $40k - 50k:| Plympton: | 5.0% (1,058) |
| State: | 7.9% (13,790) |
Number of households with income $50k - 60k:| Plympton: | 6.1% (1,278) |
| Massachusetts: | 5.8% (10,041) |
Number of households with income $60k - 75k:| Plympton: | 10.2% (2,145) |
| State: | 8.5% (14,822) |
Number of households with income $75k - 100k:| Plympton: | 14.1% (2,969) |
| State: | 11.0% (19,122) |
Number of households with income $100k - 125k:| Plympton: | 5.5% (1,153) |
| State: | 8.4% (14,575) |
Number of households with income $125k - 150k:| Plympton: | 8.2% (1,731) |
| State: | 6.0% (10,429) |
Number of households with income $150k - 200k:| Plympton: | 13.5% (2,839) |
| State: | 7.2% (12,539) |
Number of households with income > $200k:| Plympton: | 14.0% (2,944) |
| State: | 10.5% (18,185) |
Aggregate household income in Plympton in 2022: $4,053,232
Median family income in Plympton in 2022:| Plympton: | $140,303 |
| State: | $79,815 |
Number of families with income $50k - 60k:| Plympton: | 69.7% (16) |
| State: | 6.4% (6,986) |
Number of families with income $60k - 75k:| Plympton: | 30.3% (7) |
| State: | 7.9% (8,699) |
Median per capita income in Plympton in 2022:| Plympton: | $35,582 |
| State: | $33,524 |
Change in median per capita income between 2000 and 2022:| Plympton, Massachusetts: | +127.3% |
| State: | +109.4% |
Income statistics for Hispanic or Latino residents
Median household income in Plympton, MA in 2022:| Plympton: | $425,980 |
| State: | $61,523 |
Change in median household income between 2000 and 2022:| Plympton, Massachusetts: | +113.0% |
| Massachusetts: | +125.4% |
Number of households with income < $10k:| Plympton: | 3.9% (1,540) |
| State: | 8.8% (25,307) |
Number of households with income $10k - 20k:| Plympton: | 0.0% (0) |
| Massachusetts: | 10.0% (28,653) |
Number of households with income $20k - 30k:| Plympton: | 9.2% (3,615) |
| State: | 8.8% (25,189) |
Number of households with income $30k - 40k:| Plympton: | 5.9% (2,313) |
| State: | 7.2% (20,822) |
Number of households with income $40k - 50k:| Plympton: | 7.3% (2,883) |
| State: | 7.2% (20,817) |
Number of households with income $50k - 60k:| Plympton: | 15.1% (5,951) |
| Massachusetts: | 6.5% (18,748) |
Number of households with income $60k - 75k:| Plympton: | 9.0% (3,546) |
| Massachusetts: | 8.8% (25,390) |
Number of households with income $75k - 100k:| Plympton: | 13.1% (5,173) |
| State: | 12.0% (34,488) |
Number of households with income $100k - 125k:| Plympton: | 7.6% (3,010) |
| State: | 8.6% (24,599) |
Number of households with income $125k - 150k:| Plympton: | 6.9% (2,699) |
| Massachusetts: | 6.2% (17,743) |
Number of households with income $150k - 200k:| Plympton: | 7.4% (2,929) |
| State: | 7.3% (21,017) |
Number of households with income > $200k:| Plympton: | 14.5% (5,715) |
| State: | 8.6% (24,606) |
Aggregate household income in Plympton in 2022: $6,815,186
Median family income in Plympton in 2022:| Plympton: | $421,917 |
| State: | $66,072 |
Number of families with income $10k - 20k:| Plympton: | 3.3% (3) |
| Massachusetts: | 6.0% (12,071) |
Number of families with income $20k - 30k:| Plympton: | 0.4% (0) |
| Massachusetts: | 10.1% (20,376) |
Number of families with income $30k - 40k:| Plympton: | 11.1% (10) |
| State: | 8.2% (16,470) |
Number of families with income $40k - 50k:| Plympton: | 7.4% (7) |
| State: | 7.4% (14,829) |
Number of families with income $50k - 60k:| Plympton: | 7.3% (6) |
| State: | 7.3% (14,643) |
Number of families with income $60k - 75k:| Plympton: | 16.0% (14) |
| State: | 10.6% (21,252) |
Number of families with income $75k - 100k:| Plympton: | 20.3% (18) |
| State: | 12.0% (24,088) |
Number of families with income $100k - 125k:| Plympton: | 14.1% (12) |
| State: | 8.9% (17,954) |
Number of families with income $125k - 150k:| Plympton: | 8.7% (8) |
| Massachusetts: | 6.9% (13,837) |
Number of families with income $150k - 200k:| Plympton: | 7.9% (7) |
| State: | 7.3% (14,683) |
Number of families with income > $200k:| Plympton: | 3.5% (3) |
| State: | 9.3% (18,741) |
Median per capita income in Plympton in 2022:| Plympton: | $114,306 |
| State: | $28,993 |
Income statistics for American Indian and Alaska Native residents
Median household income in Plympton, MA in 2022:| Plympton: | $88,396 |
| State: | $87,730 |
Number of households with income < $10k:| Plympton: | 6.6% (260) |
| Massachusetts: | 6.6% (451) |
Number of households with income $10k - 20k:| Plympton: | 7.0% (275) |
| Massachusetts: | 7.0% (476) |
Number of households with income $20k - 30k:| Plympton: | 2.8% (111) |
| Massachusetts: | 2.8% (192) |
Number of households with income $30k - 40k:| Plympton: | 3.2% (126) |
| State: | 3.2% (218) |
Number of households with income $40k - 50k:| Plympton: | 2.9% (115) |
| Massachusetts: | 2.9% (199) |
Number of households with income $50k - 60k:| Plympton: | 9.9% (391) |
| Massachusetts: | 9.9% (677) |
Number of households with income $60k - 75k:| Plympton: | 11.5% (451) |
| State: | 11.5% (781) |
Number of households with income $75k - 100k:| Plympton: | 9.2% (363) |
| State: | 9.2% (629) |
Number of households with income $100k - 125k:| Plympton: | 5.9% (234) |
| State: | 6.0% (406) |
Number of households with income $125k - 150k:| Plympton: | 13.5% (532) |
| State: | 13.5% (921) |
Number of households with income $150k - 200k:| Plympton: | 12.6% (496) |
| Massachusetts: | 12.6% (859) |
Number of households with income > $200k:| Plympton: | 14.7% (579) |
| State: | 14.7% (1,003) |
Aggregate household income in Plympton in 2022: $226,412
Median family income in Plympton in 2022:| Plympton: | $73,041 |
| Massachusetts: | $105,715 |
Median per capita income in Plympton in 2022:| Plympton: | $12,724 |
| State: | $39,434 |
Change in median per capita income between 2000 and 2022:| Plympton, Massachusetts: | +130.6% |
| Massachusetts: | +148.2% |
Income statistics for Multirace residents
Median household income in Plympton, MA in 2022:| Plympton: | $160,111 |
| Massachusetts: | $71,552 |
Change in median household income between 2000 and 2022:| Plympton, Massachusetts: | +105.5% |
| Massachusetts: | +109.0% |
Number of households with income < $10k:| Plympton: | 1.1% (266) |
| State: | 6.6% (15,127) |
Number of households with income $10k - 20k:| Plympton: | 4.6% (1,138) |
| State: | 9.2% (21,158) |
Number of households with income $20k - 30k:| Plympton: | 6.1% (1,518) |
| State: | 7.8% (18,016) |
Number of households with income $30k - 40k:| Plympton: | 8.7% (2,145) |
| State: | 7.9% (18,260) |
Number of households with income $40k - 50k:| Plympton: | 5.1% (1,252) |
| State: | 5.6% (13,027) |
Number of households with income $50k - 60k:| Plympton: | 3.7% (909) |
| State: | 5.6% (12,909) |
Number of households with income $60k - 75k:| Plympton: | 10.9% (2,706) |
| State: | 9.0% (20,800) |
Number of households with income $75k - 100k:| Plympton: | 14.8% (3,657) |
| State: | 12.1% (27,875) |
Number of households with income $100k - 125k:| Plympton: | 6.2% (1,534) |
| State: | 8.1% (18,754) |
Number of households with income $125k - 150k:| Plympton: | 11.8% (2,924) |
| Massachusetts: | 6.8% (15,621) |
Number of households with income $150k - 200k:| Plympton: | 17.2% (4,251) |
| Massachusetts: | 9.4% (21,618) |
Number of households with income > $200k:| Plympton: | 9.9% (2,438) |
| State: | 12.0% (27,592) |
Aggregate household income in Plympton in 2022: $24,084,898
Median family income in Plympton in 2022:| Plympton: | $149,192 |
| Massachusetts: | $78,380 |
Number of families with income $40k - 50k:| Plympton: | 4.6% (10) |
| State: | 5.3% (8,255) |
Number of families with income $75k - 100k:| Plympton: | 19.8% (44) |
| Massachusetts: | 12.1% (18,758) |
Number of families with income $125k - 150k:| Plympton: | 75.6% (169) |
| Massachusetts: | 7.2% (11,128) |
Median per capita income in Plympton in 2022:| Plympton: | $65,071 |
| State: | $34,029 |
Change in median per capita income between 2000 and 2022:| Plympton, Massachusetts: | +132.9% |
| State: | +132.1% |