Seymour Rural, Texas (TX) income map, earnings map, and wages data
The median household income in Seymour Rural, TX in 2022 was $56,843, which was 27.2% less than the median annual income of $72,284 across the entire state of Texas. Compared to the median income of $30,833 in 2000 this represents an increase of 45.8%. The per capita income in 2022 was $31,522, which means an increase of 48.5% compared to 2000 when it was $16,231.
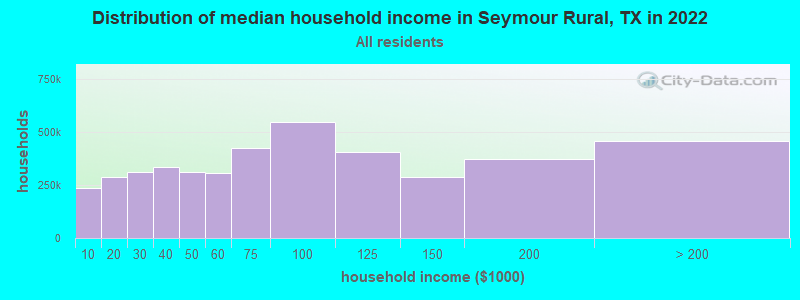
Income statistics for all residents
Median household income in Seymour Rural, TX in 2022:| Seymour Rural: | $56,843 |
| State: | $72,284 |
Change in median household income between 2000 and 2022:| Seymour Rural, Texas: | +84.4% |
| Texas: | +81.0% |
Number of households with income < $10k:| Seymour Rural: | 5.5% (235,793) |
| State: | 5.5% (611,011) |
Number of households with income $10k - 20k:| Seymour Rural: | 6.7% (286,938) |
| State: | 6.7% (743,157) |
Number of households with income $20k - 30k:| Seymour Rural: | 7.2% (310,200) |
| Texas: | 7.2% (803,381) |
Number of households with income $30k - 40k:| Seymour Rural: | 7.8% (334,371) |
| Texas: | 7.8% (866,080) |
Number of households with income $40k - 50k:| Seymour Rural: | 7.3% (312,902) |
| State: | 7.3% (810,440) |
Number of households with income $50k - 60k:| Seymour Rural: | 7.2% (308,747) |
| State: | 7.2% (799,783) |
Number of households with income $60k - 75k:| Seymour Rural: | 9.9% (422,881) |
| State: | 9.9% (1,095,384) |
Number of households with income $75k - 100k:| Seymour Rural: | 12.8% (547,987) |
| State: | 12.8% (1,419,057) |
Number of households with income $100k - 125k:| Seymour Rural: | 9.5% (407,279) |
| State: | 9.5% (1,054,577) |
Number of households with income $125k - 150k:| Seymour Rural: | 6.7% (286,447) |
| State: | 6.7% (741,518) |
Number of households with income $150k - 200k:| Seymour Rural: | 8.7% (371,325) |
| Texas: | 8.7% (961,776) |
Number of households with income > $200k:| Seymour Rural: | 10.7% (455,985) |
| State: | 10.7% (1,181,544) |
Aggregate household income in Seymour Rural in 2022: $3,485,390,184
Median family income in Seymour Rural in 2022:| Seymour Rural: | $71,314 |
| State: | $86,267 |
Median non-family income in Seymour Rural in 2022:| Seymour Rural: | $39,775 |
| Texas: | $45,999 |
Change in median non-family income between 2000 and 2022:| Seymour Rural, Texas: | +85.2% |
| State: | +79.5% |
Median per capita income in Seymour Rural in 2022:| Seymour Rural: | $31,523 |
| Texas: | $38,123 |
Change in median per capita income between 2000 and 2022:| Seymour Rural, Texas: | +94.2% |
| State: | +94.3% |
Income statistics for White residents
Median household income in Seymour Rural, TX in 2022:| Seymour Rural: | $59,100 |
| State: | $82,032 |
Change in median household income between 2000 and 2022:| Seymour Rural, Texas: | +90.4% |
| State: | +91.0% |
Number of households with income < $10k:| Seymour Rural: | 4.7% (98,628) |
| Texas: | 4.7% (273,716) |
Number of households with income $10k - 20k:| Seymour Rural: | 5.5% (116,492) |
| Texas: | 5.5% (322,702) |
Number of households with income $20k - 30k:| Seymour Rural: | 6.2% (131,453) |
| State: | 6.2% (363,947) |
Number of households with income $30k - 40k:| Seymour Rural: | 6.8% (144,088) |
| Texas: | 6.8% (399,275) |
Number of households with income $40k - 50k:| Seymour Rural: | 6.5% (138,317) |
| State: | 6.5% (383,417) |
Number of households with income $50k - 60k:| Seymour Rural: | 6.6% (140,137) |
| Texas: | 6.6% (388,535) |
Number of households with income $60k - 75k:| Seymour Rural: | 9.6% (203,982) |
| Texas: | 9.7% (566,295) |
Number of households with income $75k - 100k:| Seymour Rural: | 13.0% (274,118) |
| Texas: | 13.0% (760,276) |
Number of households with income $100k - 125k:| Seymour Rural: | 10.2% (215,467) |
| State: | 10.2% (597,596) |
Number of households with income $125k - 150k:| Seymour Rural: | 7.4% (157,458) |
| Texas: | 7.4% (436,830) |
Number of households with income $150k - 200k:| Seymour Rural: | 9.9% (210,003) |
| Texas: | 9.9% (583,067) |
Number of households with income > $200k:| Seymour Rural: | 13.5% (284,743) |
| State: | 13.5% (792,647) |
Aggregate household income in Seymour Rural in 2022: $1,973,978,880
Median family income in Seymour Rural in 2022:| Seymour Rural: | $70,202 |
| Texas: | $101,788 |
Number of families with income < $10k:| Seymour Rural: | 2.2% (3) |
| State: | 2.8% (108,142) |
Number of families with income $10k - 20k:| Seymour Rural: | 12.7% (19) |
| State: | 2.9% (113,421) |
Number of families with income $20k - 30k:| Seymour Rural: | 12.1% (18) |
| Texas: | 4.1% (157,688) |
Number of families with income $30k - 40k:| Seymour Rural: | 13.4% (20) |
| Texas: | 5.2% (198,847) |
Number of families with income $40k - 50k:| Seymour Rural: | 17.0% (25) |
| Texas: | 5.6% (216,490) |
Number of families with income $50k - 60k:| Seymour Rural: | 9.2% (14) |
| State: | 5.7% (220,689) |
Number of families with income $60k - 75k:| Seymour Rural: | 8.8% (13) |
| State: | 9.0% (346,106) |
Number of families with income $75k - 100k:| Seymour Rural: | 16.5% (25) |
| State: | 13.7% (527,363) |
Number of families with income $100k - 125k:| Seymour Rural: | 8.1% (12) |
| Texas: | 11.6% (448,411) |
Median non-family income in Seymour Rural in 2022:| Seymour Rural: | $40,779 |
| Texas: | $50,587 |
Change in median non-family income between 2000 and 2022:| Seymour Rural, Texas: | +85.8% |
| State: | +87.7% |
Median per capita income in Seymour Rural in 2022:| Seymour Rural: | $34,216 |
| Texas: | $47,740 |
Change in median per capita income between 2000 and 2022:| Seymour Rural, Texas: | +112.1% |
| Texas: | +114.3% |
Income statistics for Black or African American residents
Median household income in Seymour Rural, TX in 2022:| Seymour Rural: | $74,739 |
| State: | $55,759 |
Change in median household income between 2000 and 2022:| Seymour Rural, Texas: | +113.5% |
| State: | +90.3% |
Number of households with income < $10k:| Seymour Rural: | 8.9% (75,192) |
| Texas: | 8.9% (126,378) |
Number of households with income $10k - 20k:| Seymour Rural: | 9.9% (84,065) |
| State: | 9.9% (140,369) |
Number of households with income $20k - 30k:| Seymour Rural: | 8.5% (72,324) |
| Texas: | 8.5% (120,639) |
Number of households with income $30k - 40k:| Seymour Rural: | 9.7% (81,771) |
| State: | 9.7% (137,517) |
Number of households with income $40k - 50k:| Seymour Rural: | 7.9% (67,177) |
| State: | 8.0% (112,973) |
Number of households with income $50k - 60k:| Seymour Rural: | 8.2% (69,607) |
| Texas: | 8.3% (117,156) |
Number of households with income $60k - 75k:| Seymour Rural: | 10.4% (87,869) |
| State: | 10.4% (147,462) |
Number of households with income $75k - 100k:| Seymour Rural: | 11.5% (97,022) |
| Texas: | 11.5% (162,718) |
Number of households with income $100k - 125k:| Seymour Rural: | 8.1% (68,886) |
| State: | 8.2% (115,829) |
Number of households with income $125k - 150k:| Seymour Rural: | 4.9% (41,744) |
| Texas: | 4.9% (69,556) |
Number of households with income $150k - 200k:| Seymour Rural: | 6.4% (54,065) |
| Texas: | 6.4% (90,701) |
Number of households with income > $200k:| Seymour Rural: | 5.5% (46,449) |
| State: | 5.5% (77,988) |
Aggregate household income in Seymour Rural in 2022: $5,045,277
Median family income in Seymour Rural in 2022:| Seymour Rural: | $78,328 |
| Texas: | $69,134 |
Median per capita income in Seymour Rural in 2022:| Seymour Rural: | $37,016 |
| State: | $30,490 |
Change in median per capita income between 2000 and 2022:| Seymour Rural, Texas: | +116.3% |
| Texas: | +113.9% |
Income statistics for Hispanic or Latino residents
Median household income in Seymour Rural, TX in 2022:| Seymour Rural: | $49,803 |
| State: | $60,504 |
Change in median household income between 2000 and 2022:| Seymour Rural, Texas: | +112.9% |
| State: | +102.5% |
Number of households with income < $10k:| Seymour Rural: | 5.8% (83,864) |
| State: | 5.8% (213,953) |
Number of households with income $10k - 20k:| Seymour Rural: | 8.0% (116,635) |
| Texas: | 8.0% (297,456) |
Number of households with income $20k - 30k:| Seymour Rural: | 9.2% (133,264) |
| State: | 9.2% (340,166) |
Number of households with income $30k - 40k:| Seymour Rural: | 9.5% (138,941) |
| State: | 9.5% (354,336) |
Number of households with income $40k - 50k:| Seymour Rural: | 8.8% (128,140) |
| Texas: | 8.8% (327,013) |
Number of households with income $50k - 60k:| Seymour Rural: | 8.3% (120,939) |
| State: | 8.3% (308,818) |
Number of households with income $60k - 75k:| Seymour Rural: | 10.9% (158,788) |
| State: | 10.9% (405,109) |
Number of households with income $75k - 100k:| Seymour Rural: | 13.8% (200,633) |
| State: | 13.8% (511,639) |
Number of households with income $100k - 125k:| Seymour Rural: | 8.6% (125,386) |
| State: | 8.6% (319,728) |
Number of households with income $125k - 150k:| Seymour Rural: | 5.7% (82,792) |
| State: | 5.7% (210,932) |
Number of households with income $150k - 200k:| Seymour Rural: | 6.4% (92,463) |
| State: | 6.4% (236,055) |
Number of households with income > $200k:| Seymour Rural: | 5.1% (74,235) |
| State: | 5.1% (189,259) |
Aggregate household income in Seymour Rural in 2022: $16,399,263
Median family income in Seymour Rural in 2022:| Seymour Rural: | $52,869 |
| State: | $65,080 |
Number of families with income < $10k:| Seymour Rural: | 3.9% (7) |
| Texas: | 5.3% (147,493) |
Number of families with income $10k - 20k:| Seymour Rural: | 24.8% (46) |
| Texas: | 6.3% (174,531) |
Number of families with income $20k - 30k:| Seymour Rural: | 16.0% (30) |
| Texas: | 8.6% (238,528) |
Number of families with income $30k - 40k:| Seymour Rural: | 14.5% (27) |
| Texas: | 9.1% (251,999) |
Number of families with income $40k - 50k:| Seymour Rural: | 15.8% (29) |
| Texas: | 8.6% (240,188) |
Number of families with income $50k - 60k:| Seymour Rural: | 7.2% (13) |
| State: | 8.0% (223,566) |
Number of families with income $60k - 75k:| Seymour Rural: | 5.8% (11) |
| State: | 10.9% (302,688) |
Number of families with income $75k - 100k:| Seymour Rural: | 8.8% (16) |
| State: | 14.3% (398,554) |
Number of families with income $100k - 125k:| Seymour Rural: | 3.1% (6) |
| State: | 9.5% (264,007) |
Median non-family income in Seymour Rural in 2022:| Seymour Rural: | $5,518 |
| Texas: | $39,934 |
Change in median non-family income between 2000 and 2022:| Seymour Rural, Texas: | +120.8% |
| State: | +109.1% |
Median per capita income in Seymour Rural in 2022:| Seymour Rural: | $19,098 |
| Texas: | $24,862 |
Change in median per capita income between 2000 and 2022:| Seymour Rural, Texas: | +128.5% |
| Texas: | +130.8% |
Income statistics for American Indian and Alaska Native residents
Median household income in Seymour Rural, TX in 2022:| Seymour Rural: | $126,525 |
| Texas: | $65,765 |
Change in median household income between 2000 and 2022:| Seymour Rural, Texas: | +93.7% |
| State: | +88.3% |
Number of households with income < $10k:| Seymour Rural: | 4.1% (3,183) |
| State: | 4.1% (3,398) |
Number of households with income $10k - 20k:| Seymour Rural: | 8.3% (6,508) |
| State: | 8.3% (6,949) |
Number of households with income $20k - 30k:| Seymour Rural: | 9.3% (7,251) |
| State: | 9.3% (7,742) |
Number of households with income $30k - 40k:| Seymour Rural: | 9.1% (7,136) |
| State: | 9.1% (7,627) |
Number of households with income $40k - 50k:| Seymour Rural: | 7.1% (5,552) |
| State: | 7.1% (5,922) |
Number of households with income $50k - 60k:| Seymour Rural: | 8.1% (6,334) |
| Texas: | 8.1% (6,761) |
Number of households with income $60k - 75k:| Seymour Rural: | 12.7% (9,913) |
| Texas: | 12.7% (10,588) |
Number of households with income $75k - 100k:| Seymour Rural: | 13.0% (10,215) |
| State: | 13.0% (10,903) |
Number of households with income $100k - 125k:| Seymour Rural: | 9.9% (7,734) |
| Texas: | 9.9% (8,256) |
Number of households with income $125k - 150k:| Seymour Rural: | 5.2% (4,076) |
| State: | 5.2% (4,355) |
Number of households with income $150k - 200k:| Seymour Rural: | 6.7% (5,261) |
| State: | 6.7% (5,623) |
Number of households with income > $200k:| Seymour Rural: | 6.6% (5,165) |
| State: | 6.6% (5,522) |
Aggregate household income in Seymour Rural in 2022: $2,236,913
Median family income in Seymour Rural in 2022:| Seymour Rural: | $126,332 |
| State: | $72,369 |
Number of families with income $60k - 75k:| Seymour Rural: | 100.0% (21) |
| State: | 12.1% (7,429) |
Median non-family income in Seymour Rural in 2022:| Seymour Rural: | $33,776 |
| State: | $40,351 |
Change in median non-family income between 2000 and 2022:| Seymour Rural, Texas: | +80.1% |
| State: | +71.9% |
Median per capita income in Seymour Rural in 2022:| Seymour Rural: | $40,768 |
| State: | $28,166 |
Change in median per capita income between 2000 and 2022:| Seymour Rural, Texas: | +95.5% |
| State: | +77.2% |
Income statistics for other residents
Aggregate household income in Seymour Rural in 2022: $12,561
Median non-family income in Seymour Rural in 2022:| Seymour Rural: | $5,596 |
| State: | $38,690 |
Change in median non-family income between 2000 and 2022:| Seymour Rural, Texas: | +123.9% |
| Texas: | +90.2% |
Median per capita income in Seymour Rural in 2022:| Seymour Rural: | $484 |
| State: | $23,899 |