South Shore, Washington (WA) income map, earnings map, and wages data
The median household income in South Shore, WA in 2022 was $56,911, which was 60.4% less than the median annual income of $91,306 across the entire state of Washington. Compared to the median income of $31,094 in 2000 this represents an increase of 45.4%. The per capita income in 2022 was $36,888, which means an increase of 48.7% compared to 2000 when it was $18,942.
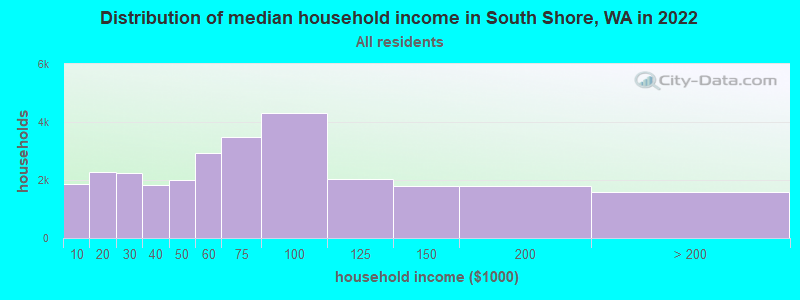
Income statistics for all residents
Median household income in South Shore, WA in 2022:| South Shore: | $56,911 |
| State: | $91,306 |
Change in median household income between 2000 and 2022:| South Shore, Washington: | +83.0% |
| State: | +99.5% |
Number of households with income < $10k:| South Shore: | 6.7% (1,879) |
| Washington: | 4.5% (139,331) |
Number of households with income $10k - 20k:| South Shore: | 8.1% (2,293) |
| State: | 5.0% (154,508) |
Number of households with income $20k - 30k:| South Shore: | 8.0% (2,255) |
| Washington: | 5.4% (166,555) |
Number of households with income $30k - 40k:| South Shore: | 6.5% (1,838) |
| State: | 5.5% (170,324) |
Number of households with income $40k - 50k:| South Shore: | 7.1% (2,007) |
| Washington: | 6.0% (183,941) |
Number of households with income $50k - 60k:| South Shore: | 10.4% (2,946) |
| State: | 6.1% (187,395) |
Number of households with income $60k - 75k:| South Shore: | 12.3% (3,484) |
| Washington: | 8.7% (266,771) |
Number of households with income $75k - 100k:| South Shore: | 15.3% (4,321) |
| Washington: | 13.1% (404,672) |
Number of households with income $100k - 125k:| South Shore: | 7.2% (2,041) |
| Washington: | 11.0% (337,911) |
Number of households with income $125k - 150k:| South Shore: | 6.4% (1,798) |
| Washington: | 8.0% (244,934) |
Number of households with income $150k - 200k:| South Shore: | 6.3% (1,777) |
| State: | 10.5% (323,812) |
Number of households with income > $200k:| South Shore: | 5.6% (1,575) |
| State: | 16.2% (499,799) |
Aggregate household income in South Shore in 2022: $192,304,674
Median family income in South Shore in 2022:| South Shore: | $75,343 |
| State: | $109,192 |
Median non-family income in South Shore in 2022:| South Shore: | $42,150 |
| State: | $57,299 |
Change in median non-family income between 2000 and 2022:| South Shore, Washington: | +108.4% |
| State: | +94.9% |
Median per capita income in South Shore in 2022:| South Shore: | $36,888 |
| Washington: | $50,764 |
Change in median per capita income between 2000 and 2022:| South Shore, Washington: | +94.7% |
| State: | +121.0% |
Income statistics for White residents
Median household income in South Shore, WA in 2022:| South Shore: | $56,998 |
| State: | $91,916 |
Change in median household income between 2000 and 2022:| South Shore, Washington: | +83.5% |
| State: | +95.4% |
Number of households with income < $10k:| South Shore: | 6.7% (1,561) |
| Washington: | 4.3% (95,850) |
Number of households with income $10k - 20k:| South Shore: | 7.8% (1,811) |
| State: | 4.8% (106,421) |
Number of households with income $20k - 30k:| South Shore: | 7.8% (1,805) |
| State: | 5.5% (122,860) |
Number of households with income $30k - 40k:| South Shore: | 5.3% (1,236) |
| State: | 5.4% (119,627) |
Number of households with income $40k - 50k:| South Shore: | 7.0% (1,620) |
| Washington: | 5.9% (132,276) |
Number of households with income $50k - 60k:| South Shore: | 10.9% (2,521) |
| State: | 6.1% (136,212) |
Number of households with income $60k - 75k:| South Shore: | 11.7% (2,729) |
| State: | 8.8% (196,086) |
Number of households with income $75k - 100k:| South Shore: | 16.1% (3,745) |
| State: | 13.4% (299,192) |
Number of households with income $100k - 125k:| South Shore: | 7.2% (1,671) |
| Washington: | 11.3% (252,209) |
Number of households with income $125k - 150k:| South Shore: | 6.4% (1,488) |
| State: | 7.9% (175,962) |
Number of households with income $150k - 200k:| South Shore: | 6.9% (1,602) |
| State: | 10.7% (239,156) |
Number of households with income > $200k:| South Shore: | 6.2% (1,440) |
| State: | 16.1% (359,917) |
Aggregate household income in South Shore in 2022: $173,208,608
Median family income in South Shore in 2022:| South Shore: | $76,892 |
| Washington: | $112,511 |
Number of families with income < $10k:| South Shore: | 3.1% (39) |
| Washington: | 2.4% (33,676) |
Number of families with income $10k - 20k:| South Shore: | 2.1% (27) |
| State: | 2.0% (28,228) |
Number of families with income $20k - 30k:| South Shore: | 1.3% (16) |
| State: | 2.9% (39,288) |
Number of families with income $30k - 40k:| South Shore: | 4.6% (59) |
| State: | 3.6% (50,190) |
Number of families with income $40k - 50k:| South Shore: | 4.8% (61) |
| State: | 4.6% (63,009) |
Number of families with income $50k - 60k:| South Shore: | 7.5% (95) |
| State: | 5.0% (69,270) |
Number of families with income $60k - 75k:| South Shore: | 17.2% (220) |
| State: | 8.2% (112,369) |
Number of families with income $75k - 100k:| South Shore: | 15.6% (199) |
| Washington: | 14.1% (194,214) |
Number of families with income $100k - 125k:| South Shore: | 9.1% (116) |
| Washington: | 13.2% (182,184) |
Number of families with income $125k - 150k:| South Shore: | 14.5% (186) |
| State: | 9.5% (130,928) |
Number of families with income $150k - 200k:| South Shore: | 7.2% (92) |
| State: | 13.7% (188,621) |
Number of families with income > $200k:| South Shore: | 13.1% (167) |
| State: | 20.8% (285,982) |
Median non-family income in South Shore in 2022:| South Shore: | $41,670 |
| State: | $56,103 |
Change in median non-family income between 2000 and 2022:| South Shore, Washington: | +104.7% |
| State: | +87.7% |
Median per capita income in South Shore in 2022:| South Shore: | $38,818 |
| Washington: | $55,212 |
Change in median per capita income between 2000 and 2022:| South Shore, Washington: | +102.3% |
| Washington: | +123.8% |
Income statistics for Black or African American residents
Aggregate household income in South Shore in 2022: $351,774
Median per capita income in South Shore in 2022:| South Shore: | $28,234 |
| State: | $38,209 |
Change in median per capita income between 2000 and 2022:| South Shore, Washington: | +92.8% |
| Washington: | +115.3% |
Income statistics for Asian residents
Number of households with income < $10k:| South Shore: | 4.9% (1,946) |
| State: | 4.9% (14,099) |
Number of households with income $10k - 20k:| South Shore: | 3.5% (1,363) |
| Washington: | 3.5% (9,873) |
Number of households with income $20k - 30k:| South Shore: | 2.9% (1,153) |
| State: | 2.9% (8,352) |
Number of households with income $30k - 40k:| South Shore: | 4.0% (1,576) |
| State: | 4.0% (11,415) |
Number of households with income $40k - 50k:| South Shore: | 4.0% (1,576) |
| State: | 4.0% (11,421) |
Number of households with income $50k - 60k:| South Shore: | 4.2% (1,670) |
| State: | 4.2% (12,100) |
Number of households with income $60k - 75k:| South Shore: | 6.3% (2,471) |
| State: | 6.3% (17,903) |
Number of households with income $75k - 100k:| South Shore: | 10.4% (4,094) |
| Washington: | 10.4% (29,663) |
Number of households with income $100k - 125k:| South Shore: | 9.4% (3,705) |
| State: | 9.4% (26,839) |
Number of households with income $125k - 150k:| South Shore: | 8.5% (3,340) |
| Washington: | 8.5% (24,200) |
Number of households with income $150k - 200k:| South Shore: | 12.6% (4,966) |
| State: | 12.6% (35,976) |
Number of households with income > $200k:| South Shore: | 29.2% (11,472) |
| State: | 29.2% (83,109) |
Median per capita income in South Shore in 2022:| South Shore: | $17,511 |
| Washington: | $67,666 |
Income statistics for Hispanic or Latino residents
Median household income in South Shore, WA in 2022:| South Shore: | $33,320 |
| State: | $74,770 |
Change in median household income between 2000 and 2022:| South Shore, Washington: | +93.4% |
| Washington: | +128.3% |
Number of households with income < $10k:| South Shore: | 4.9% (3,776) |
| State: | 4.9% (14,456) |
Number of households with income $10k - 20k:| South Shore: | 5.3% (4,066) |
| Washington: | 5.3% (15,449) |
Number of households with income $20k - 30k:| South Shore: | 6.8% (5,260) |
| State: | 6.8% (20,016) |
Number of households with income $30k - 40k:| South Shore: | 7.7% (5,929) |
| State: | 7.7% (22,548) |
Number of households with income $40k - 50k:| South Shore: | 7.3% (5,653) |
| State: | 7.3% (21,450) |
Number of households with income $50k - 60k:| South Shore: | 7.7% (5,971) |
| Washington: | 7.7% (22,744) |
Number of households with income $60k - 75k:| South Shore: | 10.4% (8,051) |
| State: | 10.5% (30,737) |
Number of households with income $75k - 100k:| South Shore: | 14.9% (11,476) |
| Washington: | 14.9% (43,843) |
Number of households with income $100k - 125k:| South Shore: | 11.1% (8,560) |
| State: | 11.1% (32,554) |
Number of households with income $125k - 150k:| South Shore: | 7.4% (5,670) |
| Washington: | 7.4% (21,624) |
Number of households with income $150k - 200k:| South Shore: | 7.3% (5,608) |
| Washington: | 7.3% (21,360) |
Number of households with income > $200k:| South Shore: | 9.2% (7,100) |
| State: | 9.2% (27,055) |
Aggregate household income in South Shore in 2022: $4,085,997
Median family income in South Shore in 2022:| South Shore: | $38,599 |
| State: | $76,866 |
Number of families with income < $10k:| South Shore: | 11.2% (18) |
| State: | 4.4% (9,443) |
Number of families with income $10k - 20k:| South Shore: | 7.1% (11) |
| State: | 3.5% (7,524) |
Number of families with income $20k - 30k:| South Shore: | 9.9% (16) |
| Washington: | 5.6% (12,052) |
Number of families with income $30k - 40k:| South Shore: | 12.6% (20) |
| State: | 8.3% (17,803) |
Number of families with income $40k - 50k:| South Shore: | 8.6% (14) |
| Washington: | 7.7% (16,361) |
Number of families with income $50k - 60k:| South Shore: | 7.4% (12) |
| State: | 7.9% (16,852) |
Number of families with income $60k - 75k:| South Shore: | 11.9% (19) |
| State: | 11.4% (24,342) |
Number of families with income $75k - 100k:| South Shore: | 8.9% (14) |
| State: | 14.4% (30,698) |
Number of families with income $100k - 125k:| South Shore: | 7.7% (12) |
| State: | 11.4% (24,331) |
Number of families with income $125k - 150k:| South Shore: | 5.9% (9) |
| Washington: | 7.5% (16,099) |
Number of families with income $150k - 200k:| South Shore: | 3.5% (6) |
| State: | 8.2% (17,551) |
Number of families with income > $200k:| South Shore: | 5.4% (9) |
| Washington: | 9.7% (20,653) |
Median non-family income in South Shore in 2022:| South Shore: | $21,743 |
| State: | $54,173 |
Change in median non-family income between 2000 and 2022:| South Shore, Washington: | +93.3% |
| Washington: | +105.8% |
Median per capita income in South Shore in 2022:| South Shore: | $13,316 |
| State: | $28,252 |
Change in median per capita income between 2000 and 2022:| South Shore, Washington: | +92.9% |
| State: | +150.2% |
Income statistics for American Indian and Alaska Native residents
Median household income in South Shore, WA in 2022:| South Shore: | $92,643 |
| State: | $71,255 |
Change in median household income between 2000 and 2022:| South Shore, Washington: | +75.4% |
| State: | +118.1% |
Number of households with income < $10k:| South Shore: | 5.9% (1,435) |
| State: | 5.9% (1,768) |
Number of households with income $10k - 20k:| South Shore: | 9.0% (2,191) |
| State: | 8.9% (2,694) |
Number of households with income $20k - 30k:| South Shore: | 8.0% (1,938) |
| State: | 8.0% (2,412) |
Number of households with income $30k - 40k:| South Shore: | 7.7% (1,877) |
| State: | 7.7% (2,327) |
Number of households with income $40k - 50k:| South Shore: | 5.9% (1,435) |
| Washington: | 5.8% (1,755) |
Number of households with income $50k - 60k:| South Shore: | 7.5% (1,825) |
| Washington: | 7.5% (2,259) |
Number of households with income $60k - 75k:| South Shore: | 8.8% (2,153) |
| State: | 8.8% (2,669) |
Number of households with income $75k - 100k:| South Shore: | 12.7% (3,103) |
| Washington: | 12.8% (3,861) |
Number of households with income $100k - 125k:| South Shore: | 12.0% (2,929) |
| State: | 12.0% (3,618) |
Number of households with income $125k - 150k:| South Shore: | 8.6% (2,092) |
| State: | 8.6% (2,580) |
Number of households with income $150k - 200k:| South Shore: | 5.9% (1,430) |
| State: | 5.9% (1,774) |
Number of households with income > $200k:| South Shore: | 8.0% (1,958) |
| State: | 8.1% (2,447) |
Aggregate household income in South Shore in 2022: $2,558,837
Median family income in South Shore in 2022:| South Shore: | $64,872 |
| Washington: | $79,010 |
Number of families with income $10k - 20k:| South Shore: | 4.9% (1) |
| State: | 5.2% (1,056) |
Number of families with income $30k - 40k:| South Shore: | 7.9% (2) |
| State: | 5.9% (1,190) |
Number of families with income $40k - 50k:| South Shore: | 12.4% (2) |
| State: | 4.6% (927) |
Number of families with income $50k - 60k:| South Shore: | 23.8% (5) |
| State: | 9.7% (1,973) |
Number of families with income $75k - 100k:| South Shore: | 50.9% (10) |
| Washington: | 13.1% (2,669) |
Median per capita income in South Shore in 2022:| South Shore: | $43,746 |
| Washington: | $27,053 |
Income statistics for Multirace residents
Median household income in South Shore, WA in 2022:| South Shore: | $38,261 |
| Washington: | $84,303 |
Change in median household income between 2000 and 2022:| South Shore, Washington: | +75.9% |
| State: | +125.7% |
Number of households with income < $10k:| South Shore: | 4.3% (3,506) |
| State: | 4.3% (12,040) |
Number of households with income $10k - 20k:| South Shore: | 6.6% (5,369) |
| Washington: | 6.6% (18,437) |
Number of households with income $20k - 30k:| South Shore: | 5.2% (4,237) |
| State: | 5.2% (14,559) |
Number of households with income $30k - 40k:| South Shore: | 6.7% (5,384) |
| Washington: | 6.7% (18,491) |
Number of households with income $40k - 50k:| South Shore: | 6.3% (5,085) |
| Washington: | 6.3% (17,459) |
Number of households with income $50k - 60k:| South Shore: | 6.9% (5,555) |
| Washington: | 6.9% (19,086) |
Number of households with income $60k - 75k:| South Shore: | 9.1% (7,370) |
| State: | 9.1% (25,310) |
Number of households with income $75k - 100k:| South Shore: | 13.5% (10,915) |
| State: | 13.5% (37,493) |
Number of households with income $100k - 125k:| South Shore: | 10.7% (8,623) |
| State: | 10.7% (29,626) |
Number of households with income $125k - 150k:| South Shore: | 8.6% (6,958) |
| Washington: | 8.6% (23,899) |
Number of households with income $150k - 200k:| South Shore: | 10.2% (8,218) |
| State: | 10.2% (28,214) |
Number of households with income > $200k:| South Shore: | 11.9% (9,591) |
| State: | 11.9% (32,947) |
Aggregate household income in South Shore in 2022: $9,111,537
Median family income in South Shore in 2022:| South Shore: | $49,694 |
| State: | $95,629 |
Number of families with income $10k - 20k:| South Shore: | 27.8% (22) |
| State: | 4.3% (7,519) |
Number of families with income $20k - 30k:| South Shore: | 5.6% (4) |
| Washington: | 4.4% (7,775) |
Number of families with income $30k - 40k:| South Shore: | 31.0% (24) |
| State: | 5.8% (10,186) |
Number of families with income $60k - 75k:| South Shore: | 35.5% (28) |
| Washington: | 9.7% (17,113) |
Median per capita income in South Shore in 2022:| South Shore: | $27,961 |
| Washington: | $32,496 |
Change in median per capita income between 2000 and 2022:| South Shore, Washington: | +127.6% |
| Washington: | +156.8% |
Income statistics for other residents
Number of households with income < $10k:| South Shore: | 3.7% (1) |
| State: | 5.3% (6,540) |
Number of households with income $10k - 20k:| South Shore: | 7.4% (2) |
| State: | 6.0% (7,385) |
Number of households with income $20k - 30k:| South Shore: | 11.1% (3) |
| Washington: | 7.5% (9,289) |
Number of households with income $30k - 40k:| South Shore: | 11.1% (3) |
| Washington: | 8.9% (11,015) |
Number of households with income $40k - 50k:| South Shore: | 7.4% (2) |
| State: | 7.6% (9,399) |
Number of households with income $50k - 60k:| South Shore: | 7.4% (2) |
| State: | 7.2% (8,867) |
Number of households with income $60k - 75k:| South Shore: | 11.1% (3) |
| Washington: | 10.5% (13,032) |
Number of households with income $75k - 100k:| South Shore: | 11.1% (3) |
| State: | 14.6% (18,007) |
Number of households with income $100k - 125k:| South Shore: | 11.1% (3) |
| Washington: | 12.2% (15,128) |
Number of households with income $125k - 150k:| South Shore: | 3.7% (1) |
| Washington: | 5.6% (6,950) |
Number of households with income $150k - 200k:| South Shore: | 7.4% (2) |
| State: | 7.1% (8,749) |
Number of households with income > $200k:| South Shore: | 7.4% (2) |
| State: | 7.5% (9,208) |
Aggregate household income in South Shore in 2022: $2,461,790
Median family income in South Shore in 2022:| South Shore: | $37,838 |
| State: | $72,588 |
Median per capita income in South Shore in 2022:| South Shore: | $29,684 |
| State: | $27,542 |
Change in median per capita income between 2000 and 2022:| South Shore, Washington: | +74.3% |
| State: | +167.8% |