Southeast, New York (NY) income map, earnings map, and wages data
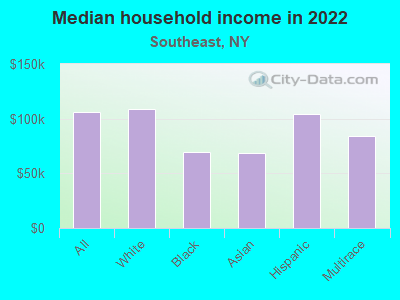
The median household income in Southeast, NY in 2022 was $106,479, which was 25.3% greater than the median annual income of $79,557 across the entire state of New York. Compared to the median income of $69,272 in 2000 this represents an increase of 34.9%. The per capita income in 2022 was $53,000, which means an increase of 44.3% compared to 2000 when it was $29,506.
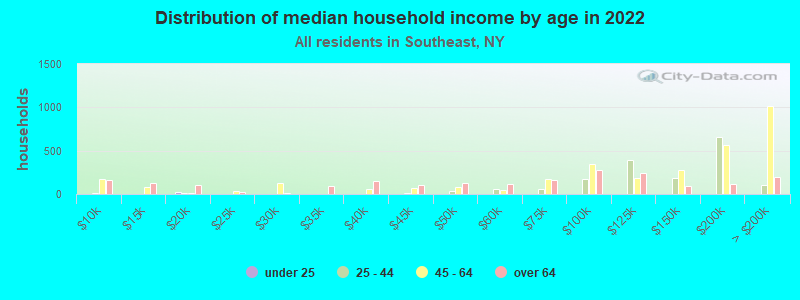
Income statistics for all residents
Median household income in Southeast, NY in 2022:| Southeast: | $106,480 |
| New York: | $79,557 |
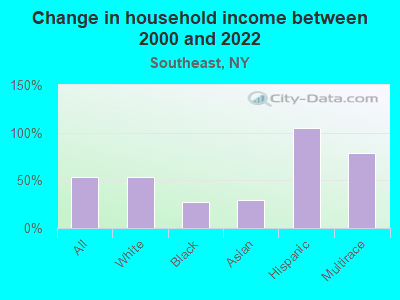
Change in median household income between 2000 and 2022:| Southeast, New York: | +53.7% |
| State: | +83.3% |
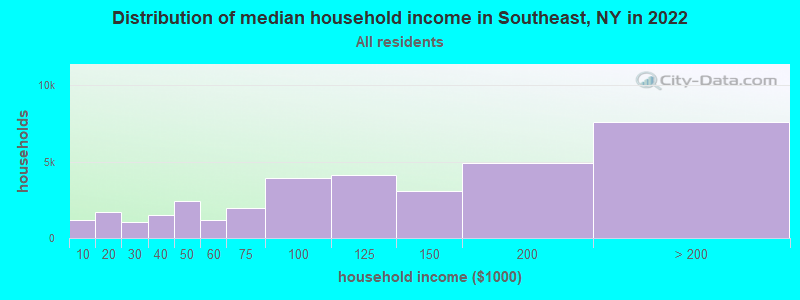
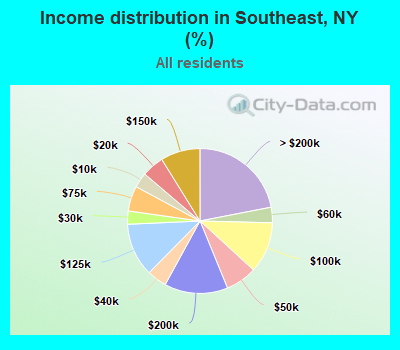
Number of households with income < $10k:| Southeast: | 3.4% (1,168) |
| State: | 6.8% (527,598) |
Number of households with income $10k - 20k:| Southeast: | 5.0% (1,714) |
| State: | 7.4% (574,940) |
Number of households with income $20k - 30k:| Southeast: | 2.9% (1,020) |
| New York: | 6.7% (517,718) |
Number of households with income $30k - 40k:| Southeast: | 4.4% (1,523) |
| New York: | 6.5% (506,674) |
Number of households with income $40k - 50k:| Southeast: | 7.0% (2,418) |
| State: | 6.1% (470,439) |
Number of households with income $50k - 60k:| Southeast: | 3.5% (1,195) |
| New York: | 5.8% (454,042) |
Number of households with income $60k - 75k:| Southeast: | 5.6% (1,946) |
| State: | 8.5% (657,508) |
Number of households with income $75k - 100k:| Southeast: | 11.4% (3,947) |
| New York: | 11.6% (899,824) |
Number of households with income $100k - 125k:| Southeast: | 11.9% (4,118) |
| New York: | 9.3% (723,825) |
Number of households with income $125k - 150k:| Southeast: | 8.8% (3,051) |
| New York: | 7.1% (552,420) |
Number of households with income $150k - 200k:| Southeast: | 14.2% (4,905) |
| State: | 9.4% (727,051) |
Number of households with income > $200k:| Southeast: | 22.0% (7,598) |
| New York: | 15.0% (1,162,269) |
Aggregate household income in Southeast in 2022: $1,221,347,521
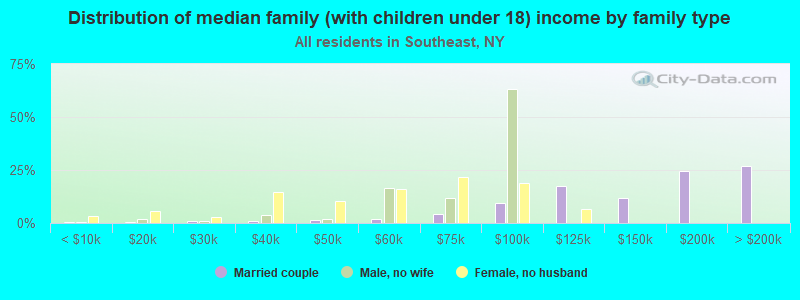
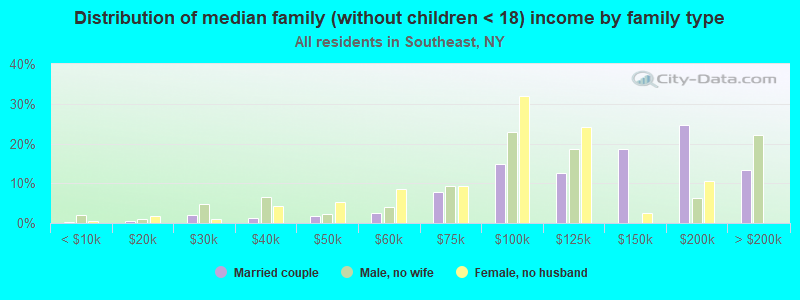
Median family income in Southeast in 2022:| Southeast: | $129,998 |
| New York: | $99,066 |
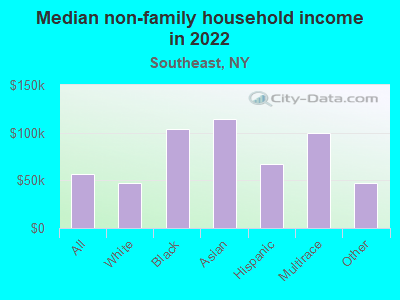
Median non-family income in Southeast in 2022:| Southeast: | $56,550 |
| State: | $50,181 |
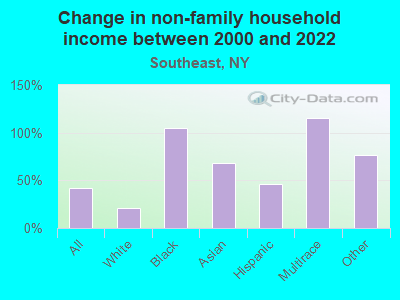
Change in median non-family income between 2000 and 2022:| Southeast, New York: | +41.6% |
| New York: | +85.4% |
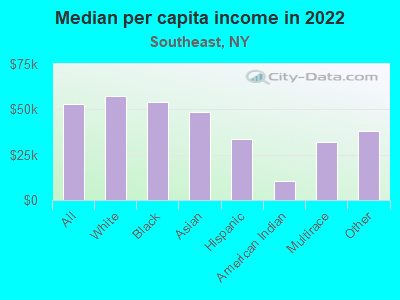
Median per capita income in Southeast in 2022:| Southeast: | $53,001 |
| State: | $47,421 |
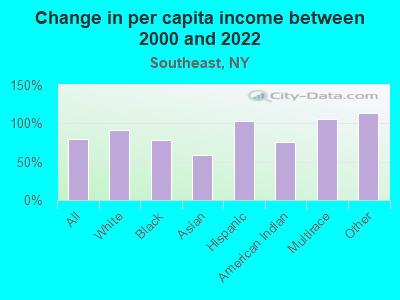
Change in median per capita income between 2000 and 2022:| Southeast, New York: | +79.6% |
| State: | +102.7% |
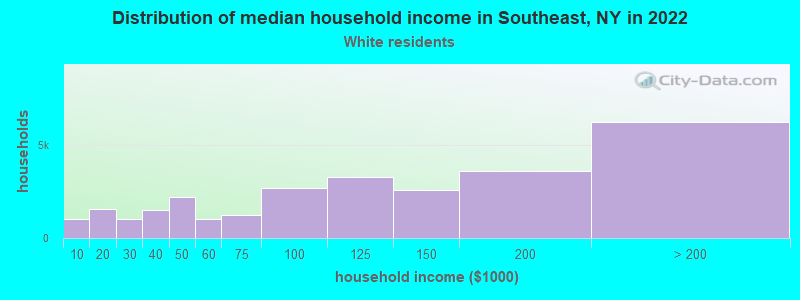
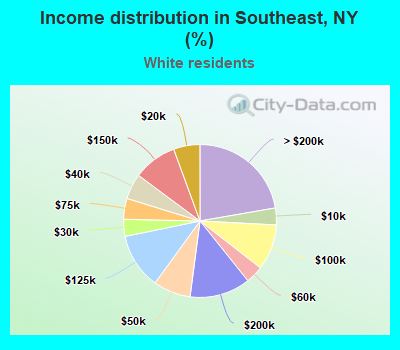
Income statistics for White residents
Median household income in Southeast, NY in 2022:| Southeast: | $108,691 |
| New York: | $89,408 |
Change in median household income between 2000 and 2022:| Southeast, New York: | +54.0% |
| New York: | +85.5% |
Number of households with income < $10k:| Southeast: | 3.6% (996) |
| New York: | 4.8% (225,550) |
Number of households with income $10k - 20k:| Southeast: | 5.6% (1,558) |
| State: | 6.1% (289,425) |
Number of households with income $20k - 30k:| Southeast: | 3.6% (1,005) |
| State: | 5.9% (280,254) |
Number of households with income $30k - 40k:| Southeast: | 5.4% (1,506) |
| State: | 6.1% (288,263) |
Number of households with income $40k - 50k:| Southeast: | 7.9% (2,207) |
| New York: | 5.9% (278,079) |
Number of households with income $50k - 60k:| Southeast: | 3.7% (1,043) |
| New York: | 5.7% (267,554) |
Number of households with income $60k - 75k:| Southeast: | 4.4% (1,229) |
| State: | 8.4% (398,344) |
Number of households with income $75k - 100k:| Southeast: | 9.7% (2,699) |
| New York: | 11.8% (554,841) |
Number of households with income $100k - 125k:| Southeast: | 11.8% (3,285) |
| New York: | 10.0% (469,794) |
Number of households with income $125k - 150k:| Southeast: | 9.2% (2,578) |
| State: | 7.6% (360,467) |
Number of households with income $150k - 200k:| Southeast: | 12.8% (3,577) |
| State: | 10.1% (477,078) |
Number of households with income > $200k:| Southeast: | 22.3% (6,216) |
| New York: | 17.6% (829,233) |
Aggregate household income in Southeast in 2022: $932,212,967
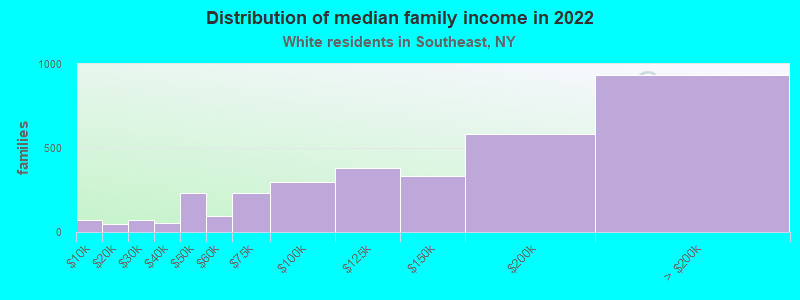
Median family income in Southeast in 2022:| Southeast: | $134,326 |
| State: | $115,170 |
Number of families with income < $10k:| Southeast: | 2.2% (72) |
| New York: | 2.5% (68,851) |
Number of families with income $10k - 20k:| Southeast: | 1.4% (47) |
| State: | 3.0% (83,127) |
Number of families with income $20k - 30k:| Southeast: | 2.1% (71) |
| State: | 3.5% (97,578) |
Number of families with income $30k - 40k:| Southeast: | 1.6% (54) |
| New York: | 4.1% (114,108) |
Number of families with income $40k - 50k:| Southeast: | 6.9% (230) |
| State: | 4.7% (130,902) |
Number of families with income $50k - 60k:| Southeast: | 2.9% (96) |
| New York: | 4.9% (135,118) |
Number of families with income $60k - 75k:| Southeast: | 7.0% (232) |
| State: | 7.8% (216,254) |
Number of families with income $75k - 100k:| Southeast: | 8.9% (296) |
| New York: | 12.4% (342,382) |
Number of families with income $100k - 125k:| Southeast: | 11.4% (381) |
| New York: | 11.4% (314,917) |
Number of families with income $125k - 150k:| Southeast: | 10.0% (332) |
| State: | 9.4% (260,489) |
Number of families with income $150k - 200k:| Southeast: | 17.5% (582) |
| New York: | 13.2% (365,586) |
Number of families with income > $200k:| Southeast: | 28.1% (937) |
| State: | 23.2% (642,319) |
Median non-family income in Southeast in 2022:| Southeast: | $47,422 |
| New York: | $54,783 |
Change in median non-family income between 2000 and 2022:| Southeast, New York: | +20.6% |
| State: | +87.9% |
Median per capita income in Southeast in 2022:| Southeast: | $57,398 |
| State: | $57,640 |
Change in median per capita income between 2000 and 2022:| Southeast, New York: | +91.2% |
| State: | +111.6% |
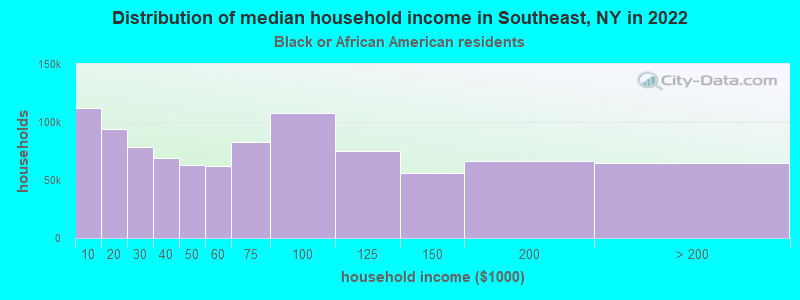
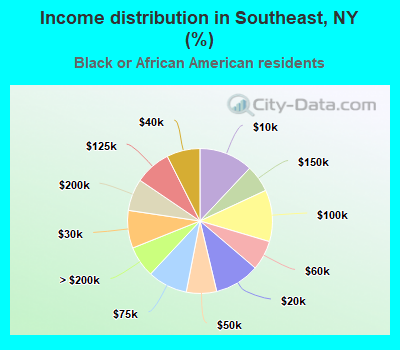
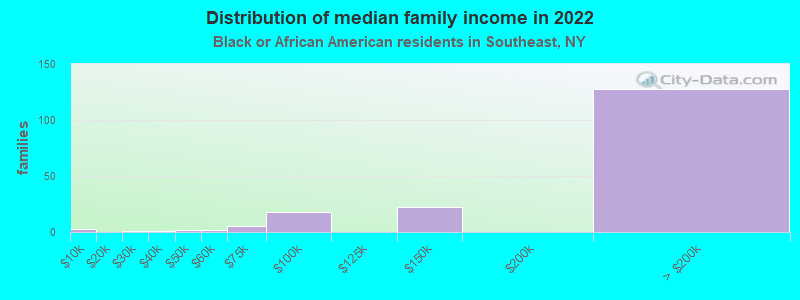
Income statistics for Black or African American residents
Median household income in Southeast, NY in 2022:| Southeast: | $69,511 |
| New York: | $57,898 |
Change in median household income between 2000 and 2022:| Southeast, New York: | +27.4% |
| State: | +84.6% |
Number of households with income < $10k:| Southeast: | 12.0% (111,903) |
| State: | 12.0% (128,500) |
Number of households with income $10k - 20k:| Southeast: | 10.0% (93,558) |
| New York: | 10.0% (107,541) |
Number of households with income $20k - 30k:| Southeast: | 8.4% (78,521) |
| State: | 8.4% (90,192) |
Number of households with income $30k - 40k:| Southeast: | 7.4% (69,204) |
| State: | 7.4% (79,579) |
Number of households with income $40k - 50k:| Southeast: | 6.8% (63,101) |
| State: | 6.8% (72,491) |
Number of households with income $50k - 60k:| Southeast: | 6.6% (61,887) |
| State: | 6.7% (71,309) |
Number of households with income $60k - 75k:| Southeast: | 8.9% (82,738) |
| State: | 8.9% (95,050) |
Number of households with income $75k - 100k:| Southeast: | 11.5% (107,351) |
| State: | 11.5% (123,569) |
Number of households with income $100k - 125k:| Southeast: | 8.1% (75,152) |
| State: | 8.1% (86,632) |
Number of households with income $125k - 150k:| Southeast: | 6.1% (56,383) |
| State: | 6.0% (64,788) |
Number of households with income $150k - 200k:| Southeast: | 7.1% (66,530) |
| New York: | 7.2% (76,644) |
Number of households with income > $200k:| Southeast: | 7.0% (64,970) |
| New York: | 7.0% (75,062) |
Aggregate household income in Southeast in 2022: $32,584,405
Median family income in Southeast in 2022:| Southeast: | $188,912 |
| New York: | $72,528 |
Number of families with income < $10k:| Southeast: | 1.6% (3) |
| New York: | 8.6% (54,100) |
Number of families with income $20k - 30k:| Southeast: | 0.5% (1) |
| New York: | 7.0% (44,139) |
Number of families with income $30k - 40k:| Southeast: | 0.4% (1) |
| State: | 6.9% (43,353) |
Number of families with income $40k - 50k:| Southeast: | 1.1% (2) |
| State: | 6.6% (41,419) |
Number of families with income $50k - 60k:| Southeast: | 1.2% (2) |
| State: | 6.3% (39,748) |
Number of families with income $60k - 75k:| Southeast: | 2.8% (5) |
| State: | 9.2% (57,626) |
Number of families with income $75k - 100k:| Southeast: | 9.9% (18) |
| New York: | 12.6% (78,986) |
Number of families with income $125k - 150k:| Southeast: | 12.0% (22) |
| State: | 7.5% (47,050) |
Number of families with income > $200k:| Southeast: | 70.5% (128) |
| New York: | 9.3% (58,575) |
Median non-family income in Southeast in 2022:| Southeast: | $104,022 |
| New York: | $37,265 |
Change in median non-family income between 2000 and 2022:| Southeast, New York: | +104.6% |
| New York: | +81.7% |
Median per capita income in Southeast in 2022:| Southeast: | $54,176 |
| State: | $31,947 |
Change in median per capita income between 2000 and 2022:| Southeast, New York: | +77.6% |
| State: | +106.1% |
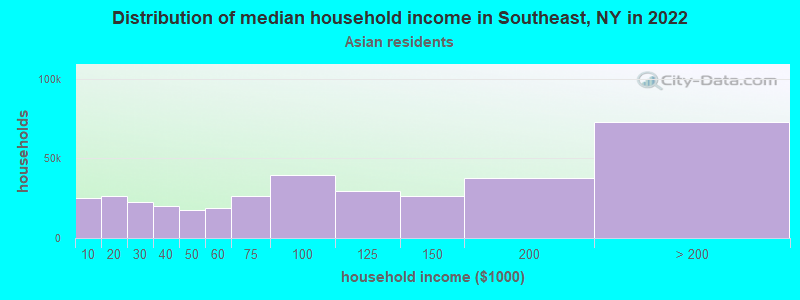
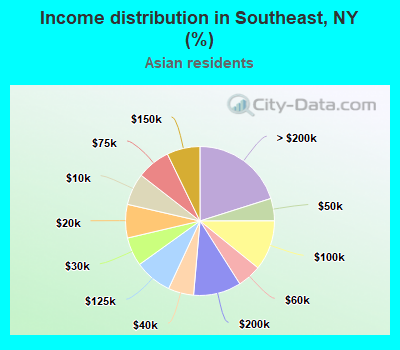
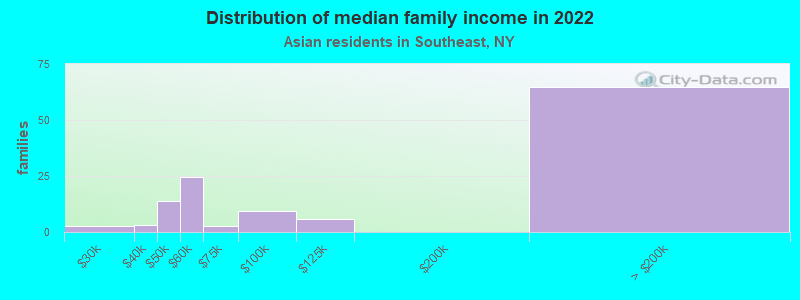
Income statistics for Asian residents
Median household income in Southeast, NY in 2022:| Southeast: | $68,903 |
| State: | $89,947 |
Change in median household income between 2000 and 2022:| Southeast, New York: | +28.6% |
| State: | +98.1% |
Number of households with income < $10k:| Southeast: | 6.9% (25,103) |
| State: | 6.9% (42,537) |
Number of households with income $10k - 20k:| Southeast: | 7.3% (26,413) |
| State: | 7.3% (44,745) |
Number of households with income $20k - 30k:| Southeast: | 6.2% (22,616) |
| New York: | 6.2% (38,249) |
Number of households with income $30k - 40k:| Southeast: | 5.5% (20,062) |
| New York: | 5.5% (33,993) |
Number of households with income $40k - 50k:| Southeast: | 4.9% (17,609) |
| State: | 4.8% (29,795) |
Number of households with income $50k - 60k:| Southeast: | 5.2% (18,834) |
| New York: | 5.2% (32,100) |
Number of households with income $60k - 75k:| Southeast: | 7.3% (26,316) |
| State: | 7.3% (44,615) |
Number of households with income $75k - 100k:| Southeast: | 10.9% (39,349) |
| State: | 10.8% (66,687) |
Number of households with income $100k - 125k:| Southeast: | 8.2% (29,564) |
| State: | 8.2% (50,233) |
Number of households with income $125k - 150k:| Southeast: | 7.2% (26,123) |
| State: | 7.2% (44,299) |
Number of households with income $150k - 200k:| Southeast: | 10.4% (37,584) |
| State: | 10.4% (63,837) |
Number of households with income > $200k:| Southeast: | 20.1% (72,937) |
| State: | 20.1% (123,891) |
Aggregate household income in Southeast in 2022: $19,354,192
Median family income in Southeast in 2022:| Southeast: | $85,455 |
| State: | $98,136 |
Number of families with income $20k - 30k:| Southeast: | 2.0% (3) |
| State: | 6.4% (27,990) |
Number of families with income $30k - 40k:| Southeast: | 2.5% (3) |
| State: | 6.2% (26,994) |
Number of families with income $40k - 50k:| Southeast: | 10.9% (14) |
| State: | 5.2% (22,750) |
Number of families with income $50k - 60k:| Southeast: | 19.3% (25) |
| New York: | 5.5% (24,015) |
Number of families with income $60k - 75k:| Southeast: | 2.2% (3) |
| State: | 7.6% (33,120) |
Number of families with income $75k - 100k:| Southeast: | 7.5% (10) |
| State: | 10.7% (46,726) |
Number of families with income $100k - 125k:| Southeast: | 4.6% (6) |
| State: | 8.6% (37,796) |
Number of families with income > $200k:| Southeast: | 50.9% (65) |
| New York: | 22.2% (97,322) |
Median non-family income in Southeast in 2022:| Southeast: | $114,081 |
| State: | $63,573 |
Change in median non-family income between 2000 and 2022:| Southeast, New York: | +68.3% |
| State: | +101.1% |
Median per capita income in Southeast in 2022:| Southeast: | $48,595 |
| New York: | $46,726 |
Change in median per capita income between 2000 and 2022:| Southeast, New York: | +59.0% |
| New York: | +126.6% |
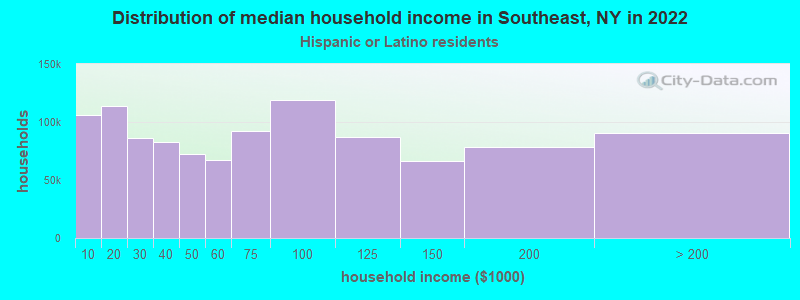
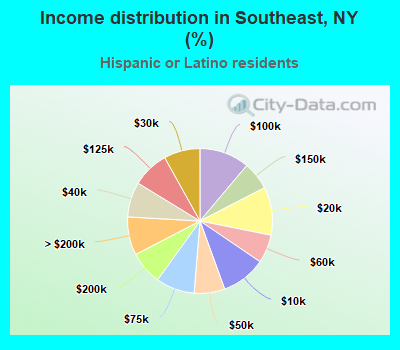
Income statistics for Hispanic or Latino residents
Median household income in Southeast, NY in 2022:| Southeast: | $104,352 |
| New York: | $60,468 |
Change in median household income between 2000 and 2022:| Southeast, New York: | +105.3% |
| State: | +98.3% |
Number of households with income < $10k:| Southeast: | 10.0% (105,921) |
| New York: | 9.9% (127,185) |
Number of households with income $10k - 20k:| Southeast: | 10.7% (114,020) |
| New York: | 10.7% (136,699) |
Number of households with income $20k - 30k:| Southeast: | 8.1% (85,858) |
| State: | 8.1% (102,991) |
Number of households with income $30k - 40k:| Southeast: | 7.8% (83,163) |
| State: | 7.8% (100,149) |
Number of households with income $40k - 50k:| Southeast: | 6.8% (72,761) |
| New York: | 6.9% (87,760) |
Number of households with income $50k - 60k:| Southeast: | 6.3% (67,378) |
| New York: | 6.3% (80,968) |
Number of households with income $60k - 75k:| Southeast: | 8.6% (91,836) |
| State: | 8.7% (110,631) |
Number of households with income $75k - 100k:| Southeast: | 11.2% (118,542) |
| State: | 11.2% (142,787) |
Number of households with income $100k - 125k:| Southeast: | 8.2% (86,865) |
| New York: | 8.2% (104,850) |
Number of households with income $125k - 150k:| Southeast: | 6.3% (66,648) |
| State: | 6.3% (80,274) |
Number of households with income $150k - 200k:| Southeast: | 7.4% (78,789) |
| State: | 7.4% (95,117) |
Number of households with income > $200k:| Southeast: | 8.6% (90,866) |
| New York: | 8.6% (109,514) |
Aggregate household income in Southeast in 2022: $158,950,992
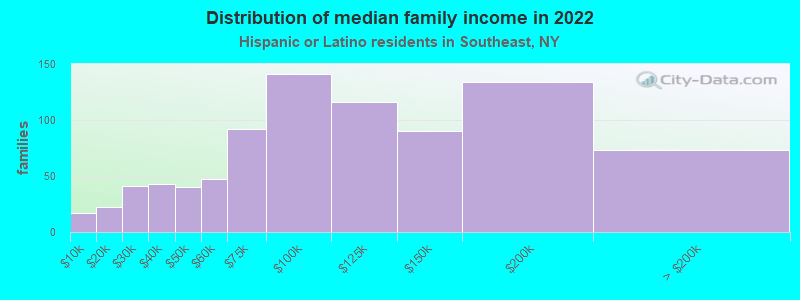
Median family income in Southeast in 2022:| Southeast: | $101,159 |
| State: | $68,770 |
Number of families with income < $10k:| Southeast: | 2.0% (17) |
| State: | 6.9% (58,565) |
Number of families with income $10k - 20k:| Southeast: | 2.5% (22) |
| State: | 7.0% (59,058) |
Number of families with income $20k - 30k:| Southeast: | 4.8% (41) |
| New York: | 8.0% (68,048) |
Number of families with income $30k - 40k:| Southeast: | 5.0% (43) |
| State: | 8.4% (70,668) |
Number of families with income $40k - 50k:| Southeast: | 4.7% (40) |
| State: | 7.4% (62,941) |
Number of families with income $50k - 60k:| Southeast: | 5.5% (47) |
| State: | 6.6% (55,592) |
Number of families with income $60k - 75k:| Southeast: | 10.7% (92) |
| State: | 9.3% (78,564) |
Number of families with income $75k - 100k:| Southeast: | 16.5% (141) |
| State: | 12.6% (106,685) |
Number of families with income $100k - 125k:| Southeast: | 13.6% (116) |
| State: | 9.4% (79,139) |
Number of families with income $125k - 150k:| Southeast: | 10.5% (90) |
| State: | 6.9% (58,255) |
Number of families with income $150k - 200k:| Southeast: | 15.7% (134) |
| New York: | 8.3% (69,877) |
Number of families with income > $200k:| Southeast: | 8.6% (73) |
| State: | 9.3% (78,555) |
Median non-family income in Southeast in 2022:| Southeast: | $67,009 |
| State: | $34,000 |
Change in median non-family income between 2000 and 2022:| Southeast, New York: | +46.0% |
| New York: | +93.9% |
Median per capita income in Southeast in 2022:| Southeast: | $33,551 |
| New York: | $29,761 |
Change in median per capita income between 2000 and 2022:| Southeast, New York: | +103.5% |
| State: | +132.7% |
Income statistics for American Indian and Alaska Native residents
Aggregate household income in Southeast in 2022: $716,317
Median per capita income in Southeast in 2022:| Southeast: | $10,529 |
| State: | $25,837 |
Change in median per capita income between 2000 and 2022:| Southeast, New York: | +75.0% |
| State: | +99.6% |
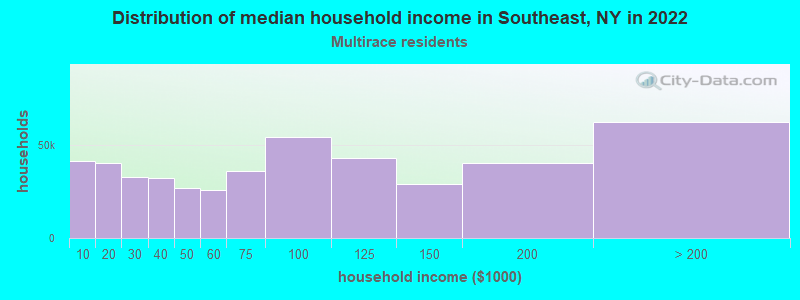
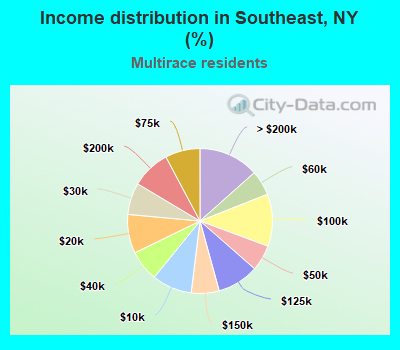
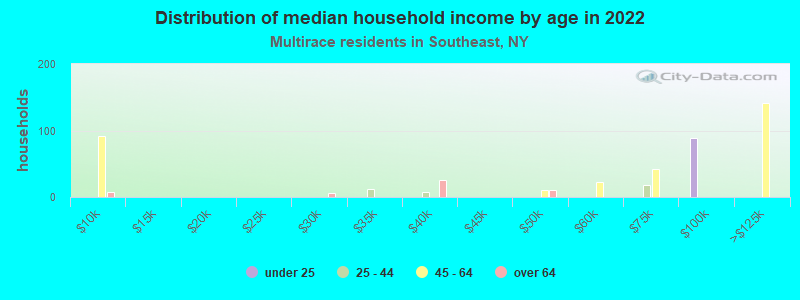
Income statistics for Multirace residents
Median household income in Southeast, NY in 2022:| Southeast: | $84,452 |
| State: | $73,557 |
Change in median household income between 2000 and 2022:| Southeast, New York: | +79.4% |
| State: | +123.9% |
Number of households with income < $10k:| Southeast: | 8.9% (41,560) |
| State: | 8.9% (57,924) |
Number of households with income $10k - 20k:| Southeast: | 8.7% (40,531) |
| State: | 8.7% (56,590) |
Number of households with income $20k - 30k:| Southeast: | 7.1% (33,130) |
| State: | 7.1% (46,287) |
Number of households with income $30k - 40k:| Southeast: | 6.9% (32,271) |
| New York: | 6.9% (45,132) |
Number of households with income $40k - 50k:| Southeast: | 5.8% (27,080) |
| New York: | 5.8% (37,946) |
Number of households with income $50k - 60k:| Southeast: | 5.6% (26,018) |
| State: | 5.6% (36,410) |
Number of households with income $60k - 75k:| Southeast: | 7.8% (36,293) |
| New York: | 7.8% (50,819) |
Number of households with income $75k - 100k:| Southeast: | 11.7% (54,385) |
| New York: | 11.7% (76,024) |
Number of households with income $100k - 125k:| Southeast: | 9.3% (43,277) |
| New York: | 9.3% (60,635) |
Number of households with income $125k - 150k:| Southeast: | 6.2% (28,998) |
| New York: | 6.2% (40,533) |
Number of households with income $150k - 200k:| Southeast: | 8.6% (40,338) |
| State: | 8.6% (56,409) |
Number of households with income > $200k:| Southeast: | 13.4% (62,624) |
| New York: | 13.4% (87,442) |
Aggregate household income in Southeast in 2022: $65,345,677
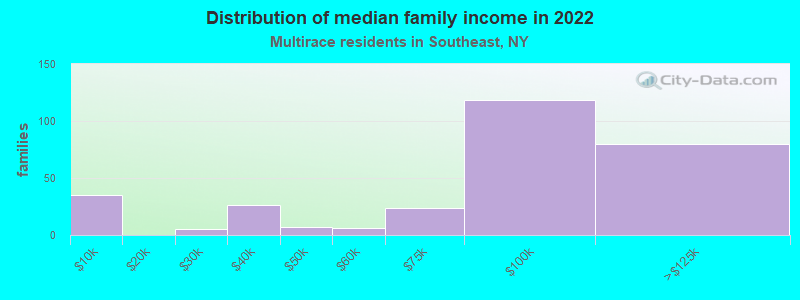
Median family income in Southeast in 2022:| Southeast: | $122,496 |
| State: | $85,788 |
Number of families with income < $10k:| Southeast: | 11.6% (35) |
| New York: | 6.2% (24,976) |
Number of families with income $20k - 30k:| Southeast: | 1.6% (5) |
| New York: | 6.6% (26,534) |
Number of families with income $30k - 40k:| Southeast: | 8.6% (26) |
| State: | 6.5% (26,239) |
Number of families with income $40k - 50k:| Southeast: | 2.3% (7) |
| State: | 6.1% (24,694) |
Number of families with income $50k - 60k:| Southeast: | 2.2% (6) |
| State: | 5.5% (22,002) |
Number of families with income $60k - 75k:| Southeast: | 8.0% (24) |
| State: | 7.6% (30,653) |
Number of families with income $75k - 100k:| Southeast: | 39.2% (118) |
| State: | 12.9% (51,995) |
Number of families with income $100k - 125k:| Southeast: | 26.6% (80) |
| State: | 10.7% (43,036) |
Median non-family income in Southeast in 2022:| Southeast: | $99,229 |
| State: | $46,403 |
Change in median non-family income between 2000 and 2022:| Southeast, New York: | +114.5% |
| New York: | +113.6% |
Median per capita income in Southeast in 2022:| Southeast: | $31,880 |
| New York: | $36,931 |
Change in median per capita income between 2000 and 2022:| Southeast, New York: | +105.5% |
| State: | +158.8% |
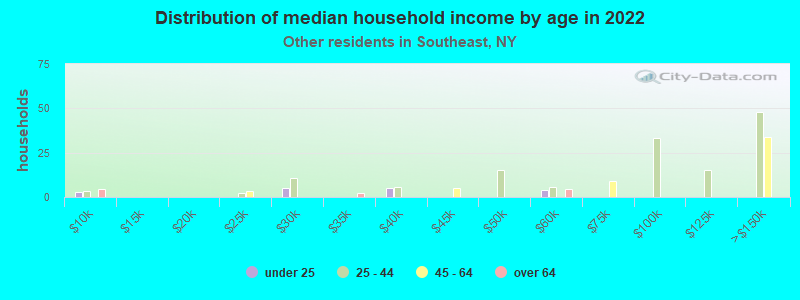
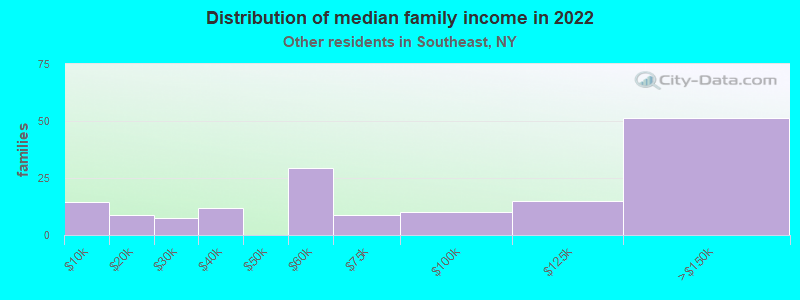
Income statistics for other residents
Number of households with income < $10k:| Southeast: | 10.5% (83) |
| New York: | 10.3% (69,252) |
Number of households with income $10k - 20k:| Southeast: | 10.4% (82) |
| State: | 11.0% (73,890) |
Number of households with income $20k - 30k:| Southeast: | 7.7% (61) |
| New York: | 8.8% (59,096) |
Number of households with income $30k - 40k:| Southeast: | 7.3% (58) |
| New York: | 8.1% (54,418) |
Number of households with income $40k - 50k:| Southeast: | 7.3% (58) |
| New York: | 7.3% (49,042) |
Number of households with income $50k - 60k:| Southeast: | 5.6% (44) |
| State: | 6.5% (43,945) |
Number of households with income $60k - 75k:| Southeast: | 9.2% (73) |
| New York: | 9.5% (64,087) |
Number of households with income $75k - 100k:| Southeast: | 11.4% (90) |
| State: | 10.9% (73,094) |
Number of households with income $100k - 125k:| Southeast: | 9.0% (71) |
| State: | 7.9% (53,055) |
Number of households with income $125k - 150k:| Southeast: | 5.3% (42) |
| New York: | 5.9% (39,446) |
Number of households with income $150k - 200k:| Southeast: | 9.1% (72) |
| New York: | 7.2% (48,653) |
Number of households with income > $200k:| Southeast: | 7.3% (58) |
| State: | 6.6% (44,703) |
Aggregate household income in Southeast in 2022: $50,739,235
Median family income in Southeast in 2022:| Southeast: | $57,657 |
| State: | $63,465 |
Number of families with income < $10k:| Southeast: | 9.1% (14) |
| New York: | 6.2% (29,008) |
Number of families with income $10k - 20k:| Southeast: | 5.6% (9) |
| New York: | 7.4% (34,598) |
Number of families with income $20k - 30k:| Southeast: | 4.7% (7) |
| State: | 9.2% (43,198) |
Number of families with income $30k - 40k:| Southeast: | 7.7% (12) |
| State: | 9.5% (44,688) |
Number of families with income $50k - 60k:| Southeast: | 18.9% (30) |
| State: | 7.1% (33,324) |
Number of families with income $60k - 75k:| Southeast: | 5.6% (9) |
| State: | 10.1% (47,546) |
Number of families with income $75k - 100k:| Southeast: | 6.3% (10) |
| State: | 12.5% (58,659) |
Number of families with income $100k - 125k:| Southeast: | 9.4% (15) |
| State: | 8.6% (40,211) |
Number of families with income $125k - 150k:| Southeast: | 32.7% (51) |
| New York: | 6.5% (30,363) |
Median non-family income in Southeast in 2022:| Southeast: | $47,644 |
| State: | $26,983 |
Change in median non-family income between 2000 and 2022:| Southeast, New York: | +77.3% |
| New York: | +66.4% |
Median per capita income in Southeast in 2022:| Southeast: | $38,195 |
| New York: | $26,975 |
Change in median per capita income between 2000 and 2022:| Southeast, New York: | +113.7% |
| State: | +144.6% |