Southeast, New York
Submit your own pictures of this town and show them to the world
- OSM Map
- Google Map
- MSN Map
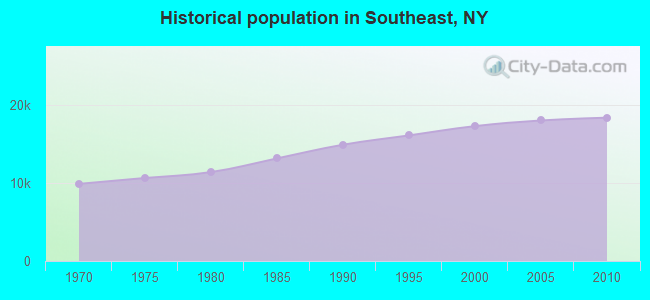
Population change since 2000: +6.3%
 |
| Males: 9,316 | |
| Females: 9,088 |
| Median resident age: | 41.7 years |
| New York median age: | 40.7 years |
Zip codes: 10509.
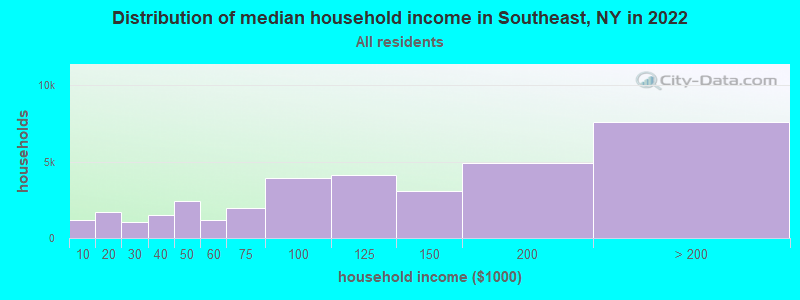
| Southeast: | $106,480 |
| NY: | $79,557 |
Estimated per capita income in 2022: $53,001 (it was $29,506 in 2000)
Southeast town income, earnings, and wages data
Estimated median house or condo value in 2022: $447,120 (it was $210,500 in 2000)
| Southeast: | $447,120 |
| NY: | $400,400 |
Mean prices in 2022: all housing units: $511,003; detached houses: $544,773; townhouses or other attached units: $394,159; in 2-unit structures: $469,697; in 3-to-4-unit structures: $440,923; in 5-or-more-unit structures: $358,923; mobile homes: $103,512
Detailed information about poverty and poor residents in Southeast, NY


Compare current foreclosures near Southeast, NY:
| Photo | Address | Area | Beds / Baths | Price | Details |
|---|---|---|---|---|---|

|
#1
Tonetta Lake Rd
Brewster, NY 10509
|
2,383 sq. feet
|
2 baths 3 beds |
$174,900
|
show details |

|
#2
Abbott Ave
Danbury, CT 06810
|
1,401 sq. feet
|
1 baths 3 beds |
$499,900
|
show details |

|
#3
Chalmers Blvd
Amawalk, NY 10501
|
1,072 sq. feet
|
1 baths 1 beds |
$489,900
|
show details |

|
#4
Meadow Brook Rd
Brookfield, CT 06804
|
2,261 sq. feet
|
2 baths 4 beds |
$520,000
|
show details |

|
#5
Patti Pl
Hopewell Junction, NY 12533
|
1,400 sq. feet
|
2 baths 3 beds |
$518,900
|
show details |

|
#6
N Brewster Rd
Brewster, NY 10509
|
3,424 sq. feet
|
2 baths 5 beds |
$325,000
|
show details |

|
#7
Highland Park Dr
Danbury, CT 06811
|
875 sq. feet
|
2 baths 2 beds |
$460,000
|
show details |

|
#8
Olcott Way # 122
Ridgefield, CT 06877
|
920 sq. feet
|
1 baths 1 beds |
$364,900
|
show details |

|
#9
Huntington Ct
Bethel, CT 06801
|
1,312 sq. feet
|
1 baths 2 beds |
show details | |

|
#10
Dunham Ct
Hopewell Junction, NY 12533
|
3,151 sq. feet
|
2 baths 4 beds |
show details |
| Photo | Address | Area | Beds / Baths | Price | Details |
|---|---|---|---|---|---|

|
#11
Fox Run Ln
Carmel, NY 10512
|
706 sq. feet
|
1 baths 1 beds |
show details | |

|
#12
Oak Crest Dr
Brookfield, CT 06804
|
2,074 sq. feet
|
1 baths 3 beds |
show details | |

|
#13
Miller Hill Rd
Carmel, NY 10512
|
816 sq. feet
|
1 baths 1 beds |
show details | |

|
#14
Friendly Rd
Mahopac, NY 10541
|
1,808 sq. feet
|
1 baths 4 beds |
show details | |

|
#15
Stowe Rd
Peekskill, NY 10566
|
- sq. feet
|
2 baths 4 beds |
show details | |

|
#16
Grape Hollow Rd
Holmes, NY 12531
|
3,972 sq. feet
|
3 baths 6 beds |
show details | |

|
#17
Walnut Dr
Mahopac, NY 10541
|
2,284 sq. feet
|
2 baths 4 beds |
show details | |

|
#18
Hamilton Rd
Hopewell Junction, NY 12533
|
2,468 sq. feet
|
3 baths 4 beds |
show details | |

|
#19
Crompond Rd Apt B6
Peekskill, NY 10566
|
900 sq. feet
|
1 baths 2 beds |
show details | |

|
#20
Wooster St
Bethel, CT 06801
|
2,573 sq. feet
|
3 baths 5 beds |
show details |
| Photo | Address | Area | Beds / Baths | Price | Details |
|---|---|---|---|---|---|

|
#21
Purse Ln # 12533
Hopewell Junction, NY 12533
|
910 sq. feet
|
1 baths 2 beds |
show details | |

|
#22
Echo Rd
Carmel, NY 10512
|
1,368 sq. feet
|
1 baths 3 beds |
show details | |

|
#23
Deer Run Rd
Wilton, CT 06897
|
2,117 sq. feet
|
2 baths 3 beds |
show details | |

|
#24
Robins Ln
Brookfield, CT 06804
|
925 sq. feet
|
1 baths 3 beds |
show details | |

|
#25
Hosner Mountain Rd
Stormville, NY 12582
|
1,270 sq. feet
|
1 baths 3 beds |
show details | |

|
#26
Saint Johns Rd
Ridgefield, CT 06877
|
3,158 sq. feet
|
3 baths 3 beds |
show details | |

|
#27
Lee Ave
Putnam Valley, NY 10579
|
1,689 sq. feet
|
2 baths 3 beds |
show details | |

|
#28
Prospect Ct
Brookfield, CT 06804
|
1,220 sq. feet
|
2 baths 3 beds |
show details | |

|
#29
Ridge St
Yorktown Heights, NY 10598
|
1,838 sq. feet
|
2 baths 3 beds |
show details | |

|
#30
Oscawana Lake Rd
Putnam Valley, NY 10579
|
2,071 sq. feet
|
2 baths 3 beds |
show details |
| Photo | Address | Area | Beds / Baths | Price | Details |
|---|---|---|---|---|---|

|
#31
Ogden Dr
Yorktown Heights, NY 10598
|
914 sq. feet
|
2 baths 4 beds |
show details | |

|
#32
Sidney Ct
Yorktown Heights, NY 10598
|
3,131 sq. feet
|
2 baths 4 beds |
show details | |

|
#33
Brook Ln
Shrub Oak, NY 10588
|
1,324 sq. feet
|
1 baths 4 beds |
show details | |

|
#34
Muir Ln
New Milford, CT 06776
|
2,608 sq. feet
|
2 baths 4 beds |
show details | |

|
#35
Toni Ct
Yorktown Heights, NY 10598
|
2,115 sq. feet
|
3 baths 4 beds |
show details | |

|
#36
Coach Dr
Brookfield, CT 06804
|
1,332 sq. feet
|
2 baths 3 beds |
show details | |

|
#37
Oakdale Rd
Putnam Valley, NY 10579
|
1,536 sq. feet
|
1 baths 2 beds |
show details | |

|
#38
Halyan Rd
Yorktown Heights, NY 10598
|
1,632 sq. feet
|
2 baths 3 beds |
show details | |

|
#39
Hopkins Ln
Katonah, NY 10536
|
2,812 sq. feet
|
2 baths 4 beds |
show details | |

|
#40
Judith Dr
Stormville, NY 12582
|
3,916 sq. feet
|
2 baths 4 beds |
show details |
| Photo | Address | Area | Beds / Baths | Price | Details |
|---|---|---|---|---|---|

|
#41
Beech Tree Rd
Brookfield, CT 06804
|
1,332 sq. feet
|
2 baths 3 beds |
show details | |

|
#42
Mueller Mountain Rd
Putnam Valley, NY 10579
|
3,160 sq. feet
|
4 baths 4 beds |
show details | |

|
#43
Pine Mountain Rd
Redding, CT 06896
|
1,158 sq. feet
|
2 baths 3 beds |
show details | |

|
#44
Washington Ct
Pawling, NY 12564
|
2,396 sq. feet
|
2 baths 3 beds |
show details | |

|
#45
Todt Hl
Putnam Valley, NY 10579
|
2,997 sq. feet
|
2 baths 4 beds |
show details | |

|
#46
Christian Ln
Brookfield, CT 06804
|
4,228 sq. feet
|
3 baths 4 beds |
show details | |

|
#47
Oscawana Lake Rd
Putnam Valley, NY 10579
|
1,120 sq. feet
|
2 baths 3 beds |
show details | |

|
#48
Old Route 52
Stormville, NY 12582
|
1,120 sq. feet
|
1 baths 3 beds |
show details | |

|
#49
Old Route 55
Pawling, NY 12564
|
1,440 sq. feet
|
1 baths 3 beds |
show details | |

|
Check over 1 million property listings on Foreclosure.com!
|
browse all offers | |||

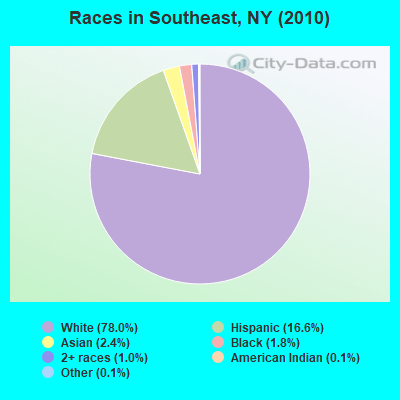
- 14,35478.0%White alone
- 3,05216.6%Hispanic
- 4492.4%Asian alone
- 3271.8%Black alone
- 1781.0%Two or more races
- 230.1%American Indian alone
- 190.1%Other race alone
- 20.01%Native Hawaiian and Other
Pacific Islander alone
Races in Southeast detailed stats: ancestries, foreign born residents, place of birth
 Recent articles from our blog. Our writers, many of them Ph.D. graduates or candidates, create easy-to-read articles on a wide variety of topics.
Ancestries: Italian (31.5%), Irish (28.6%), German (16.1%), English (7.2%), Polish (5.2%), United States (3.3%).
Current Local Time: EST time zone
Land area: 32.1 square miles.
Population density: 574 people per square mile (low).
1,796 residents are foreign born (5.5% Latin America, 3.4% Europe).
| This town: | 10.4% |
| New York: | 20.4% |
| Southeast town: | 2.1% ($4,493) |
| New York: | 1.9% ($2,847) |
Nearest city with pop. 50,000+: Danbury, CT  (7.6 miles , pop. 74,848).
Nearest city with pop. 200,000+: Bronx, NY (40.9 miles , pop. 1,332,650).
Nearest cities:
), )Latitude: 41.40 N, Longitude: 73.61 W
Area code commonly used in this area: 845
Southeast, New York accommodation & food services, waste management - Economy and Business Data
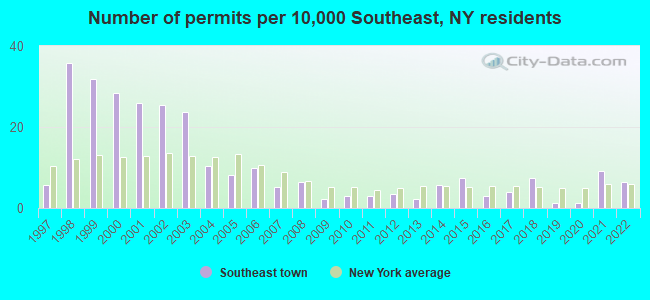
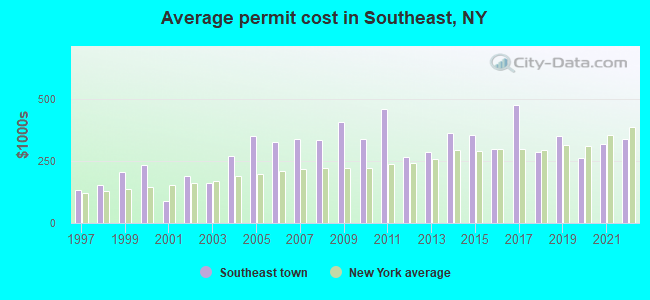
Single-family new house construction building permits:
- 2022: 11 buildings, average cost: $337,800
- 2021: 16 buildings, average cost: $319,300
- 2020: 2 buildings, average cost: $260,000
- 2019: 2 buildings, average cost: $350,000
- 2018: 13 buildings, average cost: $285,100
- 2017: 7 buildings, average cost: $474,700
- 2016: 5 buildings, average cost: $299,000
- 2015: 13 buildings, average cost: $352,900
- 2014: 10 buildings, average cost: $362,300
- 2013: 4 buildings, average cost: $287,400
- 2012: 6 buildings, average cost: $266,300
- 2011: 5 buildings, average cost: $455,800
- 2010: 5 buildings, average cost: $336,500
- 2009: 4 buildings, average cost: $404,800
- 2008: 11 buildings, average cost: $331,500
- 2007: 9 buildings, average cost: $337,200
- 2006: 17 buildings, average cost: $324,000
- 2005: 14 buildings, average cost: $350,600
- 2004: 18 buildings, average cost: $268,500
- 2003: 41 buildings, average cost: $161,400
- 2002: 44 buildings, average cost: $187,700
- 2001: 45 buildings, average cost: $88,000
- 2000: 49 buildings, average cost: $234,300
- 1999: 55 buildings, average cost: $206,100
- 1998: 62 buildings, average cost: $151,300
- 1997: 10 buildings, average cost: $131,000
| Here: | 3.4% |
| New York: | 4.4% |
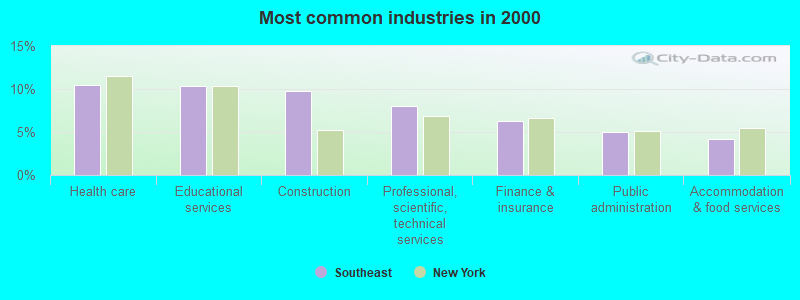
- Health care (10.5%)
- Educational services (10.4%)
- Construction (9.8%)
- Professional, scientific, technical services (8.0%)
- Finance & insurance (6.2%)
- Public administration (4.9%)
- Accommodation & food services (4.2%)
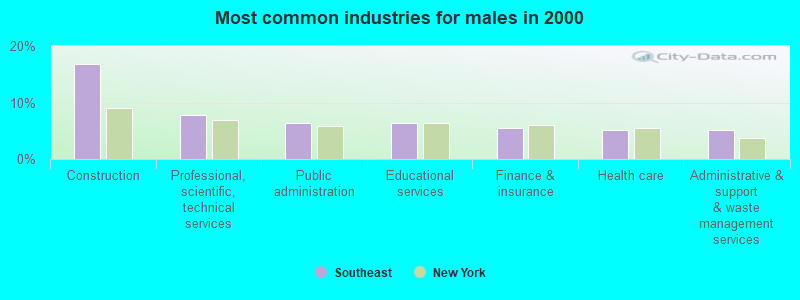
- Construction (16.8%)
- Professional, scientific, technical services (7.8%)
- Public administration (6.3%)
- Educational services (6.3%)
- Finance & insurance (5.4%)
- Health care (5.1%)
- Administrative & support & waste management services (5.1%)
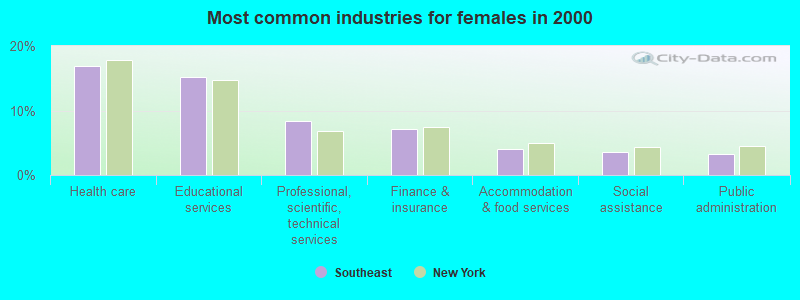
- Health care (16.9%)
- Educational services (15.2%)
- Professional, scientific, technical services (8.3%)
- Finance & insurance (7.2%)
- Accommodation & food services (4.0%)
- Social assistance (3.5%)
- Public administration (3.3%)
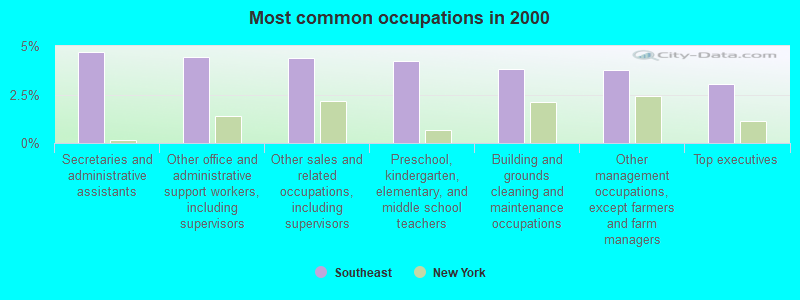
- Secretaries and administrative assistants (4.7%)
- Other office and administrative support workers, including supervisors (4.4%)
- Other sales and related occupations, including supervisors (4.4%)
- Preschool, kindergarten, elementary, and middle school teachers (4.2%)
- Building and grounds cleaning and maintenance occupations (3.8%)
- Other management occupations, except farmers and farm managers (3.7%)
- Top executives (3.0%)
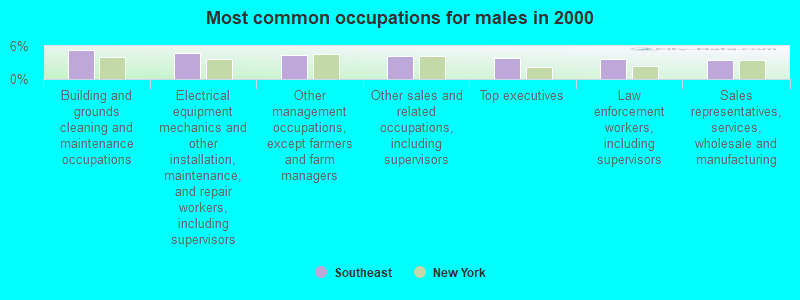
- Building and grounds cleaning and maintenance occupations (5.3%)
- Electrical equipment mechanics and other installation, maintenance, and repair workers, including supervisors (4.8%)
- Other management occupations, except farmers and farm managers (4.4%)
- Other sales and related occupations, including supervisors (4.2%)
- Top executives (3.9%)
- Law enforcement workers, including supervisors (3.7%)
- Sales representatives, services, wholesale and manufacturing (3.5%)
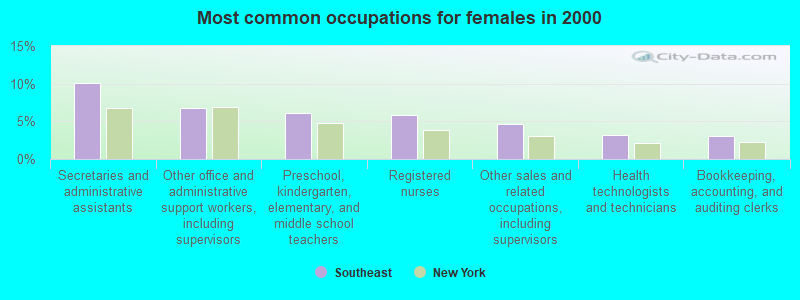
- Secretaries and administrative assistants (10.1%)
- Other office and administrative support workers, including supervisors (6.8%)
- Preschool, kindergarten, elementary, and middle school teachers (6.0%)
- Registered nurses (5.8%)
- Other sales and related occupations, including supervisors (4.6%)
- Health technologists and technicians (3.1%)
- Bookkeeping, accounting, and auditing clerks (3.0%)
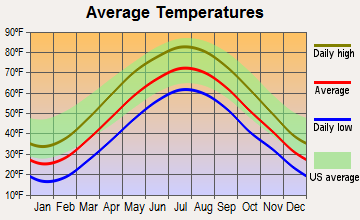
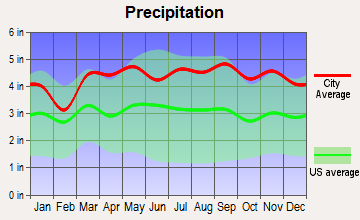
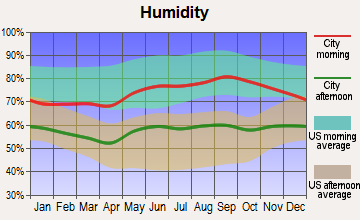
Average climate in Southeast, New York
Based on data reported by over 4,000 weather stations
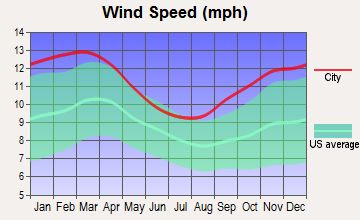
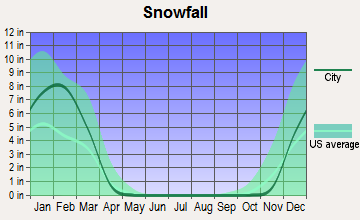
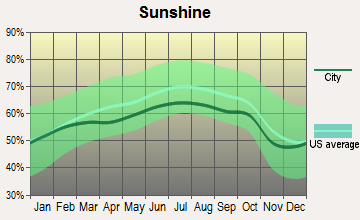
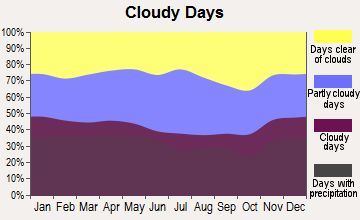
(lower is better)
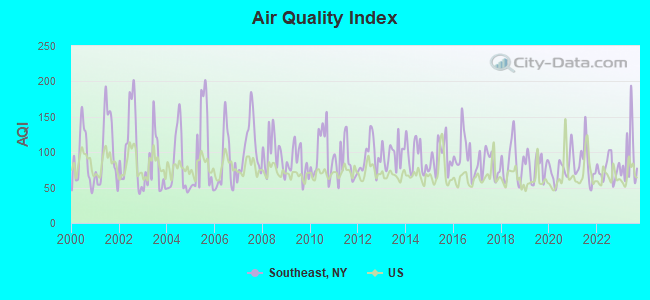
Air Quality Index (AQI) level in 2023 was 93.4. This is worse than average.
| City: | 93.4 |
| U.S.: | 72.6 |
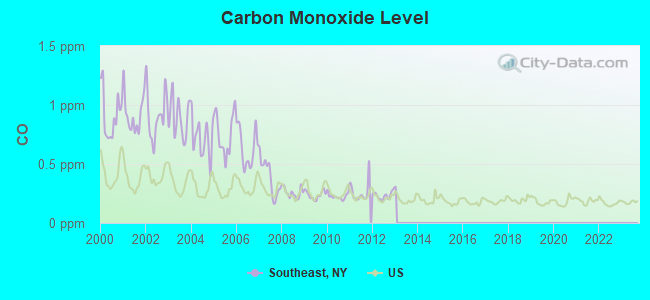
Carbon Monoxide (CO) [ppm] level in 2012 was 0.234. This is about average. Closest monitor was 22.7 miles away from the city center.
| City: | 0.234 |
| U.S.: | 0.251 |
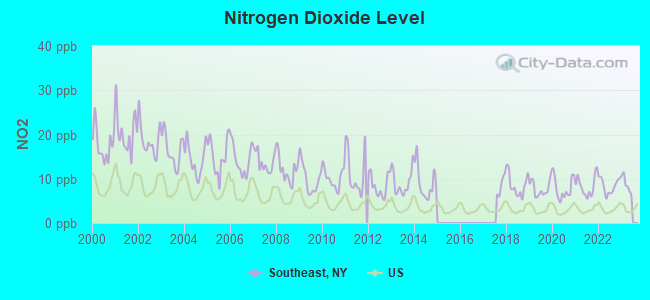
Nitrogen Dioxide (NO2) [ppb] level in 2022 was 8.39. This is significantly worse than average. Closest monitor was 8.6 miles away from the city center.
| City: | 8.39 |
| U.S.: | 5.11 |
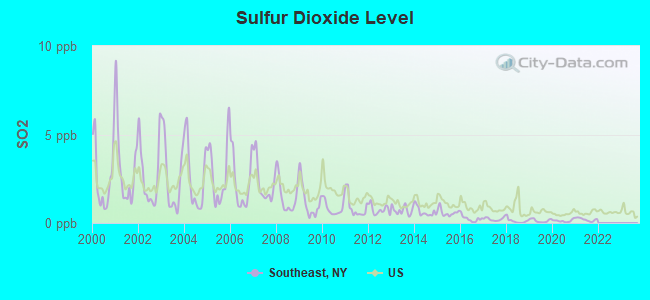
Sulfur Dioxide (SO2) [ppb] level in 2021 was 0.196. This is significantly better than average. Closest monitor was 6.4 miles away from the city center.
| City: | 0.196 |
| U.S.: | 1.515 |
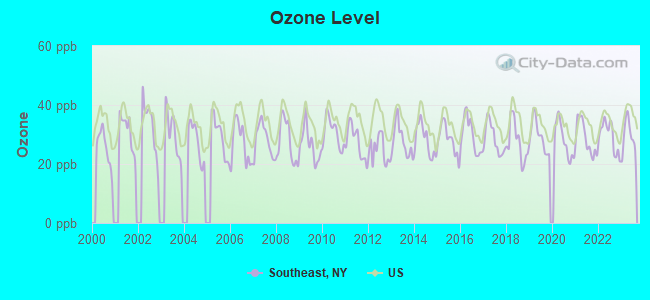
Ozone [ppb] level in 2023 was 29.6. This is about average. Closest monitor was 6.4 miles away from the city center.
| City: | 29.6 |
| U.S.: | 33.3 |
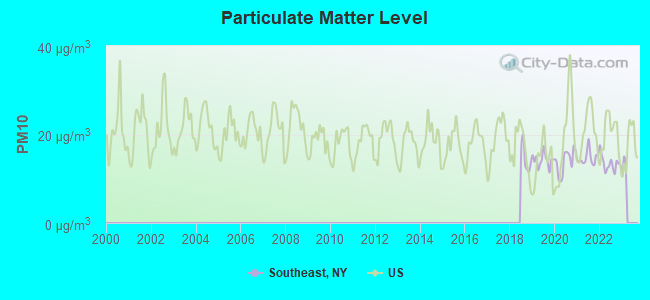
Particulate Matter (PM10) [µg/m3] level in 2022 was 13.5. This is significantly better than average. Closest monitor was 6.4 miles away from the city center.
| City: | 13.5 |
| U.S.: | 19.2 |
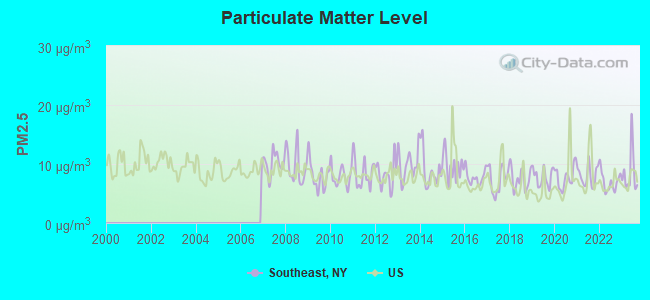
Particulate Matter (PM2.5) [µg/m3] level in 2023 was 8.54. This is about average. Closest monitor was 8.6 miles away from the city center.
| City: | 8.54 |
| U.S.: | 8.11 |
Tornado activity:
Southeast-area historical tornado activity is above New York state average. It is 31% smaller than the overall U.S. average.
On 7/10/1989, a category F4 (max. wind speeds 207-260 mph) tornado 36.2 miles away from the Southeast town center injured 40 people and caused between $50,000,000 and $500,000,000 in damages.
On 5/24/1962, a category F3 (max. wind speeds 158-206 mph) tornado 27.2 miles away from the town center killed one person and injured 50 people and caused between $500,000 and $5,000,000 in damages.
Earthquake activity:
Southeast-area historical earthquake activity is significantly above New York state average. It is 69% smaller than the overall U.S. average.On 10/7/1983 at 10:18:46, a magnitude 5.3 (5.1 MB, 5.3 LG, 5.1 ML, Class: Moderate, Intensity: VI - VII) earthquake occurred 180.2 miles away from the city center
On 4/20/2002 at 10:50:47, a magnitude 5.3 (5.3 ML, Depth: 3.0 mi) earthquake occurred 215.1 miles away from the city center
On 4/20/2002 at 10:50:47, a magnitude 5.2 (5.2 MB, 4.2 MS, 5.2 MW, 5.0 MW) earthquake occurred 213.3 miles away from the city center
On 8/23/2011 at 17:51:04, a magnitude 5.8 (5.8 MW, Depth: 3.7 mi) earthquake occurred 333.9 miles away from the city center
On 1/16/1994 at 01:49:16, a magnitude 4.6 (4.6 MB, 4.6 LG, Depth: 3.1 mi, Class: Light, Intensity: IV - V) earthquake occurred 147.2 miles away from the city center
On 1/19/1982 at 00:14:42, a magnitude 4.7 (4.5 MB, 4.7 MD, 4.5 LG) earthquake occurred 177.5 miles away from the city center
Magnitude types: regional Lg-wave magnitude (LG), body-wave magnitude (MB), duration magnitude (MD), local magnitude (ML), surface-wave magnitude (MS), moment magnitude (MW)
Natural disasters:
The number of natural disasters in Putnam County (22) is greater than the US average (15).Major Disasters (Presidential) Declared: 13
Emergencies Declared: 8
Causes of natural disasters: Hurricanes: 7, Floods: 5, Storms: 5, Blizzards: 2, Heavy Rain: 1, Landslide: 1, Power Outage: 1, Snowstorm: 1, Tropical Storm: 1, Water Shortage: 1, Winter Storm: 1, Other: 3 (Note: some incidents may be assigned to more than one category).
Hospitals and medical centers near Southeast:
- PUTNAM CO DOH NURSNG SVCS CHHA (Home Health Center, about 2 miles away; BREWSTER, NY)
- CELIA DILL DIALYSIS CENTER (Dialysis Facility, about 4 miles away; CARMEL, NY)
- PUTNAM HOSPITAL CENTER Acute Care Hospitals (about 4 miles away; CARMEL, NY)
- WATERVIEW HILLS REHABILITATION AND NRSG CTR (Nursing Home, about 6 miles away; PURDY STATION, NY)
- SALEM HILLS REHABILITATION AND NURSING CTR (Nursing Home, about 6 miles away; PURDYS, NY)
- UCPA OF PUTNAM AND SOUTHERN DUTCHESS COUNTIES (Hospital, about 6 miles away; MAHOPAC, NY)
- OPENGATE, INC (Hospital, about 7 miles away; SOMERS, NY)
Operable nuclear power plants near Southeast:
- 20 miles: Indian Point 2 and 3 in Buchanan, NY.
Colleges/universities with over 2000 students nearest to Southeast:
- Western Connecticut State University (about 9 miles; Danbury, CT; Full-time enrollment: 5,345)
- United States Military Academy (about 19 miles; West Point, NY; FT enrollment: 5,651)
- Mount Saint Mary College (about 23 miles; Newburgh, NY; FT enrollment: 2,166)
- Norwalk Community College (about 23 miles; Norwalk, CT; FT enrollment: 4,085)
- Sacred Heart University (about 23 miles; Fairfield, CT; FT enrollment: 5,650)
- Vassar College (about 25 miles; Poughkeepsie, NY; FT enrollment: 2,469)
- Fairfield University (about 25 miles; Fairfield, CT; FT enrollment: 4,640)
Points of interest:
Notable locations in Southeast: Centennial Golf Club (A), Croton Falls Rest Area (B), Vails Grove Golf Course (C), Field's Corners (D), Salingers Orchards (E), Longridge Corporate Park (F), Morefar Golf Club (G), Mount Ebo Corporate Center (H), Brewster Village Wastewater Treatment Plant (I), Brewster Heights Sewer District Sewage Treatment Plant (J), Hidden Meadow Farms (K), Brewster Public Library (L), Putnam Ridge Nursing Home (M), Brewster Fire Department (N). Display/hide their locations on the map
Churches in Southeast include: Grace Assembly of God (A), Iglesia Pentecostal Unida (B), Kingdom Hall of Jehovahs Witnesses (C), Trinity Lutheran Church (D), First Baptist Church of Brewster (E), First United Methodist Church (F), Saint Lawrence O'Toole Church (G), Saint Andrew's Episcopal Church (H), Brewster Presbyterian Church (I). Display/hide their locations on the map
Cemeteries: Ellis Cemetery (1), Drewsclift Cemetery (2), Milltown Cemetery (3). Display/hide their locations on the map
Lakes, reservoirs, and swamps: Peach Lake (A), Lake Tonetta (B), Brewster Pond (C), Haines Pond (D), East Branch Reservoir (E), Middle Branch Reservoir (F), Bog Brook Reservoir (G), Marvin Peat Bed (H). Display/hide their locations on the map
Streams, rivers, and creeks: Peach Lake Brook (A), Tonetta Brook (B), Corner Pond Brook (C), Salmons Daily Brook (D), Holly Stream (E), Beaver Brook (F). Display/hide their locations on the map
Birthplace of: Fanny Crosby - Lyricist.
| This town: | 2.7 people |
| New York: | 2.6 people |
| This town: | 71.4% |
| Whole state: | 63.5% |
| This town: | 4.2% |
| Whole state: | 6.8% |
Likely homosexual households (counted as self-reported same-sex unmarried-partner households)
- Lesbian couples: 0.2% of all households
- Gay men: 0.3% of all households
| This town: | 6.1% |
| Whole state: | 14.6% |
| This town: | 3.7% |
| Whole state: | 7.4% |
People in group quarters in Southeast in 2010:
- 154 people in nursing facilities/skilled-nursing facilities
- 81 people in residential treatment centers for adults
- 29 people in other noninstitutional facilities
- 28 people in group homes intended for adults
People in group quarters in Southeast in 2000:
- 67 people in homes or halfway houses for drug/alcohol abuse
- 24 people in homes for the mentally retarded
- 23 people in other noninstitutional group quarters
- 22 people in mental (psychiatric) hospitals or wards
- 12 people in homes for the mentally ill
- 8 people in religious group quarters
For population 15 years and over in Southeast:
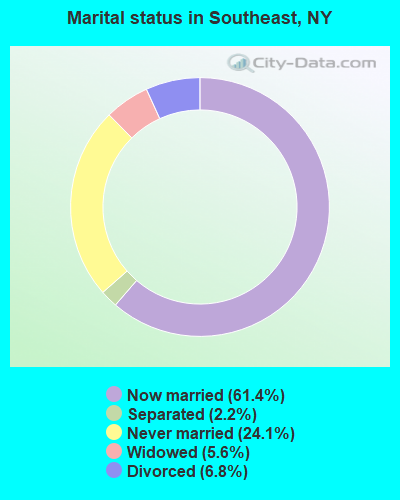
- Never married: 24.1%
- Now married: 61.4%
- Separated: 2.2%
- Widowed: 5.6%
- Divorced: 6.8%
For population 25 years and over in Southeast:
- High school or higher: 90.1%
- Bachelor's degree or higher: 35.0%
- Graduate or professional degree: 13.8%
- Unemployed: 4.4%
- Mean travel time to work (commute): 36.0 minutes
| Here: | 11.5 |
| New York average: | 14.2 |
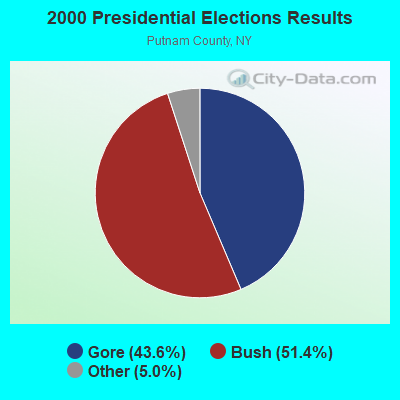
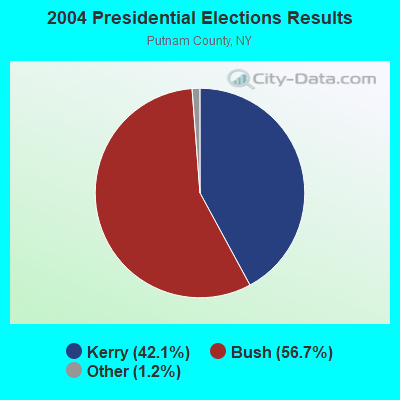
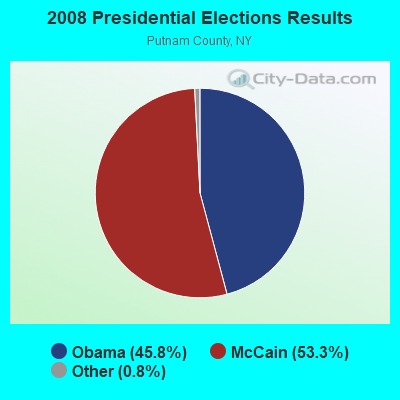
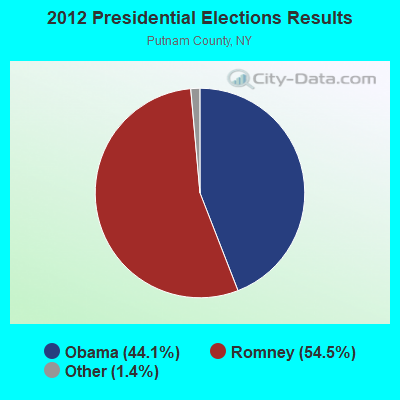
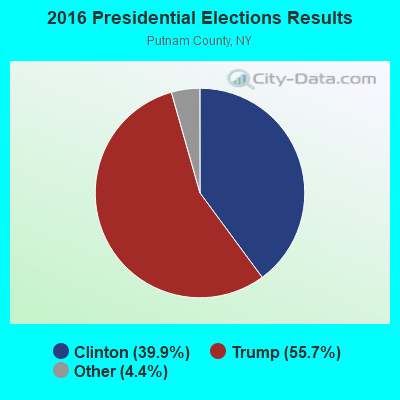
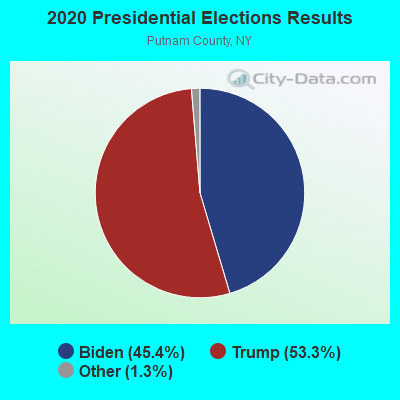
Graphs represent county-level data. Detailed 2008 Election Results
Religion statistics for Southeast, NY (based on Putnam County data)
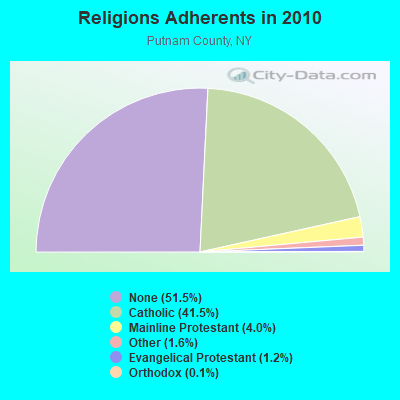
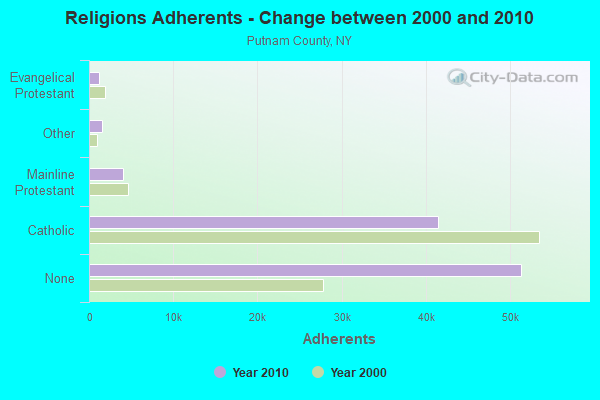
| Religion | Adherents | Congregations |
|---|---|---|
| Catholic | 41,420 | 9 |
| Mainline Protestant | 4,017 | 23 |
| Other | 1,588 | 7 |
| Evangelical Protestant | 1,208 | 14 |
| Orthodox | 145 | 2 |
| None | 51,332 | - |
Food Environment Statistics:
| This county: | 3.12 / 10,000 pop. |
| State: | 4.13 / 10,000 pop. |
| Putnam County: | 0.81 / 10,000 pop. |
| New York: | 0.92 / 10,000 pop. |
| This county: | 2.22 / 10,000 pop. |
| State: | 1.68 / 10,000 pop. |
| Putnam County: | 8.77 / 10,000 pop. |
| New York: | 8.82 / 10,000 pop. |
| This county: | 6.9% |
| New York: | 8.2% |
| Putnam County: | 24.3% |
| New York: | 23.8% |
| Putnam County: | 22.7% |
| New York: | 15.6% |
Strongest AM radio stations in Southeast:
- WPUT (1510 AM; daytime; 1 kW; BREWSTER, NY; Owner: CUMULUS LICENSING CORP.)
- WFAN (660 AM; 50 kW; NEW YORK, NY; Owner: INFINITY BROADCASTING OPERATIONS, INC.)
- WCBS (880 AM; 50 kW; NEW YORK, NY; Owner: INFINITY BROADCASTING OPERATIONS, INC.)
- WABC (770 AM; 50 kW; NEW YORK, NY; Owner: WABC-AM RADIO, INC.)
- WMCA (570 AM; 50 kW; NEW YORK, NY; Owner: SALEM MEDIA OF NEW YORK, LLC)
- WREF (850 AM; 2 kW; RIDGEFIELD, CT; Owner: THE BERKSHIRE BROADCASTING CORP.)
- WOR (710 AM; 50 kW; NEW YORK, NY; Owner: BUCKLEY BROADCASTING CORPORATION)
- WGSM (740 AM; 25 kW; HUNTINGTON, NY; Owner: K RADIO LICENSEE, INC.)
- WEPN (1050 AM; 50 kW; NEW YORK, NY; Owner: NEW YORK AM RADIO, LLC)
- WINS (1010 AM; 50 kW; NEW YORK, NY; Owner: INFINITY BROADCASTING OPERATIONS, INC.)
- WBBR (1130 AM; 50 kW; NEW YORK, NY; Owner: BLOOMBERG COMMUNICATIONS INC.)
- WTIC (1080 AM; 50 kW; HARTFORD, CT; Owner: INFINITY RADIO OPERATIONS INC.)
- WADO (1280 AM; 50 kW; NEW YORK, NY; Owner: WADO-AM LICENSE CORP.)
Strongest FM radio stations in Southeast:
- WDBY (105.5 FM; PATTERSON, NY; Owner: CUMULUS LICENSING CORP.)
- WDAQ (98.3 FM; DANBURY, CT; Owner: BERKSHIRE BROADCASTING CORP.)
- WRKI (95.1 FM; BROOKFIELD, CT; Owner: CUMULUS LICENSING CORP.)
- WSPK (104.7 FM; POUGHKEEPSIE, NY; Owner: 6 JOHNSON ROAD LICENSES, INC.)
- WRNQ (92.1 FM; POUGHKEEPSIE, NY; Owner: CLEAR CHANNEL BROADCASTING LICENSES, INC.)
- WPDH (101.5 FM; POUGHKEEPSIE, NY; Owner: CUMULUS LICENSING CORP.)
- WFAF (106.3 FM; MOUNT KISCO, NY; Owner: CUMULUS LICENSING CORP.)
- WFNP (88.7 FM; ROSENDALE, NY; Owner: STATE UNIVERSITY OF NEW YORK)
- WRHV (88.7 FM; POUGHKEEPSIE, NY; Owner: WMHT EDUCATIONAL TELECOMMUNICATIONS)
- WHUD (100.7 FM; PEEKSKILL, NY; Owner: 6 JOHNSON ROAD LICENSES, INC.)
- WLJP (89.3 FM; MONROE, NY; Owner: SOUND OF LIFE, INC.)
- WXCI (91.7 FM; DANBURY, CT; Owner: WESTERN CONNECTICUT STATE UNIVERSITY)
- WPLJ (95.5 FM; NEW YORK, NY; Owner: WPLJ-FM RADIO, INC.)
- W206AW (89.1 FM; PAWLING, NY; Owner: SOUND OF LIFE, INC.)
- WCZX (97.7 FM; HYDE PARK, NY; Owner: CUMULUS LICENSING CORP.)
- WRRB (96.9 FM; ARLINGTON, NY; Owner: CUMULUS LICENSING CORP.)
- WBWZ (93.3 FM; NEW PALTZ, NY; Owner: CLEVELAND RADIO LICENSES, LLC)
- WRWD-FM (107.3 FM; HIGHLAND, NY; Owner: CLEVELAND RADIO LICENSES, LLC)
- WFKP (99.3 FM; ELLENVILLE, NY; Owner: CLEAR CHANNEL BROADCASTING LICENSES, INC.)
- WFAR (93.3 FM; DANBURY, CT; Owner: DANBURY COMMUNITY RADIO, INC.)
TV broadcast stations around Southeast:
- WTBY (Channel 54; POUGHKEEPSIE, NY; Owner: TRINITY BROADCASTING OF NEW YORK, INC.)
- WNYW (Channel 5; NEW YORK, NY; Owner: FOX TELEVISION STATIONS, INC.)
- WCBS-TV (Channel 2; NEW YORK, NY; Owner: CBS BROADCASTING INC.)
- WTIC-TV (Channel 61; HARTFORD, CT; Owner: TRIBUNE TELEVISION COMPANY)
- W11BJ (Channel 11; HARTFORD, CT; Owner: COMMUNICATIONS SITE MANAGEMENT LLC)
- WABC-TV (Channel 7; NEW YORK, NY; Owner: AMERICAN BROADCASTING COMPANIES, INC)
- WPIX (Channel 11; NEW YORK, NY; Owner: WPIX, INC.)
- WWOR-TV (Channel 9; SECAUCUS, NJ; Owner: FOX TELEVISION STATIONS, INC.)
- WNJU (Channel 47; LINDEN, NJ; Owner: WNJU LICENSE CORPORATION)
- WPXN-TV (Channel 31; NEW YORK, NY; Owner: PAXSON COMMUNICATIONS LICENSE COMPANY, LLC)
- WTXX (Channel 20; WATERBURY, CT; Owner: WTXX INC.)
- WTNH (Channel 8; NEW HAVEN, CT; Owner: WTNH BROADCASTING, INC.)
- WXNY-LP (Channel 32; NEW YORK, NY; Owner: ISLAND BROADCASTING COMPANY)
- WFUT (Channel 68; NEWARK, NJ; Owner: UNIVISION NEW YORK LLC)
- WNBC (Channel 4; NEW YORK, NY; Owner: NATIONAL BROADCASTING COMPANY, INC.)
- WNET (Channel 13; NEWARK, NJ; Owner: EDUCATIONAL BROADCASTING CORPORATION)
- WXTV (Channel 41; PATERSON, NJ; Owner: WXTV LICENSE PARTNERSHIP, G.P.)
- WFME-TV (Channel 66; WEST MILFORD, NJ; Owner: FAMILY STATIONS, INC.)
- WNYE-TV (Channel 25; NEW YORK, NY; Owner: NEW YORK CITY BOARD OF EDUCATION)
- WEDW (Channel 49; BRIDGEPORT, CT; Owner: CONNECTICUT PUBLIC BROADCASTING, INC.)
- WEDY (Channel 65; NEW HAVEN, CT; Owner: CONNECTICUT PUBLIC BROADCASTING, INC.)
- WCTX (Channel 59; NEW HAVEN, CT; Owner: WTNH BROADCASTING, INC.)
- WVIT (Channel 30; NEW BRITAIN, CT; Owner: OUTLET BROADCASTING, INC)
- W68DN (Channel 68; CHERRY HILL, ETC., NJ; Owner: MARCIA COHEN)
- WEDH (Channel 24; HARTFORD, CT; Owner: CONNECTICUT PUBLIC BROADCASTING, INC.)
- National Bridge Inventory (NBI) Statistics
- 58Number of bridges
- 922ft / 281mTotal length
- $242,770,000Total costs
- 1,107,535Total average daily traffic
- 81,250Total average daily truck traffic
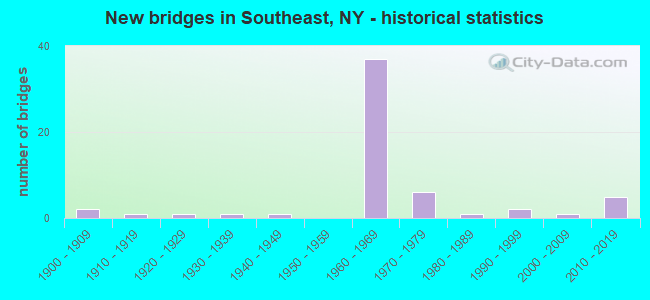
- New bridges - historical statistics
- 21900-1909
- 11910-1919
- 11920-1929
- 11930-1939
- 11940-1949
- 371960-1969
- 61970-1979
- 11980-1989
- 21990-1999
- 12000-2009
- 52010-2019
FCC Registered Broadcast Land Mobile Towers:
2- Tulip Rd (Lat: 41.385639 Lon: -73.545417), Call Sign: WNGJ725,
Assigned Frequencies: 49.0200 MHz, Grant Date: 04/14/2021, Expiration Date: 04/30/2031, Registrant: Fcc-Faa Licensing, LLC, 8932 Suite D Milford Haven Court, Lorton, VA 22079, Phone: (703) 615-6615, Email:
- SOUTHEAST, 87 Hillside Park (Lat: 41.394167 Lon: -73.624722), Type: Gtower, Structure height: 45.7 m, Overall height: 51.8 m, Call Sign: WQSB942,
Assigned Frequencies: 217.050 MHz, 218.350 MHz, 219.475 MHz, Grant Date: 08/28/2013, Expiration Date: 08/28/2023, Cancellation Date: 08/27/2014, Certifier: Peter Stritzinger, Registrant: Utilities Telecom Council, Inc., 1129 20th Street, Nw Suite 350, Washington, DC 20036, Phone: (203) 833-6818, Email:
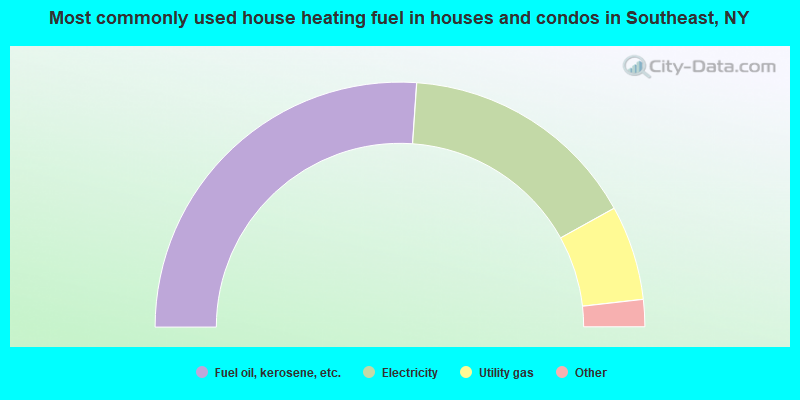
- 52.2%Fuel oil, kerosene, etc.
- 31.7%Electricity
- 12.5%Utility gas
- 1.9%Wood
- 1.3%Bottled, tank, or LP gas
- 0.3%Other fuel
- 0.2%Coal or coke
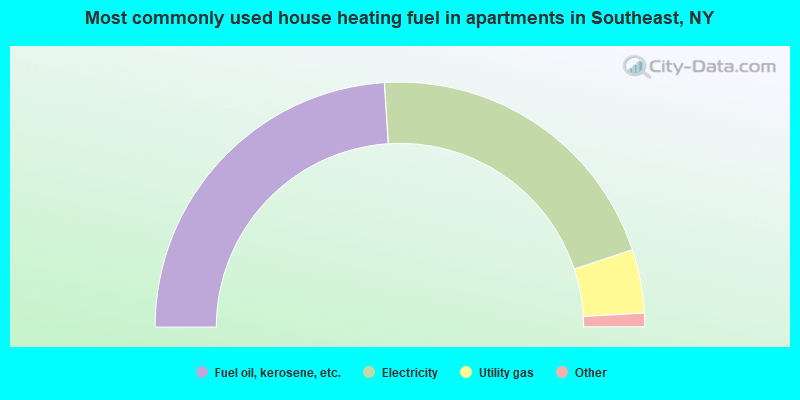
- 48.0%Fuel oil, kerosene, etc.
- 41.8%Electricity
- 8.4%Utility gas
- 1.2%Bottled, tank, or LP gas
- 0.6%Other fuel
Southeast compared to New York state average:
- Unemployed percentage significantly below state average.
- Black race population percentage significantly below state average.
- Foreign-born population percentage below state average.
- Renting percentage below state average.
- Length of stay since moving in significantly above state average.
- Number of rooms per house significantly below state average.
- House age significantly below state average.
Southeast on our top lists:
- #12 on the list of "Top 101 cities with largest percentage of males in industries: book stores and news dealers (population 5,000+)"
- #36 on the list of "Top 101 cities with largest percentage of females in occupations: operations specialties managers except financial managers (population 5,000+)"
- #39 on the list of "Top 101 cities with largest percentage of males in occupations: preschool, kindergarten, elementary and middle school teachers (population 5,000+)"
- #39 on the list of "Top 101 cities with the most residents born in Other Central America (population 500+)"
- #43 on the list of "Top 101 cities with largest percentage of males in occupations: occupational and physical therapist assistants and aides (population 5,000+)"
- #44 on the list of "Top 101 cities with largest percentage of females in industries: publishing, and motion picture and sound recording industries (population 5,000+)"
- #56 on the list of "Top 101 cities with largest percentage of females in occupations: secretaries and administrative assistants (population 5,000+)"
- #59 on the list of "Top 101 cities with largest percentage of males in industries: rail transportation (population 5,000+)"
- #60 on the list of "Top 101 cities with largest percentage of females in occupations: occupational and physical therapist assistants and aides (population 5,000+)"
- #71 on the list of "Top 101 cities with largest percentage of females in industries: vending machine operators (population 5,000+)"
- #75 on the list of "Top 101 cities with the most people taking railroad to work (population 5,000+)"
- #82 on the list of "Top 101 cities with largest percentage of females in industries: hardware, plumbing and heating equipment, and supplies merchant wholesalers (population 5,000+)"
- #83 on the list of "Top 101 cities with largest percentage of males in industries: broadcasting and telecommunications (population 5,000+)"
- #89 on the list of "Top 101 cities with largest percentage of females in occupations: top executives (population 5,000+)"
- #96 on the list of "Top 101 cities with largest percentage of females in industries: recyclable material merchant wholesalers (population 5,000+)"
- #50 on the list of "Top 101 counties with the highest surface withdrawal of fresh water for public supply"
- #51 on the list of "Top 101 counties with the lowest Ozone (1-hour) air pollution readings in 2012 (ppm)"
- #72 on the list of "Top 101 counties with the highest total withdrawal of fresh water for public supply"
- #89 on the list of "Top 101 counties with the lowest Sulfur Oxides Annual air pollution readings in 2012 (µg/m3)"