Washburn, Tennessee (TN) income map, earnings map, and wages data
The median household income in Washburn, TN in 2022 was $44,918, which was 45.3% less than the median annual income of $65,254 across the entire state of Tennessee. Compared to the median income of $25,076 in 2000 this represents an increase of 44.2%. The per capita income in 2022 was $25,728, which means an increase of 47.0% compared to 2000 when it was $13,641.
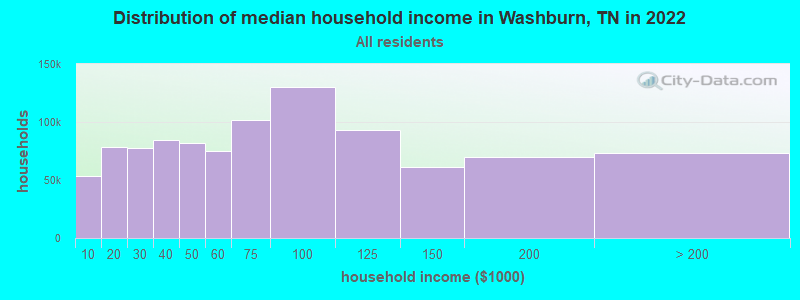
Income statistics for all residents
Median household income in Washburn, TN in 2022:| Washburn: | $44,918 |
| Tennessee: | $65,254 |
Change in median household income between 2000 and 2022:| Washburn, Tennessee: | +79.1% |
| State: | +79.5% |
Number of households with income < $10k:| Washburn: | 5.4% (53,301) |
| State: | 5.4% (154,793) |
Number of households with income $10k - 20k:| Washburn: | 8.0% (78,831) |
| Tennessee: | 8.0% (228,599) |
Number of households with income $20k - 30k:| Washburn: | 7.9% (77,523) |
| Tennessee: | 7.9% (224,908) |
Number of households with income $30k - 40k:| Washburn: | 8.6% (84,149) |
| State: | 8.6% (244,297) |
Number of households with income $40k - 50k:| Washburn: | 8.4% (82,296) |
| State: | 8.4% (238,949) |
Number of households with income $50k - 60k:| Washburn: | 7.7% (75,242) |
| State: | 7.7% (218,438) |
Number of households with income $60k - 75k:| Washburn: | 10.3% (101,343) |
| State: | 10.3% (294,172) |
Number of households with income $75k - 100k:| Washburn: | 13.3% (129,975) |
| State: | 13.3% (377,310) |
Number of households with income $100k - 125k:| Washburn: | 9.5% (92,757) |
| Tennessee: | 9.5% (269,124) |
Number of households with income $125k - 150k:| Washburn: | 6.3% (61,391) |
| State: | 6.3% (178,328) |
Number of households with income $150k - 200k:| Washburn: | 7.2% (70,209) |
| Tennessee: | 7.2% (204,030) |
Number of households with income > $200k:| Washburn: | 7.5% (73,406) |
| State: | 7.5% (213,736) |
Aggregate household income in Washburn in 2022: $2,042,416,592
Median family income in Washburn in 2022:| Washburn: | $57,400 |
| Tennessee: | $80,910 |
Median non-family income in Washburn in 2022:| Washburn: | $18,645 |
| State: | $40,285 |
Change in median non-family income between 2000 and 2022:| Washburn, Tennessee: | +91.6% |
| State: | +91.5% |
Median per capita income in Washburn in 2022:| Washburn: | $25,729 |
| State: | $36,704 |
Change in median per capita income between 2000 and 2022:| Washburn, Tennessee: | +88.6% |
| State: | +89.3% |
Income statistics for White residents
Median household income in Washburn, TN in 2022:| Washburn: | $45,349 |
| State: | $69,826 |
Change in median household income between 2000 and 2022:| Washburn, Tennessee: | +80.8% |
| State: | +82.9% |
Number of households with income < $10k:| Washburn: | 4.7% (32,992) |
| State: | 4.6% (100,279) |
Number of households with income $10k - 20k:| Washburn: | 7.7% (54,382) |
| State: | 7.6% (165,031) |
Number of households with income $20k - 30k:| Washburn: | 7.5% (52,781) |
| State: | 7.4% (160,229) |
Number of households with income $30k - 40k:| Washburn: | 8.1% (57,268) |
| State: | 8.1% (174,784) |
Number of households with income $40k - 50k:| Washburn: | 7.9% (55,650) |
| State: | 7.8% (169,622) |
Number of households with income $50k - 60k:| Washburn: | 7.7% (54,168) |
| State: | 7.6% (165,508) |
Number of households with income $60k - 75k:| Washburn: | 10.4% (73,391) |
| Tennessee: | 10.3% (223,937) |
Number of households with income $75k - 100k:| Washburn: | 13.5% (95,694) |
| State: | 13.5% (292,688) |
Number of households with income $100k - 125k:| Washburn: | 10.1% (71,683) |
| Tennessee: | 10.1% (219,251) |
Number of households with income $125k - 150k:| Washburn: | 6.6% (46,449) |
| State: | 6.6% (142,574) |
Number of households with income $150k - 200k:| Washburn: | 7.6% (53,968) |
| Tennessee: | 7.7% (166,039) |
Number of households with income > $200k:| Washburn: | 8.4% (59,472) |
| State: | 8.5% (184,546) |
Aggregate household income in Washburn in 2022: $1,642,773,952
Median family income in Washburn in 2022:| Washburn: | $57,635 |
| State: | $86,015 |
Number of families with income < $10k:| Washburn: | 8.5% (57) |
| State: | 3.1% (43,751) |
Number of families with income $10k - 20k:| Washburn: | 9.9% (66) |
| Tennessee: | 3.5% (49,925) |
Number of families with income $20k - 30k:| Washburn: | 6.8% (45) |
| State: | 5.0% (70,431) |
Number of families with income $30k - 40k:| Washburn: | 12.2% (81) |
| State: | 6.6% (93,498) |
Number of families with income $40k - 50k:| Washburn: | 6.6% (44) |
| State: | 6.8% (96,726) |
Number of families with income $50k - 60k:| Washburn: | 7.3% (49) |
| Tennessee: | 7.2% (101,879) |
Number of families with income $60k - 75k:| Washburn: | 5.3% (35) |
| Tennessee: | 10.7% (151,997) |
Number of families with income $75k - 100k:| Washburn: | 5.9% (39) |
| State: | 15.4% (218,373) |
Number of families with income $100k - 125k:| Washburn: | 10.0% (66) |
| State: | 12.6% (178,761) |
Number of families with income $125k - 150k:| Washburn: | 5.9% (39) |
| State: | 8.2% (116,575) |
Number of families with income $150k - 200k:| Washburn: | 21.4% (142) |
| State: | 9.9% (141,123) |
Median non-family income in Washburn in 2022:| Washburn: | $18,596 |
| State: | $41,178 |
Change in median non-family income between 2000 and 2022:| Washburn, Tennessee: | +91.1% |
| State: | +91.1% |
Median per capita income in Washburn in 2022:| Washburn: | $26,160 |
| State: | $40,126 |
Change in median per capita income between 2000 and 2022:| Washburn, Tennessee: | +91.8% |
| Tennessee: | +92.6% |