The median household income in Westmorland, CA in 2022 was $33,873, which was 170.3% less than the median annual income of $91,551 across the entire state of California. Compared to the median income of $23,365 in 2000 this represents an increase of 31.0%. The per capita income in 2022 was $13,854, which means an increase of 35.5% compared to 2000 when it was $8,941.
Whole page based on the data from 2000 / 2022 when the population of Westmorland, California was 2,131 / 2,000
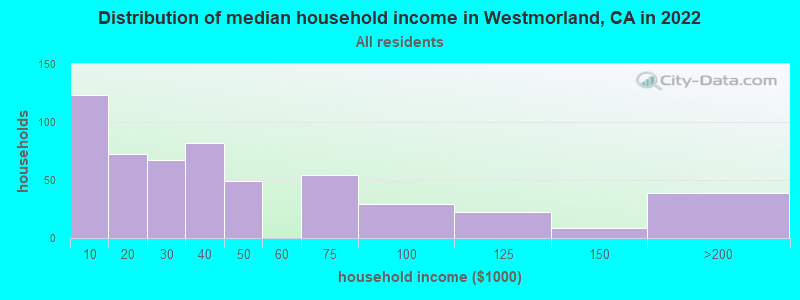
Income statistics for all residents
Median household income in Westmorland, CA in 2022:
Westmorland:
$33,874
State:
$91,551
Change in median household income between 2000 and 2022:
Westmorland, California:
+45.0%
State:
+92.8%
Number of households with income < $10k:
Westmorland:
22.5% (123)
State:
4.8% (654,370)
Number of households with income $10k - 20k:
Westmorland:
13.2% (72)
California:
5.8% (789,493)
Number of households with income $20k - 30k:
Westmorland:
12.3% (67)
State:
5.7% (778,318)
Number of households with income $30k - 40k:
Westmorland:
15.0% (82)
California:
5.8% (783,170)
Number of households with income $40k - 50k:
Westmorland:
9.0% (49)
State:
5.8% (781,352)
Number of households with income $50k - 60k:
Westmorland:
0.0% (0)
California:
5.6% (760,175)
Number of households with income $60k - 75k:
Westmorland:
9.9% (54)
State:
8.2% (1,104,699)
Number of households with income $75k - 100k:
Westmorland:
5.3% (29)
California:
12.0% (1,627,633)
Number of households with income $100k - 125k:
Westmorland:
4.0% (22)
California:
10.0% (1,358,619)
Number of households with income $125k - 150k:
Westmorland:
1.6% (9)
State:
7.6% (1,027,455)
Number of households with income $150k - 200k:
Westmorland:
7.1% (39)
State:
10.6% (1,439,811)
Number of households with income > $200k:
Westmorland:
0.0% (0)
State:
18.0% (2,445,491)
Aggregate household income in Westmorland in 2022: $26,358,632
Median family income in Westmorland in 2022:
Westmorland:
$31,844
California:
$104,823
Number of families with income < $10k:
Westmorland:
40.1% (185)
State:
3.1% (280,184)
Number of families with income $10k - 20k:
Westmorland:
6.1% (28)
State:
3.5% (322,064)
Number of families with income $20k - 30k:
Westmorland:
8.5% (39)
State:
4.7% (433,722)
Number of families with income $30k - 40k:
Westmorland:
4.9% (23)
California:
5.2% (478,213)
Number of families with income $40k - 50k:
Westmorland:
12.2% (57)
State:
5.6% (511,647)
Number of families with income $60k - 75k:
Westmorland:
9.3% (43)
State:
8.0% (731,094)
Number of families with income $75k - 100k:
Westmorland:
7.6% (35)
California:
12.2% (1,115,621)
Number of families with income $100k - 125k:
Westmorland:
7.0% (32)
State:
10.5% (959,600)
Number of families with income $150k - 200k:
Westmorland:
4.3% (20)
California:
11.9% (1,087,239)
Median non-family income in Westmorland in 2022:
Westmorland:
$19,960
State:
$59,348
Change in median non-family income between 2000 and 2022:
Westmorland, California:
+55.8%
State:
+85.3%
Median per capita income in Westmorland in 2022:
Westmorland:
$13,855
California:
$46,661
Change in median per capita income between 2000 and 2022:
Westmorland, California:
+55.0%
California:
+105.5%
Income statistics for White residents
Median household income in Westmorland, CA in 2022:
Westmorland:
$28,659
State:
$100,917
Change in median household income between 2000 and 2022:
Westmorland, California:
+28.1%
California:
+96.8%
Number of households with income < $10k:
Westmorland:
34.2% (69)
State:
4.4% (284,109)
Number of households with income $10k - 20k:
Westmorland:
10.4% (21)
State:
5.3% (340,330)
Number of households with income $20k - 30k:
Westmorland:
0.0% (0)
State:
5.3% (343,145)
Number of households with income $30k - 40k:
Westmorland:
35.6% (72)
State:
5.1% (330,146)
Number of households with income $40k - 50k:
Westmorland:
1.5% (3)
State:
5.2% (335,310)
Number of households with income $50k - 60k:
Westmorland:
0.0% (0)
State:
5.1% (326,299)
Number of households with income $60k - 75k:
Westmorland:
6.9% (14)
California:
7.6% (487,640)
Number of households with income $75k - 100k:
Westmorland:
0.0% (0)
State:
11.5% (736,578)
Number of households with income $100k - 125k:
Westmorland:
1.5% (3)
State:
10.1% (648,782)
Number of households with income $125k - 150k:
Westmorland:
2.0% (4)
California:
7.8% (499,671)
Number of households with income $150k - 200k:
Westmorland:
7.9% (16)
State:
11.4% (729,603)
Number of households with income > $200k:
Westmorland:
0.0% (0)
State:
21.2% (1,364,246)
Aggregate household income in Westmorland in 2022: $5,389,776
Median non-family income in Westmorland in 2022:
Westmorland:
$14,883
State:
$62,819
Change in median non-family income between 2000 and 2022:
Westmorland, California:
+0.9%
State:
+84.4%
Median per capita income in Westmorland in 2022:
Westmorland:
$14,990
California:
$61,706
Change in median per capita income between 2000 and 2022:
Westmorland, California:
+51.3%
State:
+122.7%
Income statistics for Black or African American residents
Median per capita income in Westmorland in 2022:
Westmorland:
$16,936
State:
$36,708
Change in median per capita income between 2000 and 2022:
Westmorland, California:
+96.3%
State:
+110.4%
Income statistics for Asian residents
Aggregate household income in Westmorland in 2022: $425,420
Median per capita income in Westmorland in 2022:
Westmorland:
$23,680
California:
$58,824
Change in median per capita income between 2000 and 2022:
Westmorland, California:
+109.1%
State:
+166.8%
Income statistics for Hispanic or Latino residents
Median household income in Westmorland, CA in 2022:
Westmorland:
$35,694
State:
$75,698
Change in median household income between 2000 and 2022:
Westmorland, California:
+55.3%
California:
+107.2%
Number of households with income < $10k:
Westmorland:
21.2% (93)
State:
4.3% (183,294)
Number of households with income $10k - 20k:
Westmorland:
13.0% (57)
State:
6.0% (253,903)
Number of households with income $20k - 30k:
Westmorland:
16.0% (70)
State:
6.8% (286,386)
Number of households with income $30k - 40k:
Westmorland:
8.4% (37)
State:
7.4% (313,728)
Number of households with income $40k - 50k:
Westmorland:
10.7% (47)
State:
7.4% (313,199)
Number of households with income $50k - 60k:
Westmorland:
0.0% (0)
California:
7.2% (305,366)
Number of households with income $60k - 75k:
Westmorland:
11.0% (48)
State:
10.3% (434,937)
Number of households with income $75k - 100k:
Westmorland:
7.3% (32)
State:
14.4% (607,302)
Number of households with income $100k - 125k:
Westmorland:
4.8% (21)
California:
10.6% (447,424)
Number of households with income $125k - 150k:
Westmorland:
2.3% (10)
State:
7.5% (316,022)
Number of households with income $150k - 200k:
Westmorland:
5.3% (23)
State:
9.2% (386,269)
Number of households with income > $200k:
Westmorland:
0.0% (0)
California:
8.8% (372,651)
Aggregate household income in Westmorland in 2022: $23,428,055
Median family income in Westmorland in 2022:
Westmorland:
$30,662
State:
$77,589
Number of families with income < $10k:
Westmorland:
39.0% (158)
State:
3.9% (129,468)
Number of families with income $10k - 20k:
Westmorland:
6.5% (27)
California:
4.6% (151,997)
Number of families with income $20k - 30k:
Westmorland:
9.8% (40)
State:
6.6% (216,764)
Number of families with income $30k - 40k:
Westmorland:
2.6% (11)
State:
7.6% (249,849)
Number of families with income $40k - 50k:
Westmorland:
12.9% (52)
State:
7.7% (254,822)
Number of families with income $60k - 75k:
Westmorland:
9.0% (37)
State:
10.5% (345,838)
Number of families with income $75k - 100k:
Westmorland:
9.6% (39)
State:
14.9% (491,589)
Number of families with income $100k - 125k:
Westmorland:
8.6% (35)
State:
10.7% (355,400)
Number of families with income $150k - 200k:
Westmorland:
2.0% (8)
State:
9.3% (306,566)
Median non-family income in Westmorland in 2022:
Westmorland:
$21,110
State:
$49,746
Change in median non-family income between 2000 and 2022:
Westmorland, California:
+85.9%
State:
+100.7%
Median per capita income in Westmorland in 2022:
Westmorland:
$13,307
State:
$27,240
Change in median per capita income between 2000 and 2022:
Westmorland, California:
+74.2%
California:
+133.3%
Income statistics for American Indian and Alaska Native residents
Aggregate household income in Westmorland in 2022: $502,527
Median per capita income in Westmorland in 2022:
Westmorland:
$17,007
State:
$30,289
Change in median per capita income between 2000 and 2022:
Westmorland, California:
+133.6%
California:
+98.9%
Income statistics for Multirace residents
Median household income in Westmorland, CA in 2022:
Westmorland:
$28,469
State:
$83,153
Change in median household income between 2000 and 2022:: -1.0%
Westmorland, California:
-1.0%
State:
+106.0%
Number of households with income < $10k:
Westmorland:
25.0% (36)
State:
4.2% (85,299)
Number of households with income $10k - 20k:
Westmorland:
13.9% (20)
California:
6.1% (122,966)
Number of households with income $20k - 30k:
Westmorland:
18.8% (27)
California:
6.4% (129,328)
Number of households with income $30k - 40k:
Westmorland:
0.0% (0)
State:
6.4% (130,070)
Number of households with income $40k - 50k:
Westmorland:
29.2% (42)
California:
6.5% (131,254)
Number of households with income $50k - 60k:
Westmorland:
0.0% (0)
State:
6.5% (132,382)
Number of households with income $60k - 75k:
Westmorland:
0.0% (0)
State:
9.4% (191,472)
Number of households with income $75k - 100k:
Westmorland:
0.0% (0)
State:
13.3% (269,691)
Number of households with income $100k - 125k:
Westmorland:
7.6% (11)
California:
10.2% (207,286)
Number of households with income $125k - 150k:
Westmorland:
0.0% (0)
State:
7.8% (158,259)
Number of households with income $150k - 200k:
Westmorland:
5.6% (8)
State:
10.3% (209,227)
Number of households with income > $200k:
Westmorland:
0.0% (0)
State:
13.0% (263,210)
Aggregate household income in Westmorland in 2022: $5,462,773
Median per capita income in Westmorland in 2022:
Westmorland:
$16,481
California:
$32,124
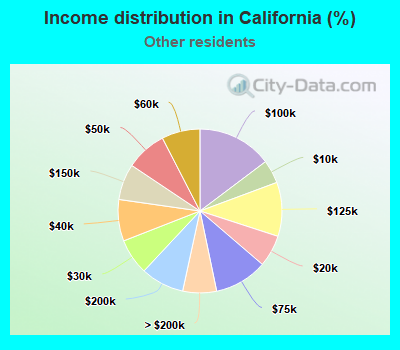
Income statistics for other residents
Median household income in Westmorland, CA in 2022:
Westmorland:
$36,139
State:
$71,383
Number of households with income < $10k:
Westmorland:
8.7% (23)
State:
4.6% (93,035)
Number of households with income $10k - 20k:
Westmorland:
15.2% (40)
State:
6.3% (126,222)
Number of households with income $20k - 30k:
Westmorland:
19.7% (52)
State:
7.1% (142,656)
Number of households with income $30k - 40k:
Westmorland:
6.4% (17)
State:
8.2% (165,018)
Number of households with income $40k - 50k:
Westmorland:
15.2% (40)
State:
8.0% (161,732)
Number of households with income $50k - 60k:
Westmorland:
0.0% (0)
California:
7.6% (152,152)
Number of households with income $60k - 75k:
Westmorland:
10.6% (28)
State:
10.4% (209,951)
Number of households with income $75k - 100k:
Westmorland:
14.4% (38)
California:
14.7% (296,102)
Number of households with income $100k - 125k:
Westmorland:
3.0% (8)
State:
10.7% (214,281)
Number of households with income $125k - 150k:
Westmorland:
0.0% (0)
State:
7.1% (143,092)
Number of households with income $150k - 200k:
Westmorland:
6.8% (18)
State:
8.6% (172,215)
Number of households with income > $200k:
Westmorland:
0.0% (0)
State:
6.7% (134,102)
Aggregate household income in Westmorland in 2022: $15,329,842
Median family income in Westmorland in 2022:
Westmorland:
$38,688
State:
$72,756
Number of families with income < $10k:
Westmorland:
19.5% (47)
California:
4.3% (69,090)
Number of families with income $10k - 20k:
Westmorland:
11.3% (27)
State:
5.1% (82,116)
Number of families with income $20k - 30k:
Westmorland:
12.2% (30)
California:
7.0% (112,854)
Number of families with income $30k - 40k:
Westmorland:
6.5% (16)
State:
8.4% (135,938)
Number of families with income $40k - 50k:
Westmorland:
16.9% (41)
State:
8.4% (135,353)
Number of families with income $60k - 75k:
Westmorland:
5.4% (13)
State:
10.7% (173,628)
Number of families with income $75k - 100k:
Westmorland:
16.3% (39)
State:
15.2% (245,724)
Number of families with income $100k - 125k:
Westmorland:
3.5% (8)
State:
10.9% (176,716)
Number of families with income $150k - 200k:
Westmorland:
8.4% (20)
California:
8.5% (137,332)
Median non-family income in Westmorland in 2022:
Westmorland:
$16,983
State:
$43,881
Change in median non-family income between 2000 and 2022:
Westmorland, California:
+72.5%
State:
+84.6%
Median per capita income in Westmorland in 2022:
Westmorland:
$12,149
State:
$25,164
Change in median per capita income between 2000 and 2022:
Westmorland, California:
+54.2%
State:
+137.9%
Discuss Westmorland, California (CA) on our hugely popular California forum.