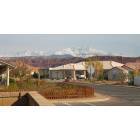
Santa Clara, Utah Submit your own pictures of this city and show them to the world
OSM Map
General Map
Google Map
MSN Map
OSM Map
General Map
Google Map
MSN Map
OSM Map
General Map
Google Map
MSN Map
OSM Map
General Map
Google Map
MSN Map
Please wait while loading the map...
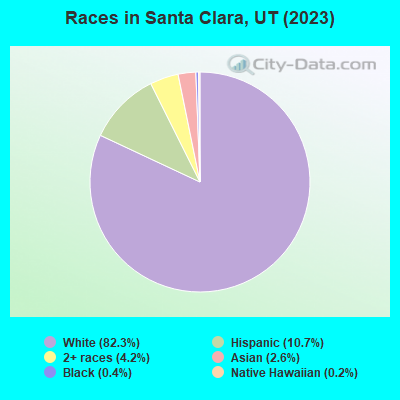
Population in 2022: 8,123 (99% urban, 1% rural). Population change since 2000: +75.4%Males: 4,177 Females: 3,946
March 2022 cost of living index in Santa Clara: 91.9 (less than average, U.S. average is 100) Percentage of residents living in poverty in 2022: 3.0%for White Non-Hispanic residents , 1.4% for Hispanic or Latino residents , 5.4% for two or more races residents )
Profiles of local businesses
Business Search - 14 Million verified businesses
Data:
Median household income ($)
Median household income (% change since 2000)
Household income diversity
Ratio of average income to average house value (%)
Ratio of average income to average rent
Median household income ($) - White
Median household income ($) - Black or African American
Median household income ($) - Asian
Median household income ($) - Hispanic or Latino
Median household income ($) - American Indian and Alaska Native
Median household income ($) - Multirace
Median household income ($) - Other Race
Median household income for houses/condos with a mortgage ($)
Median household income for apartments without a mortgage ($)
Races - White alone (%)
Races - White alone (% change since 2000)
Races - Black alone (%)
Races - Black alone (% change since 2000)
Races - American Indian alone (%)
Races - American Indian alone (% change since 2000)
Races - Asian alone (%)
Races - Asian alone (% change since 2000)
Races - Hispanic (%)
Races - Hispanic (% change since 2000)
Races - Native Hawaiian and Other Pacific Islander alone (%)
Races - Native Hawaiian and Other Pacific Islander alone (% change since 2000)
Races - Two or more races (%)
Races - Two or more races (% change since 2000)
Races - Other race alone (%)
Races - Other race alone (% change since 2000)
Racial diversity
Unemployment (%)
Unemployment (% change since 2000)
Unemployment (%) - White
Unemployment (%) - Black or African American
Unemployment (%) - Asian
Unemployment (%) - Hispanic or Latino
Unemployment (%) - American Indian and Alaska Native
Unemployment (%) - Multirace
Unemployment (%) - Other Race
Population density (people per square mile)
Population - Males (%)
Population - Females (%)
Population - Males (%) - White
Population - Males (%) - Black or African American
Population - Males (%) - Asian
Population - Males (%) - Hispanic or Latino
Population - Males (%) - American Indian and Alaska Native
Population - Males (%) - Multirace
Population - Males (%) - Other Race
Population - Females (%) - White
Population - Females (%) - Black or African American
Population - Females (%) - Asian
Population - Females (%) - Hispanic or Latino
Population - Females (%) - American Indian and Alaska Native
Population - Females (%) - Multirace
Population - Females (%) - Other Race
Coronavirus confirmed cases (Jun 12, 2024)
Deaths caused by coronavirus (Jun 12, 2024)
Coronavirus confirmed cases (per 100k population) (Jun 12, 2024)
Deaths caused by coronavirus (per 100k population) (Jun 12, 2024)
Daily increase in number of cases (Jun 12, 2024)
Weekly increase in number of cases (Jun 12, 2024)
Cases doubled (in days) (Jun 12, 2024)
Hospitalized patients (Apr 18, 2022)
Negative test results (Apr 18, 2022)
Total test results (Apr 18, 2022)
COVID Vaccine doses distributed (per 100k population) (Sep 19, 2023)
COVID Vaccine doses administered (per 100k population) (Sep 19, 2023)
COVID Vaccine doses distributed (Sep 19, 2023)
COVID Vaccine doses administered (Sep 19, 2023)
Likely homosexual households (%)
Likely homosexual households (% change since 2000)
Likely homosexual households - Lesbian couples (%)
Likely homosexual households - Lesbian couples (% change since 2000)
Likely homosexual households - Gay men (%)
Likely homosexual households - Gay men (% change since 2000)
Cost of living index
Median gross rent ($)
Median contract rent ($)
Median monthly housing costs ($)
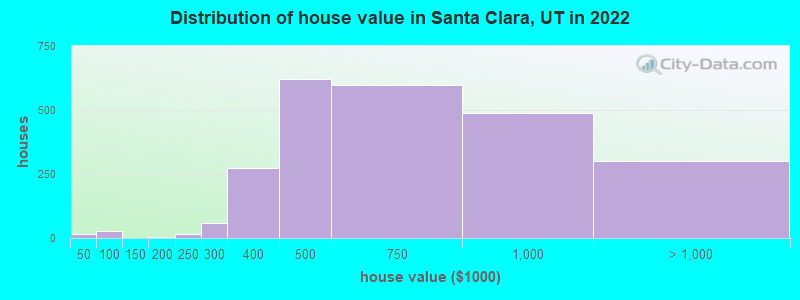
Median house or condo value ($)
Median house or condo value ($ change since 2000)
Mean house or condo value by units in structure - 1, detached ($)
Mean house or condo value by units in structure - 1, attached ($)
Mean house or condo value by units in structure - 2 ($)
Mean house or condo value by units in structure by units in structure - 3 or 4 ($)
Mean house or condo value by units in structure - 5 or more ($)
Mean house or condo value by units in structure - Boat, RV, van, etc. ($)
Mean house or condo value by units in structure - Mobile home ($)
Median house or condo value ($) - White
Median house or condo value ($) - Black or African American
Median house or condo value ($) - Asian
Median house or condo value ($) - Hispanic or Latino
Median house or condo value ($) - American Indian and Alaska Native
Median house or condo value ($) - Multirace
Median house or condo value ($) - Other Race
Median resident age
Resident age diversity
Median resident age - Males
Median resident age - Females
Median resident age - White
Median resident age - Black or African American
Median resident age - Asian
Median resident age - Hispanic or Latino
Median resident age - American Indian and Alaska Native
Median resident age - Multirace
Median resident age - Other Race
Median resident age - Males - White
Median resident age - Males - Black or African American
Median resident age - Males - Asian
Median resident age - Males - Hispanic or Latino
Median resident age - Males - American Indian and Alaska Native
Median resident age - Males - Multirace
Median resident age - Males - Other Race
Median resident age - Females - White
Median resident age - Females - Black or African American
Median resident age - Females - Asian
Median resident age - Females - Hispanic or Latino
Median resident age - Females - American Indian and Alaska Native
Median resident age - Females - Multirace
Median resident age - Females - Other Race
Commute - mean travel time to work (minutes)
Travel time to work - Less than 5 minutes (%)
Travel time to work - Less than 5 minutes (% change since 2000)
Travel time to work - 5 to 9 minutes (%)
Travel time to work - 5 to 9 minutes (% change since 2000)
Travel time to work - 10 to 19 minutes (%)
Travel time to work - 10 to 19 minutes (% change since 2000)
Travel time to work - 20 to 29 minutes (%)
Travel time to work - 20 to 29 minutes (% change since 2000)
Travel time to work - 30 to 39 minutes (%)
Travel time to work - 30 to 39 minutes (% change since 2000)
Travel time to work - 40 to 59 minutes (%)
Travel time to work - 40 to 59 minutes (% change since 2000)
Travel time to work - 60 to 89 minutes (%)
Travel time to work - 60 to 89 minutes (% change since 2000)
Travel time to work - 90 or more minutes (%)
Travel time to work - 90 or more minutes (% change since 2000)
Marital status - Never married (%)
Marital status - Now married (%)
Marital status - Separated (%)
Marital status - Widowed (%)
Marital status - Divorced (%)
Median family income ($)
Median family income (% change since 2000)
Median non-family income ($)
Median non-family income (% change since 2000)
Median per capita income ($)
Median per capita income (% change since 2000)
Median family income ($) - White
Median family income ($) - Black or African American
Median family income ($) - Asian
Median family income ($) - Hispanic or Latino
Median family income ($) - American Indian and Alaska Native
Median family income ($) - Multirace
Median family income ($) - Other Race
Median year house/condo built
Median year apartment built
Year house built - Built 2005 or later (%)
Year house built - Built 2000 to 2004 (%)
Year house built - Built 1990 to 1999 (%)
Year house built - Built 1980 to 1989 (%)
Year house built - Built 1970 to 1979 (%)
Year house built - Built 1960 to 1969 (%)
Year house built - Built 1950 to 1959 (%)
Year house built - Built 1940 to 1949 (%)
Year house built - Built 1939 or earlier (%)
Average household size
Household density (households per square mile)
Average household size - White
Average household size - Black or African American
Average household size - Asian
Average household size - Hispanic or Latino
Average household size - American Indian and Alaska Native
Average household size - Multirace
Average household size - Other Race
Occupied housing units (%)
Vacant housing units (%)
Owner occupied housing units (%)
Renter occupied housing units (%)
Vacancy status - For rent (%)
Vacancy status - For sale only (%)
Vacancy status - Rented or sold, not occupied (%)
Vacancy status - For seasonal, recreational, or occasional use (%)
Vacancy status - For migrant workers (%)
Vacancy status - Other vacant (%)
Residents with income below the poverty level (%)
Residents with income below 50% of the poverty level (%)
Children below poverty level (%)
Poor families by family type - Married-couple family (%)
Poor families by family type - Male, no wife present (%)
Poor families by family type - Female, no husband present (%)
Poverty status for native-born residents (%)
Poverty status for foreign-born residents (%)
Poverty among high school graduates not in families (%)
Poverty among people who did not graduate high school not in families (%)
Residents with income below the poverty level (%) - White
Residents with income below the poverty level (%) - Black or African American
Residents with income below the poverty level (%) - Asian
Residents with income below the poverty level (%) - Hispanic or Latino
Residents with income below the poverty level (%) - American Indian and Alaska Native
Residents with income below the poverty level (%) - Multirace
Residents with income below the poverty level (%) - Other Race
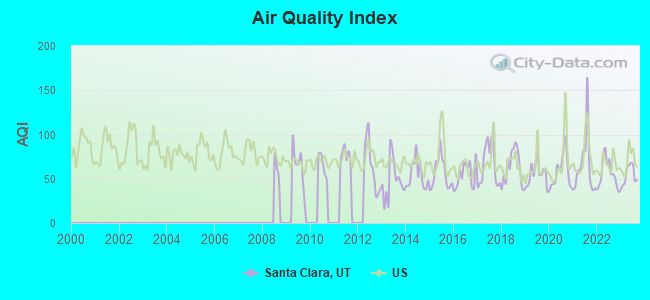
Air pollution - Air Quality Index (AQI)
Air pollution - CO
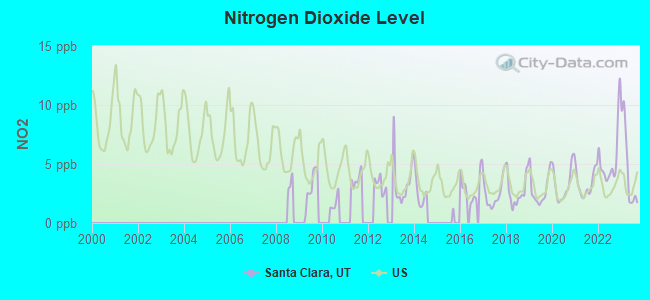
Air pollution - NO2
Air pollution - SO2
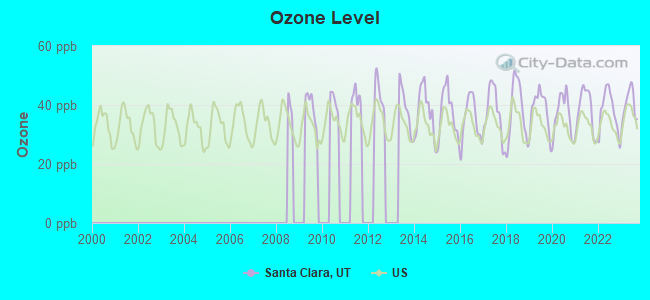
Air pollution - Ozone
Air pollution - PM10
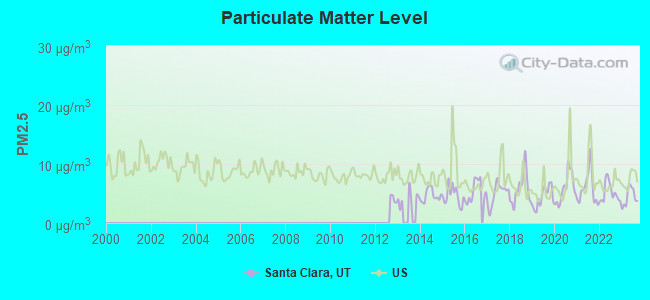
Air pollution - PM25
Air pollution - Pb
Crime - Murders per 100,000 population
Crime - Rapes per 100,000 population
Crime - Robberies per 100,000 population
Crime - Assaults per 100,000 population
Crime - Burglaries per 100,000 population
Crime - Thefts per 100,000 population
Crime - Auto thefts per 100,000 population
Crime - Arson per 100,000 population
Crime - City-data.com crime index
Crime - Violent crime index
Crime - Property crime index
Crime - Murders per 100,000 population (5 year average)
Crime - Rapes per 100,000 population (5 year average)
Crime - Robberies per 100,000 population (5 year average)
Crime - Assaults per 100,000 population (5 year average)
Crime - Burglaries per 100,000 population (5 year average)
Crime - Thefts per 100,000 population (5 year average)
Crime - Auto thefts per 100,000 population (5 year average)
Crime - Arson per 100,000 population (5 year average)
Crime - City-data.com crime index (5 year average)
Crime - Violent crime index (5 year average)
Crime - Property crime index (5 year average)
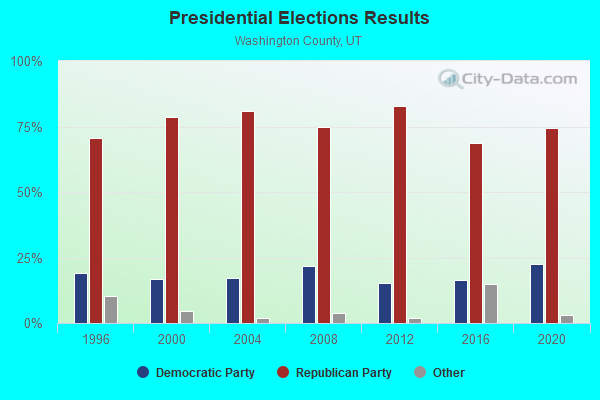
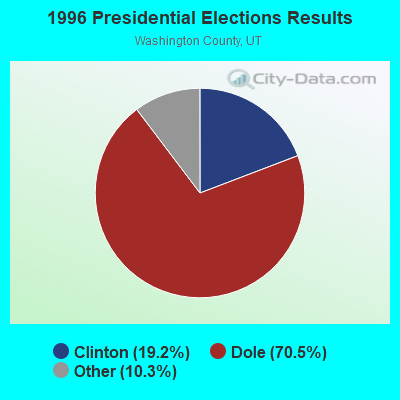
1996 Presidential Elections Results (%) - Democratic Party (Clinton)
1996 Presidential Elections Results (%) - Republican Party (Dole)
1996 Presidential Elections Results (%) - Other
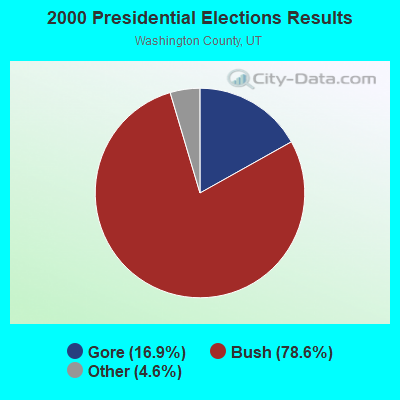
2000 Presidential Elections Results (%) - Democratic Party (Gore)
2000 Presidential Elections Results (%) - Republican Party (Bush)
2000 Presidential Elections Results (%) - Other
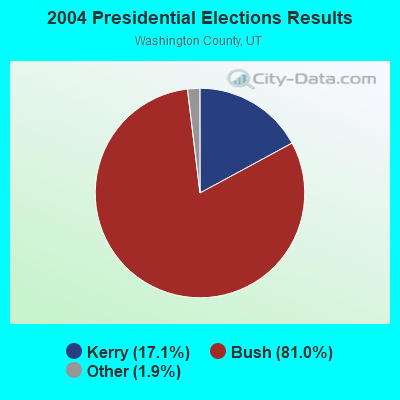
2004 Presidential Elections Results (%) - Democratic Party (Kerry)
2004 Presidential Elections Results (%) - Republican Party (Bush)
2004 Presidential Elections Results (%) - Other
2008 Presidential Elections Results (%) - Democratic Party (Obama)
2008 Presidential Elections Results (%) - Republican Party (McCain)
2008 Presidential Elections Results (%) - Other
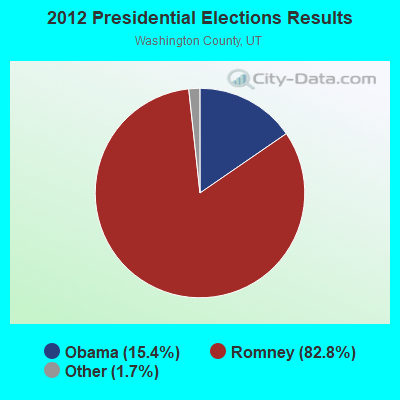
2012 Presidential Elections Results (%) - Democratic Party (Obama)
2012 Presidential Elections Results (%) - Republican Party (Romney)
2012 Presidential Elections Results (%) - Other
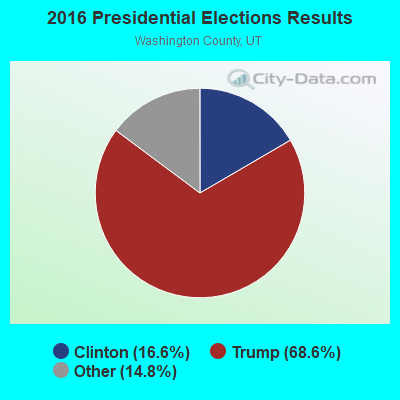
2016 Presidential Elections Results (%) - Democratic Party (Clinton)
2016 Presidential Elections Results (%) - Republican Party (Trump)
2016 Presidential Elections Results (%) - Other
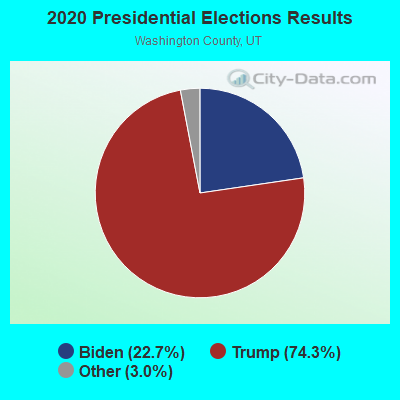
2020 Presidential Elections Results (%) - Democratic Party (Biden)
2020 Presidential Elections Results (%) - Republican Party (Trump)
2020 Presidential Elections Results (%) - Other
Ancestries Reported - Arab (%)
Ancestries Reported - Czech (%)
Ancestries Reported - Danish (%)
Ancestries Reported - Dutch (%)
Ancestries Reported - English (%)
Ancestries Reported - French (%)
Ancestries Reported - French Canadian (%)
Ancestries Reported - German (%)
Ancestries Reported - Greek (%)
Ancestries Reported - Hungarian (%)
Ancestries Reported - Irish (%)
Ancestries Reported - Italian (%)
Ancestries Reported - Lithuanian (%)
Ancestries Reported - Norwegian (%)
Ancestries Reported - Polish (%)
Ancestries Reported - Portuguese (%)
Ancestries Reported - Russian (%)
Ancestries Reported - Scotch-Irish (%)
Ancestries Reported - Scottish (%)
Ancestries Reported - Slovak (%)
Ancestries Reported - Subsaharan African (%)
Ancestries Reported - Swedish (%)
Ancestries Reported - Swiss (%)
Ancestries Reported - Ukrainian (%)
Ancestries Reported - United States (%)
Ancestries Reported - Welsh (%)
Ancestries Reported - West Indian (%)
Ancestries Reported - Other (%)
Educational Attainment - No schooling completed (%)
Educational Attainment - Less than high school (%)
Educational Attainment - High school or equivalent (%)
Educational Attainment - Less than 1 year of college (%)
Educational Attainment - 1 or more years of college (%)
Educational Attainment - Associate degree (%)
Educational Attainment - Bachelor's degree (%)
Educational Attainment - Master's degree (%)
Educational Attainment - Professional school degree (%)
Educational Attainment - Doctorate degree (%)
School Enrollment - Nursery, preschool (%)
School Enrollment - Kindergarten (%)
School Enrollment - Grade 1 to 4 (%)
School Enrollment - Grade 5 to 8 (%)
School Enrollment - Grade 9 to 12 (%)
School Enrollment - College undergrad (%)
School Enrollment - Graduate or professional (%)
School Enrollment - Not enrolled in school (%)
School enrollment - Public schools (%)
School enrollment - Private schools (%)
School enrollment - Not enrolled (%)
Median number of rooms in houses and condos
Median number of rooms in apartments
Housing units lacking complete plumbing facilities (%)
Housing units lacking complete kitchen facilities (%)
Density of houses
Urban houses (%)
Rural houses (%)
Households with people 60 years and over (%)
Households with people 65 years and over (%)
Households with people 75 years and over (%)
Households with one or more nonrelatives (%)
Households with no nonrelatives (%)
Population in households (%)
Family households (%)
Nonfamily households (%)
Population in families (%)
Family households with own children (%)
Median number of bedrooms in owner occupied houses
Mean number of bedrooms in owner occupied houses
Median number of bedrooms in renter occupied houses
Mean number of bedrooms in renter occupied houses
Median number of vehichles in owner occupied houses
Mean number of vehichles in owner occupied houses
Median number of vehichles in renter occupied houses
Mean number of vehichles in renter occupied houses
Mortgage status - with mortgage (%)
Mortgage status - with second mortgage (%)
Mortgage status - with home equity loan (%)
Mortgage status - with both second mortgage and home equity loan (%)
Mortgage status - without a mortgage (%)
Average family size
Average family size - White
Average family size - Black or African American
Average family size - Asian
Average family size - Hispanic or Latino
Average family size - American Indian and Alaska Native
Average family size - Multirace
Average family size - Other Race
Geographical mobility - Same house 1 year ago (%)
Geographical mobility - Moved within same county (%)
Geographical mobility - Moved from different county within same state (%)
Geographical mobility - Moved from different state (%)
Geographical mobility - Moved from abroad (%)
Place of birth - Born in state of residence (%)
Place of birth - Born in other state (%)
Place of birth - Native, outside of US (%)
Place of birth - Foreign born (%)
Housing units in structures - 1, detached (%)
Housing units in structures - 1, attached (%)
Housing units in structures - 2 (%)
Housing units in structures - 3 or 4 (%)
Housing units in structures - 5 to 9 (%)
Housing units in structures - 10 to 19 (%)
Housing units in structures - 20 to 49 (%)
Housing units in structures - 50 or more (%)
Housing units in structures - Mobile home (%)
Housing units in structures - Boat, RV, van, etc. (%)
House/condo owner moved in on average (years ago)
Renter moved in on average (years ago)
Year householder moved into unit - Moved in 1999 to March 2000 (%)
Year householder moved into unit - Moved in 1995 to 1998 (%)
Year householder moved into unit - Moved in 1990 to 1994 (%)
Year householder moved into unit - Moved in 1980 to 1989 (%)
Year householder moved into unit - Moved in 1970 to 1979 (%)
Year householder moved into unit - Moved in 1969 or earlier (%)
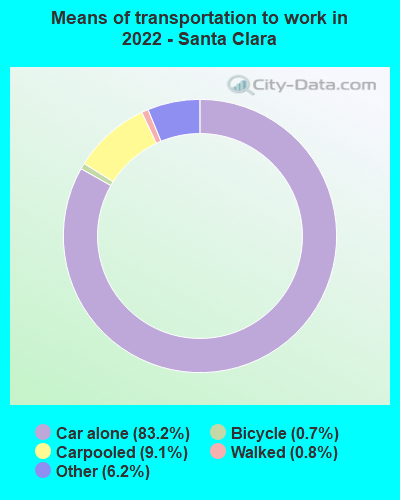
Means of transportation to work - Drove car alone (%)
Means of transportation to work - Carpooled (%)
Means of transportation to work - Public transportation (%)
Means of transportation to work - Bus or trolley bus (%)
Means of transportation to work - Streetcar or trolley car (%)
Means of transportation to work - Subway or elevated (%)
Means of transportation to work - Railroad (%)
Means of transportation to work - Ferryboat (%)
Means of transportation to work - Taxicab (%)
Means of transportation to work - Motorcycle (%)
Means of transportation to work - Bicycle (%)
Means of transportation to work - Walked (%)
Means of transportation to work - Other means (%)
Working at home (%)
Industry diversity
Most Common Industries - Agriculture, forestry, fishing and hunting, and mining (%)
Most Common Industries - Agriculture, forestry, fishing and hunting (%)
Most Common Industries - Mining, quarrying, and oil and gas extraction (%)
Most Common Industries - Construction (%)
Most Common Industries - Manufacturing (%)
Most Common Industries - Wholesale trade (%)
Most Common Industries - Retail trade (%)
Most Common Industries - Transportation and warehousing, and utilities (%)
Most Common Industries - Transportation and warehousing (%)
Most Common Industries - Utilities (%)
Most Common Industries - Information (%)
Most Common Industries - Finance and insurance, and real estate and rental and leasing (%)
Most Common Industries - Finance and insurance (%)
Most Common Industries - Real estate and rental and leasing (%)
Most Common Industries - Professional, scientific, and management, and administrative and waste management services (%)
Most Common Industries - Professional, scientific, and technical services (%)
Most Common Industries - Management of companies and enterprises (%)
Most Common Industries - Administrative and support and waste management services (%)
Most Common Industries - Educational services, and health care and social assistance (%)
Most Common Industries - Educational services (%)
Most Common Industries - Health care and social assistance (%)
Most Common Industries - Arts, entertainment, and recreation, and accommodation and food services (%)
Most Common Industries - Arts, entertainment, and recreation (%)
Most Common Industries - Accommodation and food services (%)
Most Common Industries - Other services, except public administration (%)
Most Common Industries - Public administration (%)
Occupation diversity
Most Common Occupations - Management, business, science, and arts occupations (%)
Most Common Occupations - Management, business, and financial occupations (%)
Most Common Occupations - Management occupations (%)
Most Common Occupations - Business and financial operations occupations (%)
Most Common Occupations - Computer, engineering, and science occupations (%)
Most Common Occupations - Computer and mathematical occupations (%)
Most Common Occupations - Architecture and engineering occupations (%)
Most Common Occupations - Life, physical, and social science occupations (%)
Most Common Occupations - Education, legal, community service, arts, and media occupations (%)
Most Common Occupations - Community and social service occupations (%)
Most Common Occupations - Legal occupations (%)
Most Common Occupations - Education, training, and library occupations (%)
Most Common Occupations - Arts, design, entertainment, sports, and media occupations (%)
Most Common Occupations - Healthcare practitioners and technical occupations (%)
Most Common Occupations - Health diagnosing and treating practitioners and other technical occupations (%)
Most Common Occupations - Health technologists and technicians (%)
Most Common Occupations - Service occupations (%)
Most Common Occupations - Healthcare support occupations (%)
Most Common Occupations - Protective service occupations (%)
Most Common Occupations - Fire fighting and prevention, and other protective service workers including supervisors (%)
Most Common Occupations - Law enforcement workers including supervisors (%)
Most Common Occupations - Food preparation and serving related occupations (%)
Most Common Occupations - Building and grounds cleaning and maintenance occupations (%)
Most Common Occupations - Personal care and service occupations (%)
Most Common Occupations - Sales and office occupations (%)
Most Common Occupations - Sales and related occupations (%)
Most Common Occupations - Office and administrative support occupations (%)
Most Common Occupations - Natural resources, construction, and maintenance occupations (%)
Most Common Occupations - Farming, fishing, and forestry occupations (%)
Most Common Occupations - Construction and extraction occupations (%)
Most Common Occupations - Installation, maintenance, and repair occupations (%)
Most Common Occupations - Production, transportation, and material moving occupations (%)
Most Common Occupations - Production occupations (%)
Most Common Occupations - Transportation occupations (%)
Most Common Occupations - Material moving occupations (%)
People in Group quarters - Institutionalized population (%)
People in Group quarters - Correctional institutions (%)
People in Group quarters - Federal prisons and detention centers (%)
People in Group quarters - Halfway houses (%)
People in Group quarters - Local jails and other confinement facilities (including police lockups) (%)
People in Group quarters - Military disciplinary barracks (%)
People in Group quarters - State prisons (%)
People in Group quarters - Other types of correctional institutions (%)
People in Group quarters - Nursing homes (%)
People in Group quarters - Hospitals/wards, hospices, and schools for the handicapped (%)
People in Group quarters - Hospitals/wards and hospices for chronically ill (%)
People in Group quarters - Hospices or homes for chronically ill (%)
People in Group quarters - Military hospitals or wards for chronically ill (%)
People in Group quarters - Other hospitals or wards for chronically ill (%)
People in Group quarters - Hospitals or wards for drug/alcohol abuse (%)
People in Group quarters - Mental (Psychiatric) hospitals or wards (%)
People in Group quarters - Schools, hospitals, or wards for the mentally retarded (%)
People in Group quarters - Schools, hospitals, or wards for the physically handicapped (%)
People in Group quarters - Institutions for the deaf (%)
People in Group quarters - Institutions for the blind (%)
People in Group quarters - Orthopedic wards and institutions for the physically handicapped (%)
People in Group quarters - Wards in general hospitals for patients who have no usual home elsewhere (%)
People in Group quarters - Wards in military hospitals for patients who have no usual home elsewhere (%)
People in Group quarters - Juvenile institutions (%)
People in Group quarters - Long-term care (%)
People in Group quarters - Homes for abused, dependent, and neglected children (%)
People in Group quarters - Residential treatment centers for emotionally disturbed children (%)
People in Group quarters - Training schools for juvenile delinquents (%)
People in Group quarters - Short-term care, detention or diagnostic centers for delinquent children (%)
People in Group quarters - Type of juvenile institution unknown (%)
People in Group quarters - Noninstitutionalized population (%)
People in Group quarters - College dormitories (includes college quarters off campus) (%)
People in Group quarters - Military quarters (%)
People in Group quarters - On base (%)
People in Group quarters - Barracks, unaccompanied personnel housing (UPH), (Enlisted/Officer), ;and similar group living quarters for military personnel (%)
People in Group quarters - Transient quarters for temporary residents (%)
People in Group quarters - Military ships (%)
People in Group quarters - Group homes (%)
People in Group quarters - Homes or halfway houses for drug/alcohol abuse (%)
People in Group quarters - Homes for the mentally ill (%)
People in Group quarters - Homes for the mentally retarded (%)
People in Group quarters - Homes for the physically handicapped (%)
People in Group quarters - Other group homes (%)
People in Group quarters - Religious group quarters (%)
People in Group quarters - Dormitories (%)
People in Group quarters - Agriculture workers' dormitories on farms (%)
People in Group quarters - Job Corps and vocational training facilities (%)
People in Group quarters - Other workers' dormitories (%)
People in Group quarters - Crews of maritime vessels (%)
People in Group quarters - Other nonhousehold living situations (%)
People in Group quarters - Other noninstitutional group quarters (%)
Residents speaking English at home (%)
Residents speaking English at home - Born in the United States (%)
Residents speaking English at home - Native, born elsewhere (%)
Residents speaking English at home - Foreign born (%)
Residents speaking Spanish at home (%)
Residents speaking Spanish at home - Born in the United States (%)
Residents speaking Spanish at home - Native, born elsewhere (%)
Residents speaking Spanish at home - Foreign born (%)
Residents speaking other language at home (%)
Residents speaking other language at home - Born in the United States (%)
Residents speaking other language at home - Native, born elsewhere (%)
Residents speaking other language at home - Foreign born (%)
Class of Workers - Employee of private company (%)
Class of Workers - Self-employed in own incorporated business (%)
Class of Workers - Private not-for-profit wage and salary workers (%)
Class of Workers - Local government workers (%)
Class of Workers - State government workers (%)
Class of Workers - Federal government workers (%)
Class of Workers - Self-employed workers in own not incorporated business and Unpaid family workers (%)
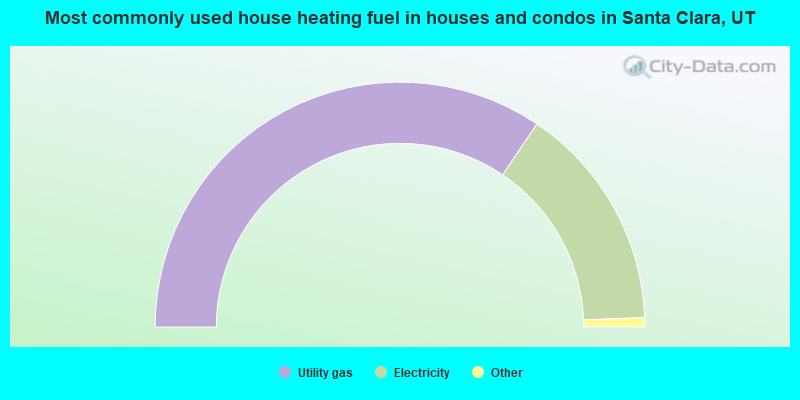
House heating fuel used in houses and condos - Utility gas (%)
House heating fuel used in houses and condos - Bottled, tank, or LP gas (%)
House heating fuel used in houses and condos - Electricity (%)
House heating fuel used in houses and condos - Fuel oil, kerosene, etc. (%)
House heating fuel used in houses and condos - Coal or coke (%)
House heating fuel used in houses and condos - Wood (%)
House heating fuel used in houses and condos - Solar energy (%)
House heating fuel used in houses and condos - Other fuel (%)
House heating fuel used in houses and condos - No fuel used (%)
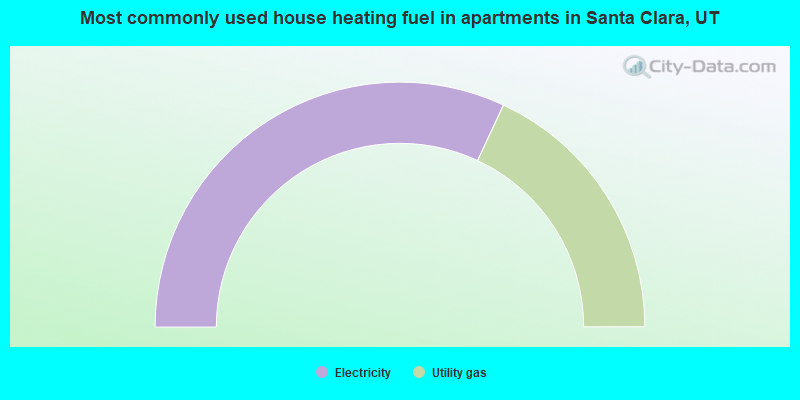
House heating fuel used in apartments - Utility gas (%)
House heating fuel used in apartments - Bottled, tank, or LP gas (%)
House heating fuel used in apartments - Electricity (%)
House heating fuel used in apartments - Fuel oil, kerosene, etc. (%)
House heating fuel used in apartments - Coal or coke (%)
House heating fuel used in apartments - Wood (%)
House heating fuel used in apartments - Solar energy (%)
House heating fuel used in apartments - Other fuel (%)
House heating fuel used in apartments - No fuel used (%)
Armed forces status - In Armed Forces (%)
Armed forces status - Civilian (%)
Armed forces status - Civilian - Veteran (%)
Armed forces status - Civilian - Nonveteran (%)
Fatal accidents locations in years 2005-2021
Fatal accidents locations in 2005
Fatal accidents locations in 2006
Fatal accidents locations in 2007
Fatal accidents locations in 2008
Fatal accidents locations in 2009
Fatal accidents locations in 2010
Fatal accidents locations in 2011
Fatal accidents locations in 2012
Fatal accidents locations in 2013
Fatal accidents locations in 2014
Fatal accidents locations in 2015
Fatal accidents locations in 2016
Fatal accidents locations in 2017
Fatal accidents locations in 2018
Fatal accidents locations in 2019
Fatal accidents locations in 2020
Fatal accidents locations in 2021
Alcohol use - People drinking some alcohol every month (%)
Alcohol use - People not drinking at all (%)
Alcohol use - Average days/month drinking alcohol
Alcohol use - Average drinks/week
Alcohol use - Average days/year people drink much
Audiometry - Average condition of hearing (%)
Audiometry - People that can hear a whisper from across a quiet room (%)
Audiometry - People that can hear normal voice from across a quiet room (%)
Audiometry - Ears ringing, roaring, buzzing (%)
Audiometry - Had a job exposure to loud noise (%)
Audiometry - Had off-work exposure to loud noise (%)
Blood Pressure & Cholesterol - Has high blood pressure (%)
Blood Pressure & Cholesterol - Checking blood pressure at home (%)
Blood Pressure & Cholesterol - Frequently checking blood cholesterol (%)
Blood Pressure & Cholesterol - Has high cholesterol level (%)
Consumer Behavior - Money monthly spent on food at supermarket/grocery store
Consumer Behavior - Money monthly spent on food at other stores
Consumer Behavior - Money monthly spent on eating out
Consumer Behavior - Money monthly spent on carryout/delivered foods
Consumer Behavior - Income spent on food at supermarket/grocery store (%)
Consumer Behavior - Income spent on food at other stores (%)
Consumer Behavior - Income spent on eating out (%)
Consumer Behavior - Income spent on carryout/delivered foods (%)
Current Health Status - General health condition (%)
Current Health Status - Blood donors (%)
Current Health Status - Has blood ever tested for HIV virus (%)
Current Health Status - Left-handed people (%)
Dermatology - People using sunscreen (%)
Diabetes - Diabetics (%)
Diabetes - Had a blood test for high blood sugar (%)
Diabetes - People taking insulin (%)
Diet Behavior & Nutrition - Diet health (%)
Diet Behavior & Nutrition - Milk product consumption (# of products/month)
Diet Behavior & Nutrition - Meals not home prepared (#/week)
Diet Behavior & Nutrition - Meals from fast food or pizza place (#/week)
Diet Behavior & Nutrition - Ready-to-eat foods (#/month)
Diet Behavior & Nutrition - Frozen meals/pizza (#/month)
Drug Use - People that ever used marijuana or hashish (%)
Drug Use - Ever used hard drugs (%)
Drug Use - Ever used any form of cocaine (%)
Drug Use - Ever used heroin (%)
Drug Use - Ever used methamphetamine (%)
Health Insurance - People covered by health insurance (%)
Kidney Conditions-Urology - Avg. # of times urinating at night
Medical Conditions - People with asthma (%)
Medical Conditions - People with anemia (%)
Medical Conditions - People with psoriasis (%)
Medical Conditions - People with overweight (%)
Medical Conditions - Elderly people having difficulties in thinking or remembering (%)
Medical Conditions - People who ever received blood transfusion (%)
Medical Conditions - People having trouble seeing even with glass/contacts (%)
Medical Conditions - People with arthritis (%)
Medical Conditions - People with gout (%)
Medical Conditions - People with congestive heart failure (%)
Medical Conditions - People with coronary heart disease (%)
Medical Conditions - People with angina pectoris (%)
Medical Conditions - People who ever had heart attack (%)
Medical Conditions - People who ever had stroke (%)
Medical Conditions - People with emphysema (%)
Medical Conditions - People with thyroid problem (%)
Medical Conditions - People with chronic bronchitis (%)
Medical Conditions - People with any liver condition (%)
Medical Conditions - People who ever had cancer or malignancy (%)
Mental Health - People who have little interest in doing things (%)
Mental Health - People feeling down, depressed, or hopeless (%)
Mental Health - People who have trouble sleeping or sleeping too much (%)
Mental Health - People feeling tired or having little energy (%)
Mental Health - People with poor appetite or overeating (%)
Mental Health - People feeling bad about themself (%)
Mental Health - People who have trouble concentrating on things (%)
Mental Health - People moving or speaking slowly or too fast (%)
Mental Health - People having thoughts they would be better off dead (%)
Oral Health - Average years since last visit a dentist
Oral Health - People embarrassed because of mouth (%)
Oral Health - People with gum disease (%)
Oral Health - General health of teeth and gums (%)
Oral Health - Average days a week using dental floss/device
Oral Health - Average days a week using mouthwash for dental problem
Oral Health - Average number of teeth
Pesticide Use - Households using pesticides to control insects (%)
Pesticide Use - Households using pesticides to kill weeds (%)
Physical Activity - People doing vigorous-intensity work activities (%)
Physical Activity - People doing moderate-intensity work activities (%)
Physical Activity - People walking or bicycling (%)
Physical Activity - People doing vigorous-intensity recreational activities (%)
Physical Activity - People doing moderate-intensity recreational activities (%)
Physical Activity - Average hours a day doing sedentary activities
Physical Activity - Average hours a day watching TV or videos
Physical Activity - Average hours a day using computer
Physical Functioning - People having limitations keeping them from working (%)
Physical Functioning - People limited in amount of work they can do (%)
Physical Functioning - People that need special equipment to walk (%)
Physical Functioning - People experiencing confusion/memory problems (%)
Physical Functioning - People requiring special healthcare equipment (%)
Prescription Medications - Average number of prescription medicines taking
Preventive Aspirin Use - Adults 40+ taking low-dose aspirin (%)
Reproductive Health - Vaginal deliveries (%)
Reproductive Health - Cesarean deliveries (%)
Reproductive Health - Deliveries resulted in a live birth (%)
Reproductive Health - Pregnancies resulted in a delivery (%)
Reproductive Health - Women breastfeeding newborns (%)
Reproductive Health - Women that had a hysterectomy (%)
Reproductive Health - Women that had both ovaries removed (%)
Reproductive Health - Women that have ever taken birth control pills (%)
Reproductive Health - Women taking birth control pills (%)
Reproductive Health - Women that have ever used Depo-Provera or injectables (%)
Reproductive Health - Women that have ever used female hormones (%)
Sexual Behavior - People 18+ that ever had sex (vaginal, anal, or oral) (%)
Sexual Behavior - Males 18+ that ever had vaginal sex with a woman (%)
Sexual Behavior - Males 18+ that ever performed oral sex on a woman (%)
Sexual Behavior - Males 18+ that ever had anal sex with a woman (%)
Sexual Behavior - Males 18+ that ever had any sex with a man (%)
Sexual Behavior - Females 18+ that ever had vaginal sex with a man (%)
Sexual Behavior - Females 18+ that ever performed oral sex on a man (%)
Sexual Behavior - Females 18+ that ever had anal sex with a man (%)
Sexual Behavior - Females 18+ that ever had any kind of sex with a woman (%)
Sexual Behavior - Average age people first had sex
Sexual Behavior - Average number of female sex partners in lifetime (males 18+)
Sexual Behavior - Average number of female vaginal sex partners in lifetime (males 18+)
Sexual Behavior - Average age people first performed oral sex on a woman (18+)
Sexual Behavior - Average number of woman performed oral sex on in lifetime (18+)
Sexual Behavior - Average number of male sex partners in lifetime (males 18+)
Sexual Behavior - Average number of male anal sex partners in lifetime (males 18+)
Sexual Behavior - Average age people first performed oral sex on a man (18+)
Sexual Behavior - Average number of male oral sex partners in lifetime (18+)
Sexual Behavior - People using protection when performing oral sex (%)
Sexual Behavior - Average number of times people have vaginal or anal sex a year
Sexual Behavior - People having sex without condom (%)
Sexual Behavior - Average number of male sex partners in lifetime (females 18+)
Sexual Behavior - Average number of male vaginal sex partners in lifetime (females 18+)
Sexual Behavior - Average number of female sex partners in lifetime (females 18+)
Sexual Behavior - Circumcised males 18+ (%)
Sleep Disorders - Average hours sleeping at night
Sleep Disorders - People that has trouble sleeping (%)
Smoking-Cigarette Use - People smoking cigarettes (%)
Taste & Smell - People 40+ having problems with smell (%)
Taste & Smell - People 40+ having problems with taste (%)
Taste & Smell - People 40+ that ever had wisdom teeth removed (%)
Taste & Smell - People 40+ that ever had tonsils teeth removed (%)
Taste & Smell - People 40+ that ever had a loss of consciousness because of a head injury (%)
Taste & Smell - People 40+ that ever had a broken nose or other serious injury to face or skull (%)
Taste & Smell - People 40+ that ever had two or more sinus infections (%)
Weight - Average height (inches)
Weight - Average weight (pounds)
Weight - Average BMI
Weight - People that are obese (%)
Weight - People that ever were obese (%)
Weight - People trying to lose weight (%)
According to our research of Utah and other state lists, there were 7 registered sex offenders living in Santa Clara, Utah as of June 12, 2024 . The ratio of all residents to sex offenders in Santa Clara is 1,010 to 1.The ratio of registered sex offenders to all residents in this city is much lower than the state average.
Latest news from Santa Clara, UT collected exclusively by city-data.com from local newspapers, TV, and radio stations
Ancestries: English (28.2%), American (9.6%), European (6.4%), German (5.2%), Swiss (4.0%), Swedish (3.2%).
Current Local Time:
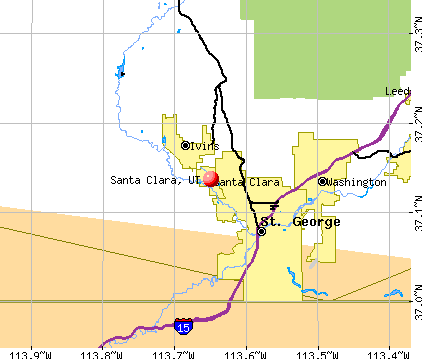
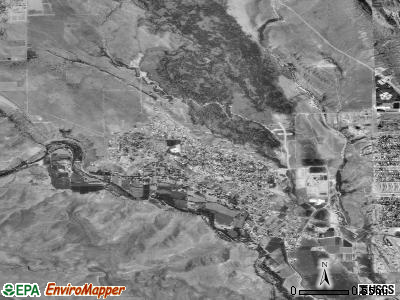
Land area: 4.88 square miles.
Population density: 1,663 people per square mile (low).
427 residents are foreign born (2.8% Latin America , 0.7% Asia , 0.7% Europe ).
Median real estate property taxes paid for housing units with mortgages in 2022: $2,247 (0.4%)Median real estate property taxes paid for housing units with no mortgage in 2022: $1,924 (0.3%)
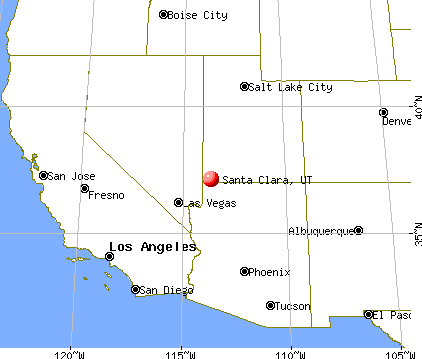
Nearest city with pop. 50,000+: Sunrise Manor, NV
Nearest city with pop. 200,000+: Las Vegas, NV
Nearest city with pop. 1,000,000+: Phoenix, AZ
Nearest cities:
Pine Valley, UT (4.4 miles)
Latitude: 37.14 N, Longitude: 113.65 W
Area code commonly used in this area: 435
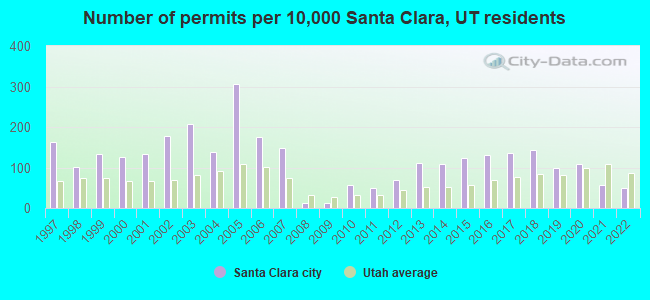
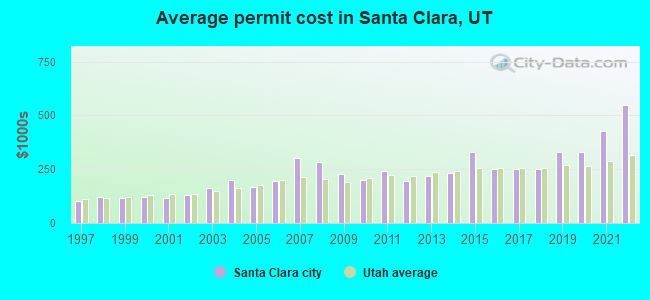
Single-family new house construction building permits:
2022: 23 buildings , average cost: $548,2002021: 26 buildings , average cost: $425,3002020: 50 buildings , average cost: $330,7002019: 46 buildings , average cost: $330,7002018: 66 buildings , average cost: $248,9002017: 63 buildings , average cost: $248,9002016: 60 buildings , average cost: $248,9002015: 57 buildings , average cost: $328,3002014: 50 buildings , average cost: $233,1002013: 52 buildings , average cost: $216,0002012: 32 buildings , average cost: $196,1002011: 23 buildings , average cost: $242,0002010: 26 buildings , average cost: $199,9002009: 6 buildings , average cost: $226,7002008: 6 buildings , average cost: $282,1002007: 69 buildings , average cost: $302,3002006: 81 buildings , average cost: $194,8002005: 141 buildings , average cost: $168,7002004: 64 buildings , average cost: $201,5002003: 96 buildings , average cost: $160,5002002: 82 buildings , average cost: $131,6002001: 62 buildings , average cost: $114,1002000: 58 buildings , average cost: $118,6001999: 62 buildings , average cost: $114,4001998: 47 buildings , average cost: $120,3001997: 76 buildings , average cost: $104,000Unemployment in December 2023: Population change in the 1990s: +2,278 (+96.9%).
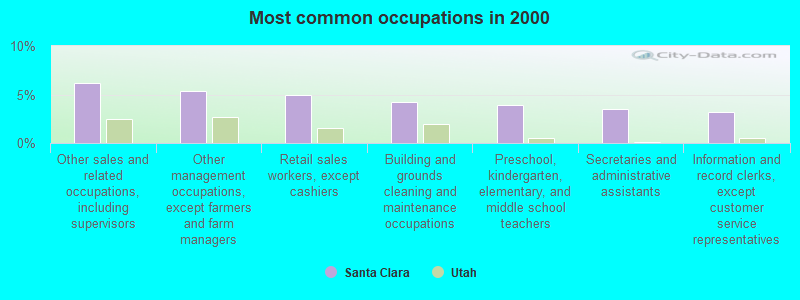
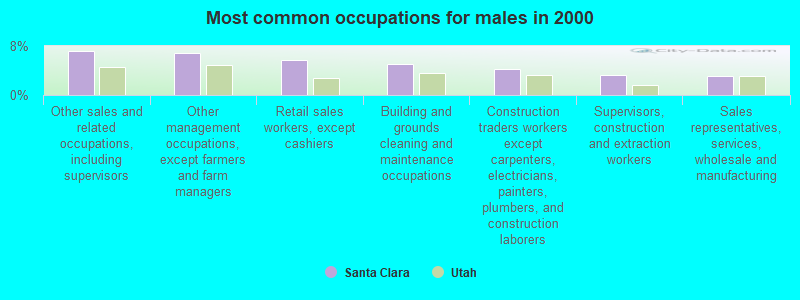
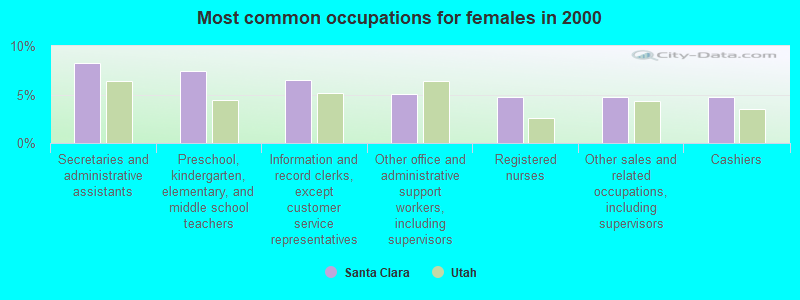
Most common occupations in Santa Clara, UT (%)
Both Males Females
Other sales and related occupations, including supervisors (6.2%)
Other management occupations, except farmers and farm managers (5.3%)
Retail sales workers, except cashiers (4.9%)
Building and grounds cleaning and maintenance occupations (4.2%)
Preschool, kindergarten, elementary, and middle school teachers (3.9%)
Secretaries and administrative assistants (3.6%)
Information and record clerks, except customer service representatives (3.2%)
Other sales and related occupations, including supervisors (7.2%)
Other management occupations, except farmers and farm managers (6.8%)
Retail sales workers, except cashiers (5.6%)
Building and grounds cleaning and maintenance occupations (5.0%)
Construction traders workers except carpenters, electricians, painters, plumbers, and construction laborers (4.2%)
Supervisors, construction and extraction workers (3.2%)
Sales representatives, services, wholesale and manufacturing (3.1%)
Secretaries and administrative assistants (8.3%)
Preschool, kindergarten, elementary, and middle school teachers (7.4%)
Information and record clerks, except customer service representatives (6.5%)
Other office and administrative support workers, including supervisors (5.0%)
Registered nurses (4.8%)
Other sales and related occupations, including supervisors (4.8%)
Cashiers (4.8%)
Earthquake activity:
Santa Clara-area historical earthquake activity is significantly above Utah state average. It is 4259% greater than the overall U.S. average. On 6/28/1992 at 11:57:34, a magnitude 7.6 (6.2 MB, 7.6 MS, 7.3 MW, Depth: 0.7 mi, Class: Major, Intensity: VIII - XII) earthquake occurred 260.7 miles away from the city center, causing 3 deaths ( 1 shaking deaths, 2 other deaths) and 400 injuries, causing $100,000,000 total damage and $40,000,000 insured lossesOn 10/16/1999 at 09:46:44, a magnitude 7.4 (6.3 MB, 7.4 MS, 7.2 MW, 7.3 ML) earthquake occurred 239.3 miles away from Santa Clara center On 10/3/1915 at 06:52:48, a magnitude 7.6 (7.6 UK) earthquake occurred 311.7 miles away from the city center On 7/21/1952 at 11:52:14, a magnitude 7.7 (7.7 UK) earthquake occurred 333.6 miles away from Santa Clara center, causing $50,000,000 total damage On 12/21/1932 at 06:10:09, a magnitude 7.2 (7.2 UK) earthquake occurred 260.2 miles away from Santa Clara center On 5/19/1940 at 04:36:40, a magnitude 7.2 (7.2 UK) earthquake occurred 294.5 miles away from the city center, causing $33,000,000 total damage Magnitude types: body-wave magnitude (MB), local magnitude (ML), surface-wave magnitude (MS), moment magnitude (MW) Natural disasters: The number of natural disasters in Washington County (10) is smaller than the US average (15).Major Disasters (Presidential) Declared: 4Emergencies Declared: 2Fires: 3, Floods: 3, Storms: 2, Drought: 1, Flash Flood: 1, Hurricane: 1, Winter Storm: 1, Other: 1 (Note: some incidents may be assigned to more than one category). Hospitals and medical centers near Santa Clara: ZIONS WAY HOME HEALTH (Home Health Center, about 2 miles away; ST GEORGE, UT)
PORTERS NURSING HOME (Nursing Home, about 4 miles away; SAINT GEORGE, UT)
SEASONS HEALTH AND REHABILITATION (Nursing Home, about 4 miles away; ST GEORGE, UT)
SOUTHERN HOSPITALITY LIVING CENTER (Nursing Home, about 5 miles away; ST GEORGE, UT)
LIBERTY DIALYSIS - ST GEORGE (Dialysis Facility, about 5 miles away; SAINT GEORGE, UT)
TRI-CORP HOME HEALTH CARE INC (Home Health Center, about 6 miles away; ST GEORGE, UT)
SOUTHERN UTAH HOME CARE (Home Health Center, about 6 miles away; ST GEORGE, UT)
Colleges/universities with over 2000 students nearest to Santa Clara:
Dixie State University (about 6 miles; Saint George, UT ; Full-time enrollment: 6,485)
Southern Utah University (about 49 miles; Cedar City, UT ; FT enrollment: 6,522)
Nevada State College (about 108 miles; Henderson, NV ; FT enrollment: 2,346)
University of Nevada-Las Vegas (about 110 miles; Las Vegas, NV ; FT enrollment: 21,153)
College of Southern Nevada (about 111 miles; Las Vegas, NV ; FT enrollment: 18,996)
Mohave Community College (about 131 miles; Kingman, AZ ; FT enrollment: 3,309)
Northern Arizona University (about 176 miles; Flagstaff, AZ ; FT enrollment: 22,494)
Public elementary/middle schools in Santa Clara:
See full list of schools located in Santa Clara Washington County has a predicted average indoor radon screening level between 2 and 4 pCi/L (pico curies per liter) - Moderate Potential Drinking water stations with addresses in Santa Clara and their reported violations in the past:
SANTA CLARA CITY (Population served: 8,000, Purch surface water):
Past monitoring violations:
Monitoring and Reporting (DBP) - Between JUL-2013 and SEP-2013, Contaminant: Chlorine. Follow-up actions: St Formal NOV issued (JAN-19-2014), St Public Notif requested (JAN-19-2014)
One minor monitoring violation
66 regular monitoring violations
Average household size: This city:
3.5 peopleUtah:
3.1 people
Percentage of family households: This city:
90.2%Whole state:
75.2%
Percentage of households with unmarried partners: This city:
1.8%Whole state:
4.6%
Likely homosexual households (counted as self-reported same-sex unmarried-partner households)
Lesbian couples: 0.1% of all households Gay men: 0.1% of all households
Banks with branches in Santa Clara (2011 data):
State Bank of Southern Utah: Santa Clara Branch at 2287 Santa Clara Drive, branch established on 1997/02/10. Info updated 2006/11/03: Bank assets: $674.3 mil, Deposits: $573.2 mil, headquarters in Cedar City, UT, positive income , Commercial Lending Specialization, 13 total offices , Holding Company: Southern Utah Bancorporation
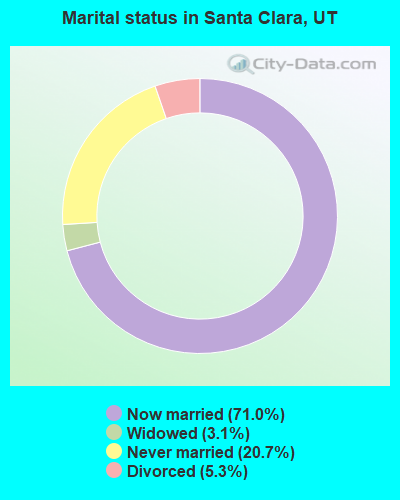
For population 15 years and over in Santa Clara:
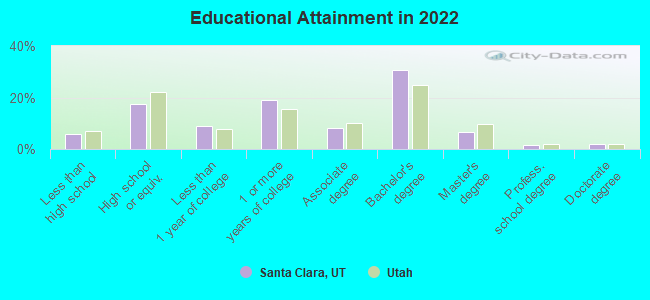
Never married: 20.7%Now married: 71.0%Separated: 0.0%Widowed: 3.1%Divorced: 5.3% For population 25 years and over in Santa Clara:
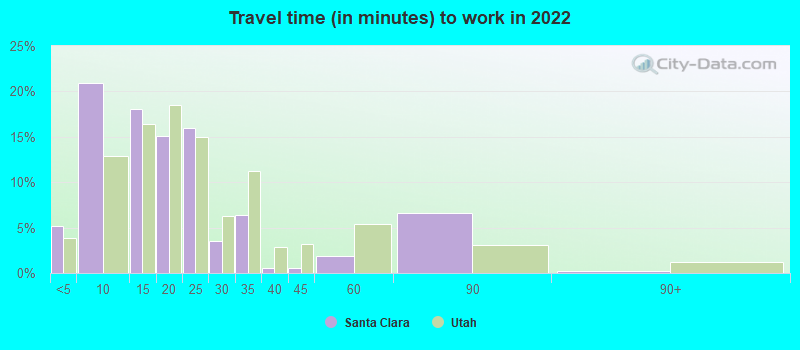
High school or higher: 94.0%Bachelor's degree or higher: 36.6%Graduate or professional degree: 9.5%Unemployed: 3.2%Mean travel time to work (commute): 18.6 minutes
Education Gini index (Inequality in education) Here:
8.9Utah average:
10.9
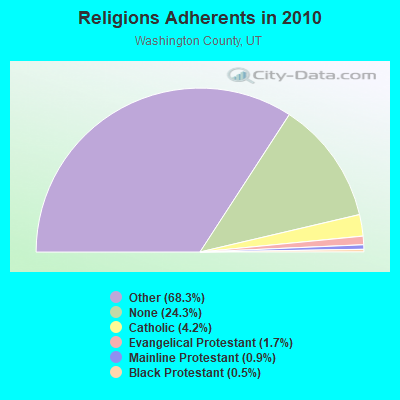
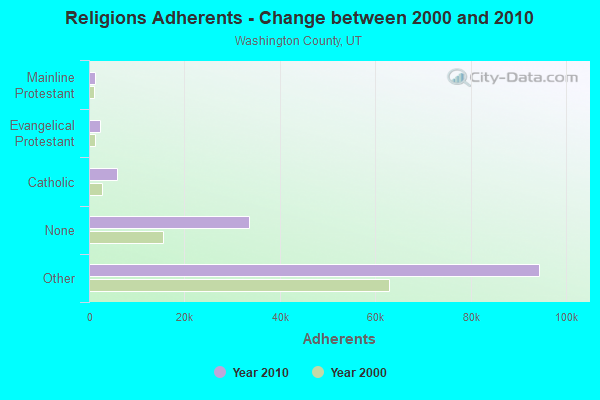
Religion statistics for Santa Clara, UT (based on Washington County data)
Religion Adherents Congregations Other 94,366 243 Catholic 5,845 1 Evangelical Protestant 2,345 25 Mainline Protestant 1,291 5 Black Protestant 658 2 None 33,610 -
Source: Clifford Grammich, Kirk Hadaway, Richard Houseal, Dale E.Jones, Alexei Krindatch, Richie Stanley and Richard H.Taylor. 2012. 2010 U.S.Religion Census: Religious Congregations & Membership Study. Association of Statisticians of American Religious Bodies. Jones, Dale E., et al. 2002. Congregations and Membership in the United States 2000. Nashville, TN: Glenmary Research Center. Graphs represent county-level data
Food Environment Statistics: Number of grocery stores : 14Washington County :
1.05 / 10,000 pop.Utah :
1.37 / 10,000 pop.
Number of supercenters and club stores : 3Here :
0.22 / 10,000 pop.State :
0.18 / 10,000 pop.
Number of convenience stores (no gas) : 4This county :
0.30 / 10,000 pop.State :
0.41 / 10,000 pop.
Number of convenience stores (with gas) : 40Washington County :
3.00 / 10,000 pop.Utah :
2.82 / 10,000 pop.
Number of full-service restaurants : 73Washington County :
5.47 / 10,000 pop.Utah :
5.09 / 10,000 pop.
Adult diabetes rate : Washington County :
7.4%Utah :
6.3%
Health and Nutrition: Healthy diet rate : Santa Clara:
48.2%Utah:
48.9%
Average overall health of teeth and gums : This city:
44.4%Utah:
47.0%
People feeling badly about themselves : Santa Clara:
21.6%Utah:
21.0%
People not drinking alcohol at all : Average hours sleeping at night : Overweight people : Santa Clara:
35.4%State:
31.9%
General health condition : This city:
54.8%Utah:
57.4%
Average condition of hearing : This city:
77.3%Utah:
80.1%
More about Health and Nutrition of Santa Clara, UT Residents
Local government employment and payroll (March 2022)
Function
Full-time employees
Monthly full-time payroll
Average yearly full-time wage
Part-time employees
Monthly part-time payroll
Streets and Highways
9 $45,085 $60,113 0 $0 Firefighters
8 $48,652 $72,978 11 $12,827 Parks and Recreation
8 $41,680 $62,520 1 $1,581 Financial Administration
6 $45,767 $91,534 2 $767 Electric Power
6 $44,772 $89,544 0 $0 Other and Unallocable
3 $18,060 $72,240 1 $1,548 Judicial and Legal
2 $7,356 $44,136 1 $1,037 Other Government Administration
1 $5,920 $71,040 6 $4,439 Fire - Other
0 $0 8 $11,445
Totals for Government
43 $257,292 $71,802 30 $33,644
Santa Clara government finances - Expenditure in 2021 (per resident):
Construction - Water Utilities: $983,000 ($121.01)
Parks and Recreation: $516,000 ($63.52)Sewerage: $112,000 ($13.79)General - Other: $103,000 ($12.68)Electric Utilities: $93,000 ($11.45)Regular Highways: $19,000 ($2.34)Central Staff Services: $3,000 ($0.37)Current Operations - General - Other: $5,374,000 ($661.58)
Electric Utilities: $4,991,000 ($614.43)Parks and Recreation: $1,397,000 ($171.98)Water Utilities: $1,119,000 ($137.76)Central Staff Services: $1,027,000 ($126.43)Health - Other: $760,000 ($93.56)Local Fire Protection: $630,000 ($77.56)Regular Highways: $578,000 ($71.16)Sewerage: $519,000 ($63.89)Protective Inspection and Regulation - Other: $459,000 ($56.51)Judicial and Legal Services: $285,000 ($35.09)Housing and Community Development: $25,000 ($3.08)Police Protection: $11,000 ($1.35)General - Interest on Debt: $213,000 ($26.22)
Intergovernmental to Local - Other - General - Other: $1,160,000 ($142.80)
Intergovernmental to State - General - Other: $3,000 ($0.37)
Other Capital Outlay - Health - Other: $548,000 ($67.46)
Parks and Recreation: $79,000 ($9.73)Electric Utilities: $69,000 ($8.49)General - Other: $66,000 ($8.13)Central Staff Services: $21,000 ($2.59)Water Utilities: $20,000 ($2.46)Sewerage: $11,000 ($1.35)Protective Inspection and Regulation - Other: $3,000 ($0.37)Total Salaries and Wages: $4,484,000 ($552.01)
Santa Clara government finances - Revenue in 2021 (per resident):
Charges - Other: $2,852,000 ($351.10)
Sewerage: $869,000 ($106.98)Regular Highways: $757,000 ($93.19)Parks and Recreation: $594,000 ($73.13)Solid Waste Management: $395,000 ($48.63)Miscellaneous Commercial Activities: $109,000 ($13.42)Local Intergovernmental - Other: $1,240,000 ($152.65)
Miscellaneous - Fines and Forfeits: $540,000 ($66.48)
General Revenue - Other: $297,000 ($36.56)Interest Earnings: $112,000 ($13.79)Rents: $28,000 ($3.45)Sale of Property: $8,000 ($0.98)Donations From Private Sources: $2,000 ($0.25)Revenue - Electric Utilities: $6,778,000 ($834.42)
Water Utilities: $2,352,000 ($289.55)State Intergovernmental - Other: $1,125,000 ($138.50)
Highways: $379,000 ($46.66)General Local Government Support: $6,000 ($0.74)Tax - General Sales and Gross Receipts: $3,493,000 ($430.01)
Property: $1,984,000 ($244.24)Other: $1,117,000 ($137.51)Other License: $456,000 ($56.14)Occupation and Business License - Other: $441,000 ($54.29)Public Utilities Sales: $392,000 ($48.26)Other Selective Sales: $253,000 ($31.15)
Santa Clara government finances - Debt in 2021 (per resident):
Long Term Debt - Beginning Outstanding - Unspecified Public Purpose: $5,324,000 ($655.42)
Outstanding Unspecified Public Purpose: $5,047,000 ($621.32)Retired Unspecified Public Purpose: $2,534,000 ($311.95)Issue, Unspecified Public Purpose: $2,257,000 ($277.85)
Santa Clara government finances - Cash and Securities in 2021 (per resident):
Bond Funds - Cash and Securities: $443,000 ($54.54)
Other Funds - Cash and Securities: $5,495,000 ($676.47)
Businesses in Santa Clara, UT
Strongest AM radio stations in Santa Clara:
KZNU (1450 AM; 10 kW; ST. GEORGE, UT; Owner: AM RADIO 1450, INC.)
KDXU (890 AM; 10 kW; ST. GEORGE, UT; Owner: WESTERN BROADCASTING, LS, LLC)
KUNF (1210 AM; 10 kW; WASHINGTON, UT; Owner: MARATHON MEDIA GROUP, L.L.C.)
KXNT (840 AM; 50 kW; NORTH LAS VEGAS, NV; Owner: INFINITY RADIO OPERATIONS INC.)
KDWN (720 AM; 50 kW; LAS VEGAS, NV; Owner: RADIO NEVADA CORP.)
KNNZ (940 AM; 10 kW; CEDAR CITY, UT; Owner: MB MEDIA GROUP, INC.)
KSUB (590 AM; 5 kW; CEDAR CITY, UT; Owner: MB MEDIA GROUP, INC.)
KMIA (710 AM; 50 kW; BLACK CANYON CITY, AZ; Owner: ENTRAVISION HOLDINGS, LLC)
KTNN (660 AM; 50 kW; WINDOW ROCK, AZ; Owner: THE NAVAJO NATION)
KLSQ (870 AM; 10 kW; WHITNEY, NV; Owner: KLSQ-AM LICENSE CORPORATION)
KSFN (1140 AM; 10 kW; NORTH LAS VEGAS, NV; Owner: INFINITY RADIO OPERATIONS INC.)
KALL (700 AM; 50 kW; NORTH SALT LAKE CITY, UT; Owner: CITICASTERS LICENSES, L.P.)
KMJ (580 AM; 50 kW; FRESNO, CA; Owner: INFINITY RADIO OPERATIONS INC.)
Strongest FM radio stations in Santa Clara:
K300AC (107.9 FM; WASHINGTON, ETC., UT; Owner: UNIVERSITY OF UTAH)
KZHK (95.9 FM; ST. GEORGE, UT; Owner: MARVIN KENT FRANDSEN)
KONY (99.9 FM; ST. GEORGE, UT; Owner: FM RADIO 99.9, INC.)
KSNN (93.5 FM; ST. GEORGE, UT; Owner: WESTERN BROADCASTING, LS, LLC)
K232CY (94.3 FM; ST. GEORGE, UT; Owner: CARL L. RIECK)
KREC (98.1 FM; BRIAN HEAD, UT; Owner: MARATHON MEDIA GROUP, L.L.C.)
KMXM (107.1 FM; COLORADO CITY, AZ; Owner: MB MEDIA GROUP, INC.)
K244DU (96.7 FM; ST. GEORGE, UT; Owner: MONTY C. STRATTON)
KXFF (92.5 FM; CEDAR CITY, UT; Owner: MB MEDIA GROUP, INC.)
K211BJ (90.1 FM; TOQUERVILLE, UT; Owner: UNIVERSITY OF UTAH)
KLNR (91.7 FM; PANACA, NV; Owner: NEVADA PUBLIC RADIO CORPORATION)
KBZB (98.9 FM; PIOCHE, NV; Owner: GLA-MAR BROADCASTING, LLC)
K202AW (88.3 FM; CEDAR CITY, UT; Owner: UNIVERSITY OF UTAH)
K252DK (98.3 FM; ST. GEORGE, UT; Owner: MARATHON MEDIA GROUP, L.L.C.)
K204BY (88.7 FM; ST. GEORGE, UT; Owner: AMERICAN FAMILY ASSOCIATION)
KOEZ-LP (105.1 FM; ST. GEORGE, UT; Owner: LATINOS UNIDOS BROADCASTING)
KWBR-LP (105.7 FM; ST. GEORGE, UT; Owner: ASSOCIATION OF COMMUNITY RESOURCES AND NEWS (A.C.O.R.N.))
K209AO (89.7 FM; ST. GEORGE, ETC., UT; Owner: FAITH COMMUNICATIONS CORPORATION)
K213AM (90.5 FM; ST. GEORGE, UT; Owner: UNIVERSITY OF UTAH)
K215CF (90.9 FM; ST. GEORGE, UT; Owner: UTAH STATE UNIV., AGRI & APP SCIENCE)
TV broadcast stations around Santa Clara:
K11JE (Channel 11; ST. GEORGE, UT; Owner: WASHINGTON COUNTY TELEVISION DEPARTMENT)
K59AG (Channel 59; BLOOMINGTON, UT; Owner: BRIGHAM YOUNG UNIVERSITY)
K32FQ (Channel 32; ST. GEORGE, ETC., UT; Owner: UNIVERSITY OF UTAH)
K34FS (Channel 34; ST. GEORGE, ETC., UT; Owner: UNIVERSITY OF UTAH)
K46GE (Channel 46; ST. GEORGE, UT; Owner: WASHINGTON COUNTY TELEVISION DEPARTMENT)
KUWB-LP (Channel 65; BLOOMINGTON, UT; Owner: ACME TELEVISION LICENSES OF UTAH, LLC)
K20GJ (Channel 20; BLOOMINGTON, UT; Owner: BONNEVILLE HOLDING COMPANY)
K63AD (Channel 63; BLOOMINGTON, UT; Owner: WASHINGTON COUNTY TELEVISION DEPT.)
K69CT (Channel 69; ST. GEORGE, UT; Owner: CLEAR CHANNEL BROADCASTING LICENSES, INC.)
KDLQ-LP (Channel 55; ST. GEORGE, ETC., UT; Owner: MB MEDIA GROUP, INC.)
KCSG1 (Channel 4; ST. GEORGE, UT; Owner: DANIEL MATHESON & STEPHEN WADE d/b as BROADCAST WEST)
K02AV (Channel 2; ST. GEORGE, UT; Owner: WASHINGTON COUNTY TELEVISION DEPARTMENT)
K16DS (Channel 16; ST. GEORGE, UT; Owner: DANIEL MATHESON AND STEPHEN WADE d/b as BROADCAST WEST)
KDLU-LP (Channel 26; ST. GEORGE, UT; Owner: MB MEDIA GROUP, INC.)
K24CY (Channel 24; ST. GEORGE, UT; Owner: LARRY H. MILLER COMMUNICATIONS CORP.)
K08BN (Channel 8; ST. GEORGE, UT; Owner: WASHINGTON COUNTY TELEVISION DEPARTMENT)
KUSG (Channel 12; ST. GEORGE, UT; Owner: KUTV HOLDINGS, INC.)
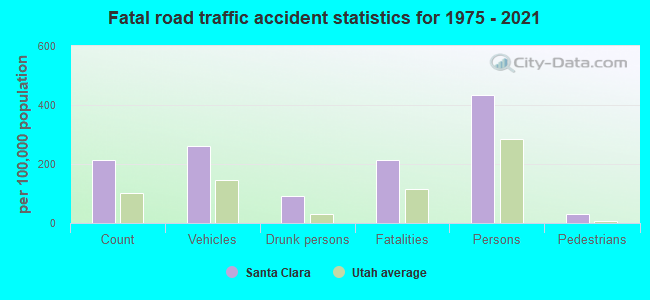
Santa Clara fatal accident statistics for 1975 - 2021
Santa Clara fatal accident list:
Jun 25, 2011 01:30 PM, Santa Clara Dr, Lat: 37.133203, Lon: -113.662578, Vehicles: 1, Persons: 2, Pedestrians: 2, Fatalities: 1Vehicles: 1, Persons: 1, Fatalities: 1Vehicles: 3, Persons: 6, Fatalities: 1, Drunk persons involved: 1Vehicles: 1, Persons: 1, Fatalities: 1, Drunk persons involved: 1Vehicles: 1, Persons: 1, Fatalities: 1Vehicles: 1, Persons: 2, Fatalities: 1, Drunk persons involved: 1Vehicles: 1, Persons: 2, Fatalities: 1
National Bridge Inventory (NBI) Statistics 1 Number of bridges16ft / 4.6m Total length500 Total average daily traffic5 Total average daily truck traffic600 Total future (year 2040) average daily traffic
FCC Registered Cell Phone Towers: 1 (
See the full list of FCC Registered Cell Phone Towers in Santa Clara )
FCC Registered Antenna Towers: 10 (
See the full list of FCC Registered Antenna Towers )
FCC Registered Broadcast Land Mobile Towers: 2
SANTA CLARA, Santa Clara W Circle Drive (Lat: 37.133611 Lon: -113.649083), Type: Tower, Structure height: 10.6 m, Overall height: 15.2 m, Call Sign: WQJT596, Assigned Frequencies: 851.187 MHz, 851.600 MHz, 851.837 MHz, 852.037 MHz, 852.275 MHz, 852.662 MHz, 853.187 MHz, 853.612 MHz, Grant Date: 10/05/2018, Expiration Date: 12/29/2028, Certifier: Steven H Proctor, Registrant: Adcomm Engineering Company, 3929 184th Place Se, Bothell, WA 98012-8827, Phone: (425) 489-0125, Fax: (425) 488-3952, Email:
Lat: 37.133333 Lon: -113.654167, Call Sign: WRTG863, Assigned Frequencies: 35.1600 MHz, Grant Date: 06/15/2022, Expiration Date: 06/15/2032, Certifier: Dean Ballew, Registrant: Radio Licensing Services, Milwaukie, OR 97269, Phone: (503) 659-1240, Fax: (503) 794-3759, Email:
FCC Registered Microwave Towers: 15 (
See the full list of FCC Registered Microwave Towers in this town )
FCC Registered Amateur Radio Licenses: 60 (
See the full list of FCC Registered Amateur Radio Licenses in Santa Clara )
FAA Registered Aircraft: 5
Aircraft: INFINITY POWERED PARACHUTES LL INFINITY 2002 (Category: Land, Seats: 2, Weight: Up to 12,499 Pounds), Engine: ROTAX 582DCDI (65 HP) (2 Cycle)N-Number: 2637M, N2637M, N-2637M, Serial Number: 1PP2-101, Year manufactured: 2002, Airworthiness Date: 10/17/2007, Certificate Issue Date: 09/13/2007Registrant (Individual): Dennis H Mitchell, 2650 Vineyard Dr, Santa Clara, UT 84765Aircraft: PIPER PA-22-150 (Category: Land, Seats: 4, Weight: Up to 12,499 Pounds, Speed: 94 mph), Engine: LYCOMING 0-320 SERIES (180 HP) (Reciprocating)N-Number: 4518A, N4518A, N-4518A, Serial Number: 22-3824, Airworthiness Date: 03/09/1956, Certificate Issue Date: 04/29/2019Registrant (Individual): Dustin C Jensen, 1944 Swiss Cir, Santa Clara, UT 84765Deregistered: Cancel Date: 02/28/2018Aircraft: PIPER AEROSTAR 601P (Category: Land, Engines: 2, Seats: 6, Weight: Up to 12,499 Pounds), Engine: LYCOMING IO-540 SER (300 HP) (Reciprocating)N-Number: 6075Z, N6075Z, N-6075Z, Serial Number: 61P07188063347, Year manufactured: 1980, Airworthiness Date: 10/19/1979, Certificate Issue Date: 03/08/2019Registrant (LLC): Kb Family LLC, 2489 Riverfront Dr, Santa Clara, UT 84765Aircraft: FAYLOR SCOTT BUCKEYE DREAM MACHIN (Category: Land, Seats: 2, Weight: Up to 12,499 Pounds), Engine: 2 CycleN-Number: 543SF, N543SF, N-543SF, Serial Number: 4763, Certificate Issue Date: 02/22/2008Registrant (Individual): Scott A Faylor, 1326 Summerwood Cir, Santa Clara, UT 84765Deregistered: Cancel Date: 01/24/2018Aircraft: BALLOON WORKS FIREFLY 8B-15 (Category: Land, Weight: Up to 12,499 Pounds), Engine: NoneN-Number: 2573H, N2573H, N-2573H, Serial Number: F8B-422, Year manufactured: 1992, Airworthiness Date: 06/27/1992, Certificate Issue Date: 09/13/1999Registrant (Individual): M Joshua Stanley, 3175 Santa Clara Dr, Santa Clara, UT 84765Deregistered: Cancel Date: 07/12/2017
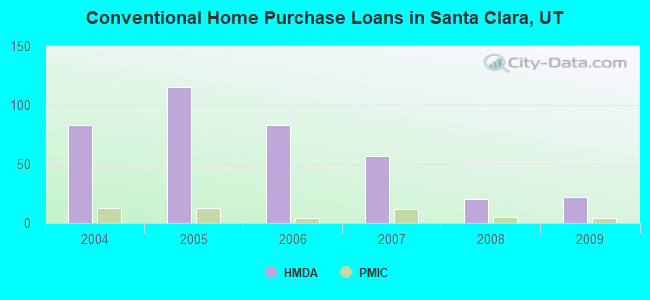
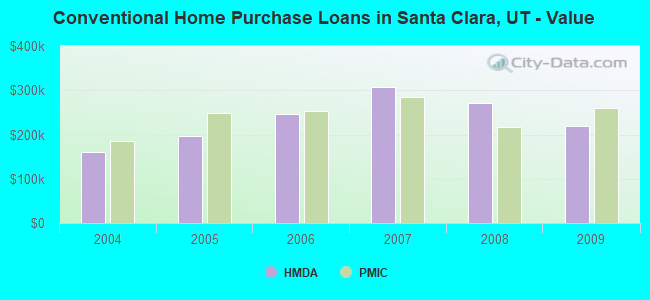
Home Mortgage Disclosure Act Aggregated Statistics For Year 2009(Based on 1 partial tract) A) FHA, FSA/RHS & VA B) Conventional C) Refinancings D) Home Improvement Loans F) Non-occupant Loans on Number Average Value Number Average Value Number Average Value Number Average Value Number Average Value
LOANS ORIGINATED 12 $200,242 22 $218,675 80 $214,626 1 $227,760 20 $224,538 APPLICATIONS APPROVED, NOT ACCEPTED 1 $227,760 1 $229,210 12 $255,823 0 $0 1 $183,950 APPLICATIONS DENIED 5 $237,900 5 $211,322 36 $279,038 1 $55,760 4 $201,148 APPLICATIONS WITHDRAWN 1 $201,690 4 $299,910 20 $218,111 0 $0 3 $136,270 FILES CLOSED FOR INCOMPLETENESS 1 $185,030 1 $271,210 4 $202,685 0 $0 0 $0
Aggregated Statistics For Year 2008(Based on 1 partial tract) A) FHA, FSA/RHS & VA B) Conventional C) Refinancings D) Home Improvement Loans F) Non-occupant Loans on Number Average Value Number Average Value Number Average Value Number Average Value Number Average Value
LOANS ORIGINATED 8 $233,148 20 $271,448 49 $273,711 1 $203,500 10 $288,485 APPLICATIONS APPROVED, NOT ACCEPTED 1 $251,300 1 $232,110 18 $362,703 1 $17,380 2 $627,880 APPLICATIONS DENIED 1 $169,460 4 $300,000 37 $396,499 3 $107,907 5 $455,304 APPLICATIONS WITHDRAWN 0 $0 2 $433,070 14 $271,135 0 $0 2 $594,570 FILES CLOSED FOR INCOMPLETENESS 0 $0 0 $0 4 $374,682 0 $0 1 $107,180
Aggregated Statistics For Year 2007(Based on 1 partial tract) A) FHA, FSA/RHS & VA B) Conventional C) Refinancings D) Home Improvement Loans F) Non-occupant Loans on G) Loans On Manufactured Number Average Value Number Average Value Number Average Value Number Average Value Number Average Value Number Average Value
LOANS ORIGINATED 2 $254,735 57 $306,718 96 $297,096 3 $105,250 26 $354,802 0 $0 APPLICATIONS APPROVED, NOT ACCEPTED 0 $0 9 $337,276 18 $282,076 2 $130,900 6 $355,340 0 $0 APPLICATIONS DENIED 1 $154,980 39 $436,721 50 $421,238 4 $349,698 22 $466,632 1 $101,030 APPLICATIONS WITHDRAWN 1 $223,050 7 $483,403 20 $376,783 1 $72,420 6 $423,537 0 $0 FILES CLOSED FOR INCOMPLETENESS 0 $0 3 $244,537 5 $363,042 0 $0 2 $240,255 0 $0
Aggregated Statistics For Year 2006(Based on 1 partial tract) A) FHA, FSA/RHS & VA B) Conventional C) Refinancings D) Home Improvement Loans F) Non-occupant Loans on Number Average Value Number Average Value Number Average Value Number Average Value Number Average Value
LOANS ORIGINATED 0 $0 83 $246,760 112 $266,541 9 $151,479 41 $253,876 APPLICATIONS APPROVED, NOT ACCEPTED 0 $0 13 $317,562 16 $288,254 1 $186,120 8 $297,465 APPLICATIONS DENIED 0 $0 25 $316,316 41 $360,599 4 $92,065 18 $457,513 APPLICATIONS WITHDRAWN 1 $98,130 11 $280,298 21 $272,523 2 $126,915 6 $239,832 FILES CLOSED FOR INCOMPLETENESS 0 $0 5 $284,394 7 $334,891 0 $0 3 $348,460
Aggregated Statistics For Year 2005(Based on 1 partial tract) A) FHA, FSA/RHS & VA B) Conventional C) Refinancings D) Home Improvement Loans F) Non-occupant Loans on Number Average Value Number Average Value Number Average Value Number Average Value Number Average Value
LOANS ORIGINATED 1 $225,590 115 $196,844 119 $213,542 9 $120,419 48 $200,641 APPLICATIONS APPROVED, NOT ACCEPTED 0 $0 17 $168,931 21 $174,567 0 $0 7 $183,740 APPLICATIONS DENIED 0 $0 16 $192,162 35 $181,712 5 $24,984 10 $145,963 APPLICATIONS WITHDRAWN 0 $0 13 $171,691 27 $215,570 4 $112,160 7 $271,627 FILES CLOSED FOR INCOMPLETENESS 0 $0 3 $123,113 9 $272,943 0 $0 1 $135,790
Aggregated Statistics For Year 2004(Based on 1 partial tract) A) FHA, FSA/RHS & VA B) Conventional C) Refinancings D) Home Improvement Loans F) Non-occupant Loans on Number Average Value Number Average Value Number Average Value Number Average Value Number Average Value
LOANS ORIGINATED 2 $145,020 83 $159,394 87 $184,829 1 $266,510 25 $141,552 APPLICATIONS APPROVED, NOT ACCEPTED 0 $0 12 $146,711 20 $187,043 0 $0 6 $199,275 APPLICATIONS DENIED 0 $0 15 $186,168 33 $179,053 6 $33,977 4 $179,420 APPLICATIONS WITHDRAWN 1 $232,830 12 $145,594 20 $208,968 3 $61,557 3 $128,063 FILES CLOSED FOR INCOMPLETENESS 0 $0 2 $124,380 4 $204,678 0 $0 0 $0
Detailed HMDA statistics for the following Tracts:
2705.00
Private Mortgage Insurance Companies Aggregated Statistics For Year 2009(Based on 1 partial tract) A) Conventional B) Refinancings C) Non-occupant Loans on Number Average Value Number Average Value Number Average Value
LOANS ORIGINATED 4 $260,712 1 $373,690 1 $216,540 APPLICATIONS APPROVED, NOT ACCEPTED 1 $246,230 1 $366,450 0 $0 APPLICATIONS DENIED 2 $236,630 0 $0 2 $215,270 APPLICATIONS WITHDRAWN 1 $231,020 1 $345,080 1 $231,020 FILES CLOSED FOR INCOMPLETENESS 0 $0 0 $0 0 $0
Aggregated Statistics For Year 2008(Based on 1 partial tract) A) Conventional B) Refinancings C) Non-occupant Loans on Number Average Value Number Average Value Number Average Value
LOANS ORIGINATED 5 $216,608 4 $247,042 1 $183,580 APPLICATIONS APPROVED, NOT ACCEPTED 3 $241,883 3 $307,060 0 $0 APPLICATIONS DENIED 0 $0 1 $176,340 0 $0 APPLICATIONS WITHDRAWN 0 $0 0 $0 0 $0 FILES CLOSED FOR INCOMPLETENESS 0 $0 0 $0 0 $0
Aggregated Statistics For Year 2007(Based on 1 partial tract) A) Conventional B) Refinancings C) Non-occupant Loans on Number Average Value Number Average Value Number Average Value
LOANS ORIGINATED 12 $285,425 5 $293,590 2 $312,855 APPLICATIONS APPROVED, NOT ACCEPTED 2 $189,380 2 $350,695 1 $193,720 APPLICATIONS DENIED 0 $0 0 $0 0 $0 APPLICATIONS WITHDRAWN 1 $209,290 0 $0 0 $0 FILES CLOSED FOR INCOMPLETENESS 0 $0 0 $0 0 $0
Aggregated Statistics For Year 2006(Based on 1 partial tract) A) Conventional B) Refinancings C) Non-occupant Loans on Number Average Value Number Average Value Number Average Value
LOANS ORIGINATED 4 $252,655 2 $277,550 2 $227,400 APPLICATIONS APPROVED, NOT ACCEPTED 1 $231,740 1 $325,530 1 $327,700 APPLICATIONS DENIED 0 $0 1 $289,680 0 $0 APPLICATIONS WITHDRAWN 0 $0 0 $0 0 $0 FILES CLOSED FOR INCOMPLETENESS 0 $0 0 $0 0 $0
Aggregated Statistics For Year 2005(Based on 1 partial tract) A) Conventional B) Refinancings C) Non-occupant Loans on Number Average Value Number Average Value Number Average Value
LOANS ORIGINATED 13 $249,264 4 $198,882 5 $213,204 APPLICATIONS APPROVED, NOT ACCEPTED 3 $153,167 3 $125,287 1 $308,870 APPLICATIONS DENIED 1 $292,210 0 $0 0 $0 APPLICATIONS WITHDRAWN 0 $0 0 $0 0 $0 FILES CLOSED FOR INCOMPLETENESS 0 $0 0 $0 0 $0
Aggregated Statistics For Year 2004(Based on 1 partial tract) A) Conventional B) Refinancings C) Non-occupant Loans on Number Average Value Number Average Value Number Average Value
LOANS ORIGINATED 13 $184,253 10 $191,442 3 $154,013 APPLICATIONS APPROVED, NOT ACCEPTED 1 $156,070 5 $178,154 0 $0 APPLICATIONS DENIED 0 $0 0 $0 0 $0 APPLICATIONS WITHDRAWN 1 $279,180 1 $173,450 1 $154,620 FILES CLOSED FOR INCOMPLETENESS 0 $0 0 $0 0 $0
Detailed PMIC statistics for the following Tracts:
2705.00
Most common first names in Santa Clara, UT among deceased individuals Name Count Lived (average)
Robert 11 76.8 years John 10 77.1 years William 10 79.0 years James 6 73.8 years Ruth 6 86.5 years Grant 5 77.2 years Donald 5 76.0 years Frank 4 80.3 years Charles 4 85.5 years Dorothy 4 77.3 years
Most common last names in Santa Clara, UT among deceased individuals Last name Count Lived (average)
Gubler 10 83.7 years Frei 8 76.9 years Hafen 7 90.1 years Anderson 6 69.0 years Jensen 5 79.8 years Ence 5 81.6 years Kelly 4 78.3 years Graff 4 91.8 years Baker 4 70.5 years Jones 4 84.1 years
Santa Clara compared to Utah state average:
Unemployed percentage significantly below state average. Black race population percentage below state average. Renting percentage below state average. Length of stay since moving in significantly above state average. House age significantly below state average. Percentage of population with a bachelor's degree or higher above state average. Santa Clara on our top lists :
#7 on the list of "Top 101 cities with largest percentage of males in occupations: healthcare support occupations (population 5,000+)"
#51 on the list of "Top 101 cities with largest percentage of females in occupations: sales and related occupations (population 5,000+)"
#58 on the list of "Top 101 cities with largest percentage of females in industries: real estate and rental and leasing (population 5,000+)"
#92 on the list of "Top 101 cities with the smallest percentage of likely homosexual households (counted as self-reported same-sex unmarried-partner households) (population 5,000+)"
#23 (84765) on the list of "Top 101 zip codes with the largest charity contributions deductions as a percentage of AGI in 2012 (pop 1,000+)"
#6 on the list of "Top 101 counties with highest percentage of residents voting for Romney (Republican) in the 2012 Presidential Election (pop. 50,000+)"
#17 on the list of "Top 101 counties with the most Other congregations"
#18 on the list of "Top 101 counties with the highest Ozone (1-hour) air pollution readings in 2012 (ppm)"
#19 on the list of "Top 101 counties with the most Other adherents"
#20 on the list of "Top 101 counties with the lowest percentage of residents relocating to foreign countries in 2011 (pop. 50,000+)"
Top Patent Applicants
Trevor Milton (4)
Bruce Mcgill (3)
Dallin Leach (2)
Kenneth Lewis (2)
Ryan Connell Durham (2)
Ryan A. Caplin (1)
Nicholas Michael Schulz (1)
Joseph Evan Smith (1)
John Fenwick Graf (1)
Clyde Ritter (1)
Total of 25 patent applications in 2008-2024.


 Recent articles from our blog. Our writers, many of them Ph.D. graduates or candidates, create easy-to-read articles on a wide variety of topics.

 (102.7 miles
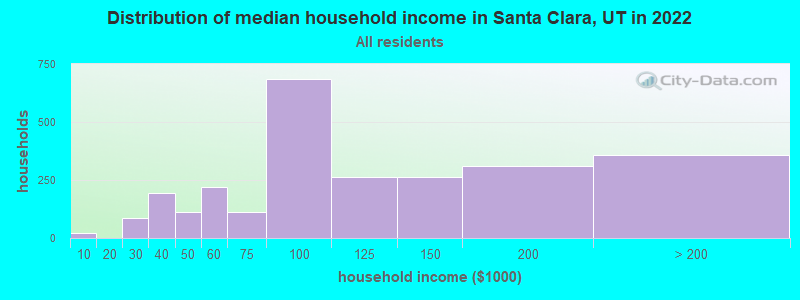


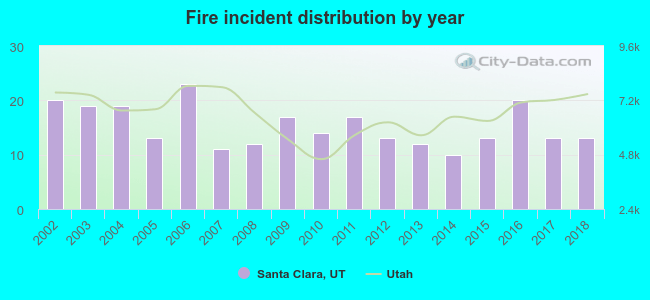 Based on the data from the years 2002 - 2018 the average number of fire incidents per year is 15. The highest number of fires - 23 took place in 2006, and the least - 10 in 2014. The data has a dropping trend.
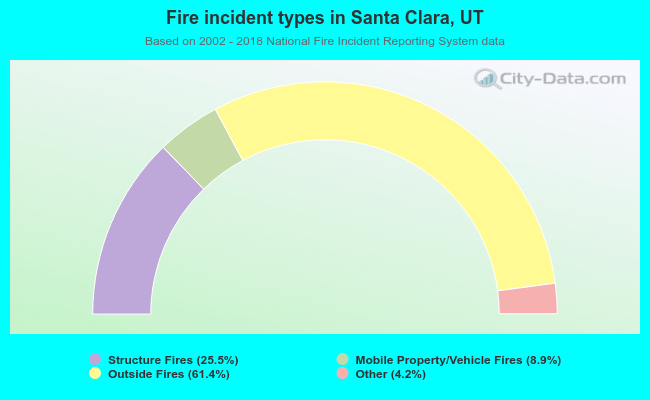 When looking into fire subcategories, the most reports belonged to: Outside Fires (61.4%), and Structure Fires (25.5%).