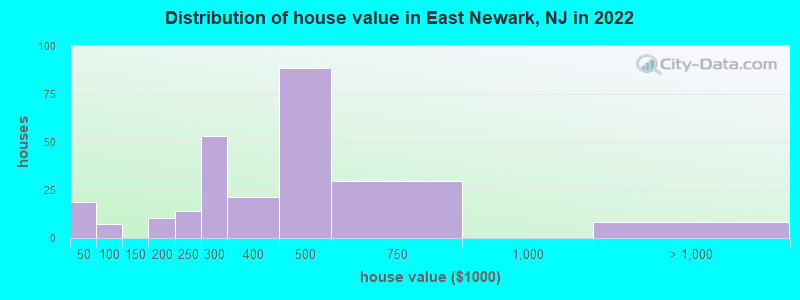
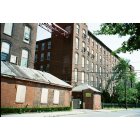
Estimated median house or condo value in 2022: $339,993 (it was $158,600 in 2000)
East Newark:
$339,993
NJ:
$428,900
Mean prices in 2022:all housing units: $369,724; detached houses: $432,594; townhouses or other attached units: $288,470; in 2-unit structures: $381,353; in 3-to-4-unit structures: $453,439; in 5-or-more-unit structures: $303,890
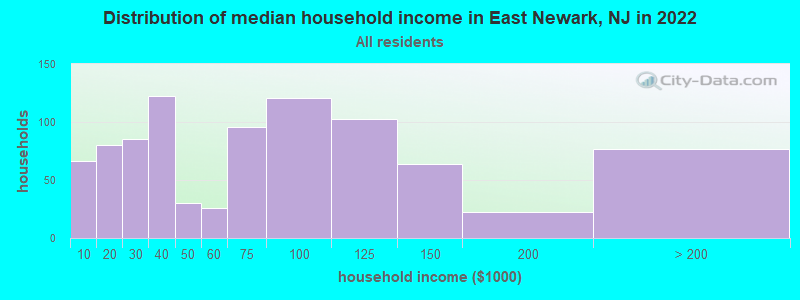
Median gross rent in 2022: $1,626.
March 2022 cost of living index in East Newark: 120.4 (high, U.S. average is 100)
Percentage of residents living in poverty in 2022: 24.4%
(11.1% for White Non-Hispanic residents, 26.6% for Hispanic or Latino residents, 29.8% for other race residents, 27.5% for two or more races residents)
According to our research of New Jersey and other state lists, there was 1 registered sex offender living in East Newark, New Jersey as of June 04, 2024. The ratio of all residents to sex offenders in East Newark is 2,755 to 1. The ratio of registered sex offenders to all residents in this city is lower than the state average.
Crime rates in East Newark by year
Type
2009
2010
2011
2012
2013
2014
2015
2016
2017
2018
2019
2020
2021
2022
Murders (per 100,000)
0 (0.0)
0 (0.0)
0 (0.0)
0 (0.0)
0 (0.0)
0 (0.0)
0 (0.0)
0 (0.0)
0 (0.0)
0 (0.0)
0 (0.0)
0 (0.0)
0 (0.0)
0 (0.0)
Rapes (per 100,000)
0 (0.0)
1 (41.6)
0 (0.0)
0 (0.0)
0 (0.0)
0 (0.0)
0 (0.0)
0 (0.0)
0 (0.0)
0 (0.0)
0 (0.0)
0 (0.0)
0 (0.0)
0 (0.0)
Robberies (per 100,000)
0 (0.0)
0 (0.0)
2 (82.9)
4 (163.7)
6 (244.3)
3 (110.9)
0 (0.0)
0 (0.0)
1 (35.6)
1 (36.5)
1 (37.6)
0 (0.0)
2 (74.0)
1 (42.0)
Assaults (per 100,000)
2 (94.7)
2 (83.1)
2 (82.9)
3 (122.7)
5 (203.6)
2 (73.9)
0 (0.0)
0 (0.0)
0 (0.0)
0 (0.0)
0 (0.0)
1 (38.3)
3 (110.9)
4 (167.9)
Burglaries (per 100,000)
7 (331.3)
10 (415.6)
8 (331.4)
2 (81.8)
5 (203.6)
5 (184.8)
5 (169.5)
2 (73.9)
3 (106.7)
4 (146.0)
3 (112.7)
0 (0.0)
3 (110.9)
0 (0.0)
Thefts (per 100,000)
18 (851.9)
16 (665.0)
10 (414.3)
18 (736.5)
14 (570.0)
17 (628.2)
25 (847.7)
31 (1,145)
33 (1,174)
30 (1,095)
18 (676.4)
9 (344.3)
20 (739.6)
11 (461.6)
Auto thefts (per 100,000)
3 (142.0)
1 (41.6)
7 (290.0)
7 (286.4)
8 (325.7)
6 (221.7)
1 (33.9)
1 (36.9)
4 (142.3)
10 (365.0)
3 (112.7)
1 (38.3)
1 (37.0)
2 (83.9)
Arson (per 100,000)
0 (0.0)
0 (0.0)
1 (41.4)
0 (0.0)
0 (0.0)
0 (0.0)
0 (0.0)
0 (0.0)
0 (0.0)
0 (0.0)
0 (0.0)
0 (0.0)
0 (0.0)
0 (0.0)
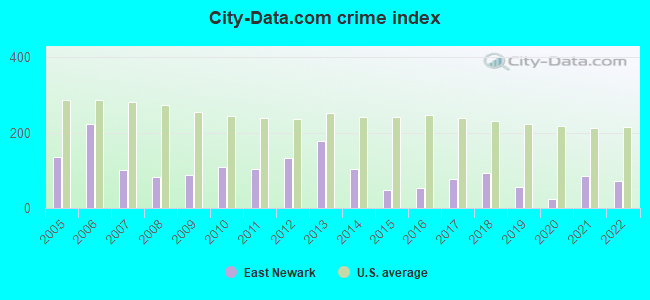
City-Data.com crime index
87.6
108.9
104.4
131.8
177.1
103.8
48.5
53.9
76.5
94.2
55.2
24.5
84.7
71.3
The City-Data.com crime index weighs serious crimes and violent crimes more heavily. Higher means more crime, U.S. average is 246.1. It adjusts for the number of visitors and daily workers commuting into cities.
Latest news from East Newark, NJ collected exclusively by city-data.com from local newspapers, TV, and radio stations
Ancestries: Brazilian (4.0%), Portuguese (3.6%), Irish (3.2%), Polish (1.6%), German (1.5%), Italian (1.2%).
Current Local Time: EST time zone
Elevation: 30 feet
Land area: 0.10 square miles.
Population density: 24,066 people per square mile (very high).
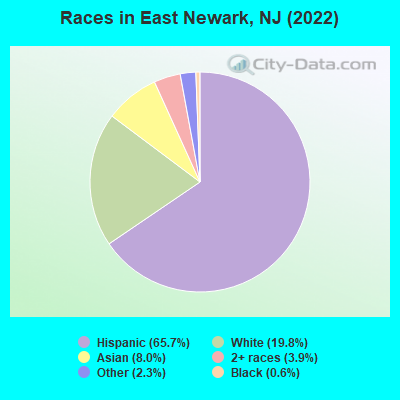
1,802 residents are foreign born (55.4% Latin America).
This borough:
67.1%
New Jersey:
23.2%
Median real estate property taxes paid for housing units with mortgages in 2022: $7,619 (2.3%) Median real estate property taxes paid for housing units with no mortgage in 2022: $7,269 (2.2%)
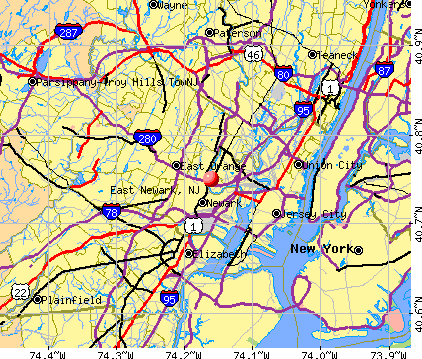
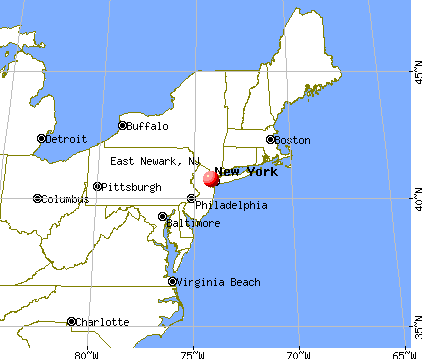
Nearest city with pop. 50,000+: Newark, NJ (1.6 miles , pop. 273,546).
Nearest city with pop. 1,000,000+: Manhattan, NY (9.9 miles , pop. 1,537,195).
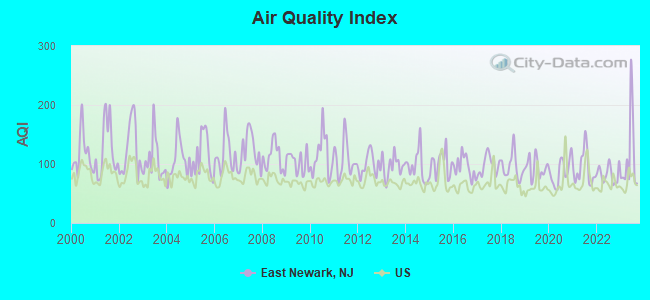
Air Quality Index (AQI) level in 2023 was 111. This is significantly worse than average.
City:
111
U.S.:
73
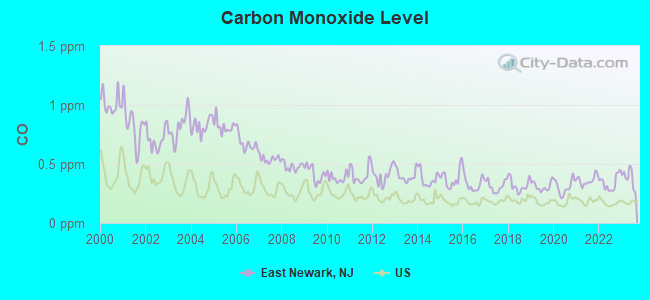
Carbon Monoxide (CO) [ppm] level in 2023 was 0.384. This is significantly worse than average.Closest monitor was 1.2 miles away from the city center.
City:
0.384
U.S.:
0.251
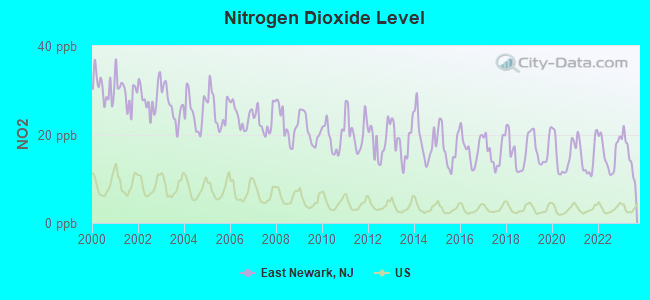
Nitrogen Dioxide (NO2) [ppb] level in 2023 was 15.5. This is significantly worse than average.Closest monitor was 1.2 miles away from the city center.
City:
15.5
U.S.:
5.1
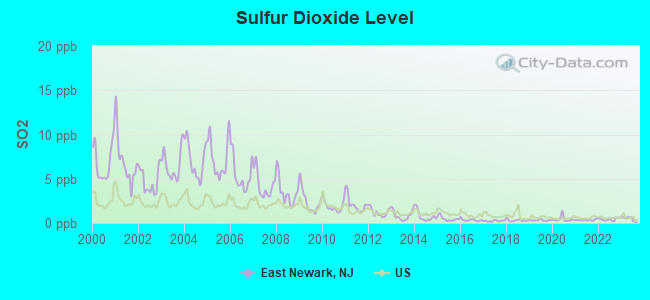
Sulfur Dioxide (SO2) [ppb] level in 2023 was 0.520. This is significantly better than average.Closest monitor was 1.2 miles away from the city center.
City:
0.520
U.S.:
1.515
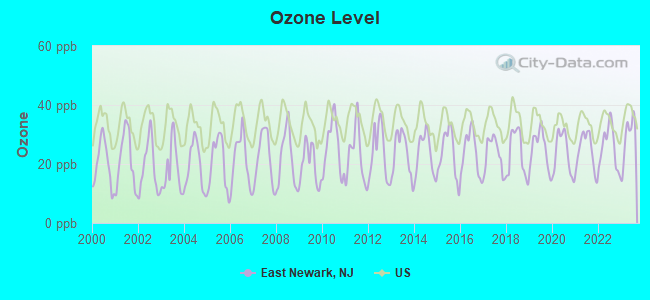
Ozone [ppb] level in 2023 was 29.0. This is about average.Closest monitor was 1.2 miles away from the city center.
City:
29.0
U.S.:
33.3
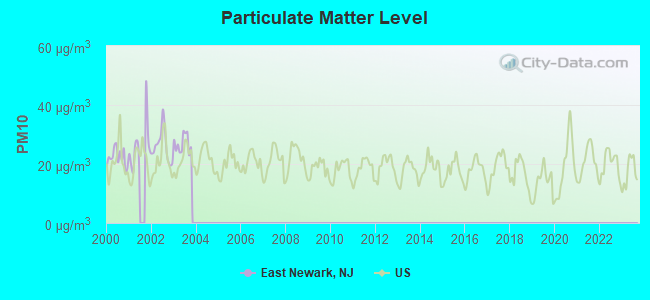
Particulate Matter (PM10) [µg/m3] level in 2003 was 26.9. This is worse than average.Closest monitor was 2.1 miles away from the city center.
City:
26.9
U.S.:
19.2
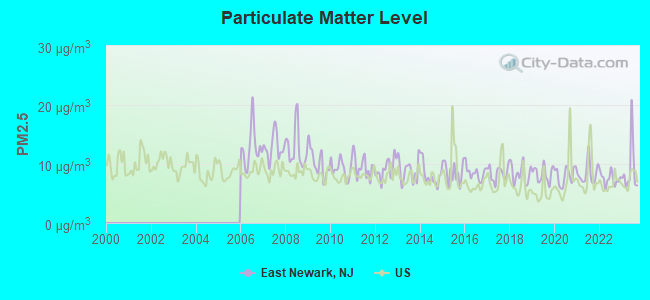
Particulate Matter (PM2.5) [µg/m3] level in 2023 was 9.06. This is about average.Closest monitor was 1.8 miles away from the city center.
City:
9.06
U.S.:
8.11
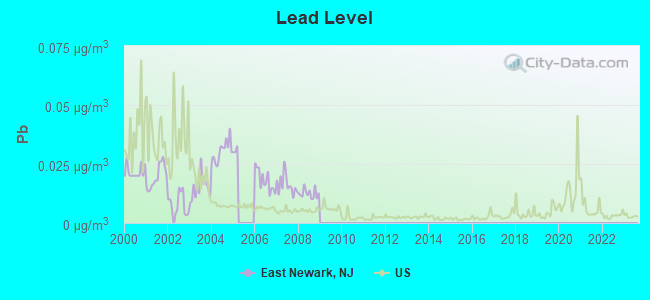
Lead (Pb) [µg/m3] level in 2008 was 0.0125. This is worse than average.Closest monitor was 0.7 miles away from the city center.
City:
0.0125
U.S.:
0.0093
Tornado activity:
East Newark-area historical tornado activity is near New Jersey state average. It is 36% smaller than the overall U.S. average.
On 5/28/1973, a category F3 (max. wind speeds 158-206 mph) tornado 18.1 miles away from the East Newark borough center causedbetween $50,000 and $500,000 in damages.
On 5/28/1973, a category F3 tornado 30.1 miles away from the borough center injured 12 peopleand causedbetween $50,000 and $500,000 in damages.
Earthquake activity:
East Newark-area historical earthquake activity is significantly above New Jersey state average. It is 68% smaller than the overall U.S. average.
On 8/23/2011 at 17:51:04, a magnitude 5.8 (5.8 MW, Depth: 3.7 mi, Class: Moderate, Intensity: VI - VII) earthquake occurred 281.7 miles away from the city center On 10/7/1983 at 10:18:46, a magnitude 5.3 (5.1 MB, 5.3 LG, 5.1 ML) earthquake occurred 221.7 miles away from the city center On 1/16/1994 at 01:49:16, a magnitude 4.6 (4.6 MB, 4.6 LG, Depth: 3.1 mi, Class: Light, Intensity: IV - V) earthquake occurred 102.8 miles away from East Newark center On 4/20/2002 at 10:50:47, a magnitude 5.3 (5.3 ML, Depth: 3.0 mi) earthquake occurred 261.3 miles away from the city center On 4/20/2002 at 10:50:47, a magnitude 5.2 (5.2 MB, 4.2 MS, 5.2 MW, 5.0 MW) earthquake occurred 259.5 miles away from the city center On 1/16/1994 at 00:42:43, a magnitude 4.2 (4.2 MB, 4.0 LG, Depth: 3.1 mi) earthquake occurred 101.3 miles away from the city center Magnitude types: regional Lg-wave magnitude (LG), body-wave magnitude (MB), local magnitude (ML), surface-wave magnitude (MS), moment magnitude (MW)
Natural disasters:
The number of natural disasters in Hudson County (21) is greater than the US average (15). Major Disasters (Presidential) Declared: 11 Emergencies Declared: 10
Causes of natural disasters: Hurricanes: 6, Floods: 4, Snowstorms: 3, Storms: 3, Blizzards: 2, Heavy Rains: 2, Water Shortages: 2, Winter Storms: 2, Power Outage: 1, Other: 3 (Note: some incidents may be assigned to more than one category).
Hospitals and medical centers near East Newark:
BELGROVE POST ACUTE CARE CENTER (Nursing Home, about 1 miles away; KEARNY, NJ)
RCG HARRISON DC (Dialysis Facility, about 1 miles away; HARRISON, NJ)
BROADWAY HOUSE FOR CONTINUING (Nursing Home, about 1 miles away; NEWARK, NJ)
NEW VISTA (Nursing Home, about 1 miles away; NEWARK, NJ)
SAINT MICHAEL'S MEDICAL CENTER, INC Acute Care Hospitals (about 1 miles away; NEWARK, NJ)
CLARA MAASS MEDICAL CENTER, WEST HUDSON DIVISION (Hospital, about 1 miles away; KEARNY, NJ)
WEST HUDSON POST ACUTE CARE CENTER (Nursing Home, about 1 miles away; KEARNY, NJ)
Amtrak stations near East Newark:
2 miles: NEWARK (RAYMOND PLAZA WEST) . Services: ticket office, fully wheelchair accessible, enclosed waiting area, public restrooms, public payphones, snack bar, ATM, paid short-term parking, paid long-term parking, call for car rental service, taxi stand, intercity bus service, public transit connection.
5 miles: NEWARK INTERNATIONAL AIRPORT (NEWARK, ) . Services: ticket office, enclosed waiting area, public restrooms, public payphones.
9 miles: NEW YORK (PENN STA) (NEW YORK, 7TH AVE. & W. 32ND ST.) . Services: ticket office, fully wheelchair accessible, enclosed waiting area, public restrooms, public payphones, full-service food facilities, snack bar, vending machines, ATM, paid short-term parking, paid long-term parking, call for car rental service, taxi stand, public transit connection.
Colleges/universities with over 2000 students nearest to East Newark:
Hudson County has a predicted average indoor radon screening level between 2 and 4 pCi/L (pico curies per liter) - Moderate Potential
Average household size:
This borough:
3.2 people
New Jersey:
2.7 people
Percentage of family households:
This borough:
75.0%
Whole state:
69.3%
Percentage of households with unmarried partners:
This borough:
8.4%
Whole state:
5.9%
Likely homosexual households (counted as self-reported same-sex unmarried-partner households)
Lesbian couples: 0.3% of all households
Gay men: 0.3% of all households
Banks with branches in East Newark (2011 data):
New York Community Bank: East Newark Branch at 155 Central Ave, branch established on 1941/11/01. Info updated 2010/03/29: Bank assets: $39,468.7 mil, Deposits: $20,709.8 mil, headquarters in Westbury, NY, positive income, Commercial Lending Specialization, 247 total offices, Holding Company: New York Community Bancorp, Inc.
Valley National Bank: East Newark Branch at 710 North Fourth Street, branch established on 1952/10/01. Info updated 2012/01/10: Bank assets: $14,186.7 mil, Deposits: $9,715.7 mil, headquarters in Wayne, NJ, positive income, Commercial Lending Specialization, 219 total offices, Holding Company: Valley National Bancorp
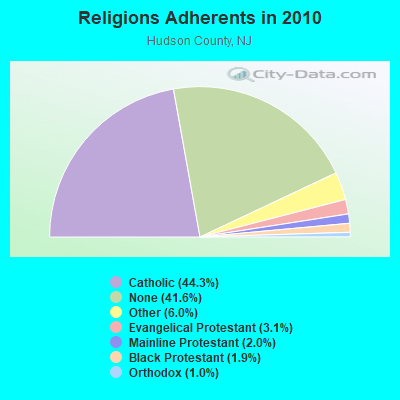
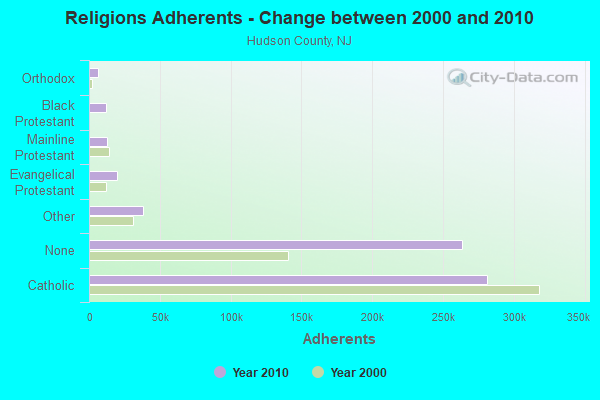
Religion statistics for East Newark, NJ (based on Hudson County data)
Religion
Adherents
Congregations
Catholic
280,930
53
Other
38,322
63
Evangelical Protestant
19,890
133
Mainline Protestant
12,853
93
Black Protestant
12,308
26
Orthodox
6,318
12
None
263,645
-
Source: Clifford Grammich, Kirk Hadaway, Richard Houseal, Dale E.Jones, Alexei Krindatch, Richie Stanley and Richard H.Taylor. 2012. 2010 U.S.Religion Census: Religious Congregations & Membership Study. Association of Statisticians of American Religious Bodies. Jones, Dale E., et al. 2002. Congregations and Membership in the United States 2000. Nashville, TN: Glenmary Research Center. Graphs represent county-level data
Call Sign: N2UXB, Grant Date: 05/18/1993, Expiration Date: 05/18/2003, Cancellation Date: 05/19/2005, Registrant: Fernanda C Tirado, 416 N Second St, East Newark, NJ 07029
Call Sign: N2UXC, Grant Date: 05/18/1993, Expiration Date: 05/18/2003, Cancellation Date: 05/19/2005, Registrant: Ana M Celi, 416 N Second St, East Newark, NJ 07029
Call Sign: N2UXF, Grant Date: 05/18/1993, Expiration Date: 05/18/2003, Cancellation Date: 05/19/2005, Registrant: Paulina P Celi, 416 N Second St, East Newark, NJ 07029
Call Sign: N2UXG, Grant Date: 05/18/1993, Expiration Date: 05/18/2003, Cancellation Date: 05/19/2005, Registrant: Jimmy B Celi, 416 N Second St, East Newark, NJ 07029
Call Sign: KC2NZY, Licensee ID: L01001163, Grant Date: 04/06/2005, Expiration Date: 04/06/2015, Cancellation Date: 06/17/2006, Certifier: Allen F Yudichak, Registrant: Allen F Yudichak, 344 John St, East Newark, NJ 07029
Call Sign: K2AFY, Previous Call Sign: KC2NZY, Licensee ID: L01001163, Grant Date: 03/25/2016, Expiration Date: 06/17/2026, Certifier: Allen F Yudichak, Registrant: Allen F Yudichak, 502 N 3rd St, East Newark, NJ 07029
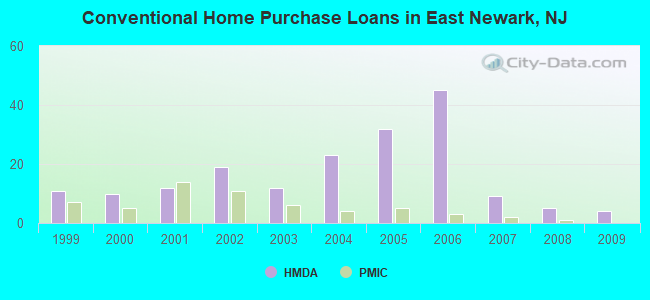
Home Mortgage Disclosure Act Aggregated Statistics For Year 2009 (Based on 1 full tract)
B) Conventional Home Purchase Loans
C) Refinancings
F) Non-occupant Loans on < 5 Family Dwellings (A B C & D)
Number
Average Value
Number
Average Value
Number
Average Value
LOANS ORIGINATED
4
$190,750
12
$245,083
3
$172,000
APPLICATIONS APPROVED, NOT ACCEPTED
1
$208,000
2
$297,500
0
$0
APPLICATIONS DENIED
0
$0
7
$196,143
0
$0
APPLICATIONS WITHDRAWN
0
$0
3
$172,333
0
$0
FILES CLOSED FOR INCOMPLETENESS
0
$0
2
$297,000
0
$0
Aggregated Statistics For Year 2008 (Based on 1 full tract)
A) FHA, FSA/RHS & VA Home Purchase Loans
B) Conventional Home Purchase Loans
C) Refinancings
D) Home Improvement Loans
E) Loans on Dwellings For 5+ Families
F) Non-occupant Loans on < 5 Family Dwellings (A B C & D)
Number
Average Value
Number
Average Value
Number
Average Value
Number
Average Value
Number
Average Value
Number
Average Value
LOANS ORIGINATED
0
$0
5
$273,000
10
$264,500
0
$0
0
$0
6
$236,333
APPLICATIONS APPROVED, NOT ACCEPTED
0
$0
0
$0
8
$273,625
0
$0
0
$0
0
$0
APPLICATIONS DENIED
1
$246,000
0
$0
25
$265,120
6
$91,833
0
$0
3
$249,333
APPLICATIONS WITHDRAWN
0
$0
1
$160,000
5
$221,800
0
$0
1
$420,000
1
$160,000
FILES CLOSED FOR INCOMPLETENESS
0
$0
0
$0
4
$280,500
0
$0
0
$0
1
$210,000
Aggregated Statistics For Year 2007 (Based on 1 full tract)
A) FHA, FSA/RHS & VA Home Purchase Loans
B) Conventional Home Purchase Loans
C) Refinancings
D) Home Improvement Loans
E) Loans on Dwellings For 5+ Families
F) Non-occupant Loans on < 5 Family Dwellings (A B C & D)
Number
Average Value
Number
Average Value
Number
Average Value
Number
Average Value
Number
Average Value
Number
Average Value
LOANS ORIGINATED
1
$423,000
9
$305,333
19
$257,947
7
$80,714
1
$240,000
4
$115,250
APPLICATIONS APPROVED, NOT ACCEPTED
0
$0
1
$390,000
2
$222,500
1
$360,000
0
$0
0
$0
APPLICATIONS DENIED
0
$0
6
$236,500
24
$300,292
3
$96,667
0
$0
2
$150,000
APPLICATIONS WITHDRAWN
0
$0
4
$165,000
10
$278,800
0
$0
0
$0
0
$0
FILES CLOSED FOR INCOMPLETENESS
0
$0
0
$0
4
$210,250
0
$0
0
$0
0
$0
Aggregated Statistics For Year 2006 (Based on 1 full tract)
A) FHA, FSA/RHS & VA Home Purchase Loans
B) Conventional Home Purchase Loans
C) Refinancings
D) Home Improvement Loans
E) Loans on Dwellings For 5+ Families
F) Non-occupant Loans on < 5 Family Dwellings (A B C & D)
Number
Average Value
Number
Average Value
Number
Average Value
Number
Average Value
Number
Average Value
Number
Average Value
LOANS ORIGINATED
1
$314,000
45
$248,356
42
$246,476
7
$133,286
0
$0
12
$249,083
APPLICATIONS APPROVED, NOT ACCEPTED
0
$0
8
$235,875
8
$237,375
1
$335,000
1
$72,000
1
$323,000
APPLICATIONS DENIED
0
$0
16
$209,500
26
$207,577
9
$63,889
0
$0
5
$215,800
APPLICATIONS WITHDRAWN
0
$0
9
$258,889
18
$301,056
1
$130,000
1
$400,000
3
$272,333
FILES CLOSED FOR INCOMPLETENESS
0
$0
0
$0
11
$293,182
0
$0
0
$0
0
$0
Aggregated Statistics For Year 2005 (Based on 1 full tract)
A) FHA, FSA/RHS & VA Home Purchase Loans
B) Conventional Home Purchase Loans
C) Refinancings
D) Home Improvement Loans
F) Non-occupant Loans on < 5 Family Dwellings (A B C & D)
Number
Average Value
Number
Average Value
Number
Average Value
Number
Average Value
Number
Average Value
LOANS ORIGINATED
1
$274,000
32
$217,000
43
$214,442
7
$193,000
13
$262,308
APPLICATIONS APPROVED, NOT ACCEPTED
0
$0
5
$204,200
8
$276,875
2
$191,000
2
$219,000
APPLICATIONS DENIED
0
$0
8
$197,000
19
$213,000
6
$34,000
5
$122,600
APPLICATIONS WITHDRAWN
0
$0
8
$240,500
22
$282,818
4
$171,500
3
$364,000
FILES CLOSED FOR INCOMPLETENESS
0
$0
1
$260,000
5
$256,800
0
$0
0
$0
Aggregated Statistics For Year 2004 (Based on 1 full tract)
A) FHA, FSA/RHS & VA Home Purchase Loans
B) Conventional Home Purchase Loans
C) Refinancings
D) Home Improvement Loans
F) Non-occupant Loans on < 5 Family Dwellings (A B C & D)
Number
Average Value
Number
Average Value
Number
Average Value
Number
Average Value
Number
Average Value
LOANS ORIGINATED
3
$276,667
23
$204,652
24
$211,958
5
$72,600
4
$164,000
APPLICATIONS APPROVED, NOT ACCEPTED
0
$0
2
$104,000
8
$199,750
0
$0
3
$119,333
APPLICATIONS DENIED
1
$248,000
6
$182,833
21
$223,714
5
$56,000
2
$158,000
APPLICATIONS WITHDRAWN
0
$0
6
$152,833
10
$247,300
3
$30,000
3
$133,667
FILES CLOSED FOR INCOMPLETENESS
0
$0
2
$377,000
4
$204,000
0
$0
0
$0
Aggregated Statistics For Year 2003 (Based on 1 full tract)
A) FHA, FSA/RHS & VA Home Purchase Loans
B) Conventional Home Purchase Loans
C) Refinancings
D) Home Improvement Loans
F) Non-occupant Loans on < 5 Family Dwellings (A B C & D)
Number
Average Value
Number
Average Value
Number
Average Value
Number
Average Value
Number
Average Value
LOANS ORIGINATED
3
$256,333
12
$195,000
75
$164,547
2
$7,500
7
$149,714
APPLICATIONS APPROVED, NOT ACCEPTED
1
$166,000
2
$106,500
17
$187,647
2
$22,500
3
$149,000
APPLICATIONS DENIED
0
$0
1
$257,000
52
$189,769
4
$28,500
4
$152,750
APPLICATIONS WITHDRAWN
2
$307,500
2
$228,500
17
$161,412
2
$22,500
1
$100,000
FILES CLOSED FOR INCOMPLETENESS
0
$0
1
$116,000
2
$179,000
0
$0
1
$116,000
Aggregated Statistics For Year 2002 (Based on 1 full tract)
A) FHA, FSA/RHS & VA Home Purchase Loans
B) Conventional Home Purchase Loans
C) Refinancings
D) Home Improvement Loans
F) Non-occupant Loans on < 5 Family Dwellings (A B C & D)
Number
Average Value
Number
Average Value
Number
Average Value
Number
Average Value
Number
Average Value
LOANS ORIGINATED
5
$181,800
19
$208,421
44
$133,500
7
$25,429
4
$65,500
APPLICATIONS APPROVED, NOT ACCEPTED
1
$207,000
1
$214,000
13
$162,000
1
$104,000
2
$186,000
APPLICATIONS DENIED
1
$133,000
5
$243,400
18
$110,556
9
$37,111
1
$117,000
APPLICATIONS WITHDRAWN
2
$203,500
0
$0
16
$145,875
2
$18,500
1
$170,000
FILES CLOSED FOR INCOMPLETENESS
1
$303,000
0
$0
7
$130,857
0
$0
1
$58,000
Aggregated Statistics For Year 2001 (Based on 1 full tract)
A) FHA, FSA/RHS & VA Home Purchase Loans
B) Conventional Home Purchase Loans
C) Refinancings
D) Home Improvement Loans
F) Non-occupant Loans on < 5 Family Dwellings (A B C & D)
Number
Average Value
Number
Average Value
Number
Average Value
Number
Average Value
Number
Average Value
LOANS ORIGINATED
5
$137,800
12
$157,333
24
$150,333
3
$34,000
2
$84,500
APPLICATIONS APPROVED, NOT ACCEPTED
0
$0
2
$128,500
5
$151,200
1
$5,000
0
$0
APPLICATIONS DENIED
0
$0
1
$219,000
27
$85,593
7
$24,143
2
$111,500
APPLICATIONS WITHDRAWN
0
$0
0
$0
12
$101,333
2
$8,000
0
$0
FILES CLOSED FOR INCOMPLETENESS
0
$0
2
$98,000
4
$122,500
0
$0
0
$0
Aggregated Statistics For Year 2000 (Based on 1 full tract)
A) FHA, FSA/RHS & VA Home Purchase Loans
B) Conventional Home Purchase Loans
C) Refinancings
D) Home Improvement Loans
F) Non-occupant Loans on < 5 Family Dwellings (A B C & D)
Number
Average Value
Number
Average Value
Number
Average Value
Number
Average Value
Number
Average Value
LOANS ORIGINATED
15
$196,000
10
$125,600
8
$88,375
3
$23,000
2
$39,000
APPLICATIONS APPROVED, NOT ACCEPTED
2
$150,500
2
$118,500
3
$86,333
2
$16,000
1
$68,000
APPLICATIONS DENIED
0
$0
3
$190,333
15
$83,067
12
$19,083
0
$0
APPLICATIONS WITHDRAWN
5
$156,800
2
$120,000
10
$51,100
3
$19,000
0
$0
FILES CLOSED FOR INCOMPLETENESS
0
$0
0
$0
2
$103,500
0
$0
0
$0
Aggregated Statistics For Year 1999 (Based on 2 partial tracts)
A) FHA, FSA/RHS & VA Home Purchase Loans
B) Conventional Home Purchase Loans
C) Refinancings
D) Home Improvement Loans
F) Non-occupant Loans on < 5 Family Dwellings (A B C & D)


 Recent articles from our blog. Our writers, many of them Ph.D. graduates or candidates, create easy-to-read articles on a wide variety of topics.

 (1.6 miles