Fountain, Colorado Submit your own pictures of this city and show them to the world
OSM Map
General Map
Google Map
MSN Map
OSM Map
General Map
Google Map
MSN Map
OSM Map
General Map
Google Map
MSN Map
OSM Map
General Map
Google Map
MSN Map
Please wait while loading the map...
Population in 2022: 28,907 (99% urban, 1% rural). Population change since 2000: +90.2%Males: 14,580 Females: 14,327
March 2022 cost of living index in Fountain: 99.8 (near average, U.S. average is 100) Percentage of residents living in poverty in 2022: 8.5%for White Non-Hispanic residents , 12.4% for Black residents , 12.0% for Hispanic or Latino residents , 27.6% for American Indian residents , 3.0% for other race residents , 10.7% for two or more races residents )
Profiles of local businesses
Business Search - 14 Million verified businesses
Data:
Median household income ($)
Median household income (% change since 2000)
Household income diversity
Ratio of average income to average house value (%)
Ratio of average income to average rent
Median household income ($) - White
Median household income ($) - Black or African American
Median household income ($) - Asian
Median household income ($) - Hispanic or Latino
Median household income ($) - American Indian and Alaska Native
Median household income ($) - Multirace
Median household income ($) - Other Race
Median household income for houses/condos with a mortgage ($)
Median household income for apartments without a mortgage ($)
Races - White alone (%)
Races - White alone (% change since 2000)
Races - Black alone (%)
Races - Black alone (% change since 2000)
Races - American Indian alone (%)
Races - American Indian alone (% change since 2000)
Races - Asian alone (%)
Races - Asian alone (% change since 2000)
Races - Hispanic (%)
Races - Hispanic (% change since 2000)
Races - Native Hawaiian and Other Pacific Islander alone (%)
Races - Native Hawaiian and Other Pacific Islander alone (% change since 2000)
Races - Two or more races (%)
Races - Two or more races (% change since 2000)
Races - Other race alone (%)
Races - Other race alone (% change since 2000)
Racial diversity
Unemployment (%)
Unemployment (% change since 2000)
Unemployment (%) - White
Unemployment (%) - Black or African American
Unemployment (%) - Asian
Unemployment (%) - Hispanic or Latino
Unemployment (%) - American Indian and Alaska Native
Unemployment (%) - Multirace
Unemployment (%) - Other Race
Population density (people per square mile)
Population - Males (%)
Population - Females (%)
Population - Males (%) - White
Population - Males (%) - Black or African American
Population - Males (%) - Asian
Population - Males (%) - Hispanic or Latino
Population - Males (%) - American Indian and Alaska Native
Population - Males (%) - Multirace
Population - Males (%) - Other Race
Population - Females (%) - White
Population - Females (%) - Black or African American
Population - Females (%) - Asian
Population - Females (%) - Hispanic or Latino
Population - Females (%) - American Indian and Alaska Native
Population - Females (%) - Multirace
Population - Females (%) - Other Race
Coronavirus confirmed cases (May 23, 2024)
Deaths caused by coronavirus (May 23, 2024)
Coronavirus confirmed cases (per 100k population) (May 23, 2024)
Deaths caused by coronavirus (per 100k population) (May 23, 2024)
Daily increase in number of cases (May 23, 2024)
Weekly increase in number of cases (May 23, 2024)
Cases doubled (in days) (May 23, 2024)
Hospitalized patients (Apr 18, 2022)
Negative test results (Apr 18, 2022)
Total test results (Apr 18, 2022)
COVID Vaccine doses distributed (per 100k population) (Sep 19, 2023)
COVID Vaccine doses administered (per 100k population) (Sep 19, 2023)
COVID Vaccine doses distributed (Sep 19, 2023)
COVID Vaccine doses administered (Sep 19, 2023)
Likely homosexual households (%)
Likely homosexual households (% change since 2000)
Likely homosexual households - Lesbian couples (%)
Likely homosexual households - Lesbian couples (% change since 2000)
Likely homosexual households - Gay men (%)
Likely homosexual households - Gay men (% change since 2000)
Cost of living index
Median gross rent ($)
Median contract rent ($)
Median monthly housing costs ($)
Median house or condo value ($)
Median house or condo value ($ change since 2000)
Mean house or condo value by units in structure - 1, detached ($)
Mean house or condo value by units in structure - 1, attached ($)
Mean house or condo value by units in structure - 2 ($)
Mean house or condo value by units in structure by units in structure - 3 or 4 ($)
Mean house or condo value by units in structure - 5 or more ($)
Mean house or condo value by units in structure - Boat, RV, van, etc. ($)
Mean house or condo value by units in structure - Mobile home ($)
Median house or condo value ($) - White
Median house or condo value ($) - Black or African American
Median house or condo value ($) - Asian
Median house or condo value ($) - Hispanic or Latino
Median house or condo value ($) - American Indian and Alaska Native
Median house or condo value ($) - Multirace
Median house or condo value ($) - Other Race
Median resident age
Resident age diversity
Median resident age - Males
Median resident age - Females
Median resident age - White
Median resident age - Black or African American
Median resident age - Asian
Median resident age - Hispanic or Latino
Median resident age - American Indian and Alaska Native
Median resident age - Multirace
Median resident age - Other Race
Median resident age - Males - White
Median resident age - Males - Black or African American
Median resident age - Males - Asian
Median resident age - Males - Hispanic or Latino
Median resident age - Males - American Indian and Alaska Native
Median resident age - Males - Multirace
Median resident age - Males - Other Race
Median resident age - Females - White
Median resident age - Females - Black or African American
Median resident age - Females - Asian
Median resident age - Females - Hispanic or Latino
Median resident age - Females - American Indian and Alaska Native
Median resident age - Females - Multirace
Median resident age - Females - Other Race
Commute - mean travel time to work (minutes)
Travel time to work - Less than 5 minutes (%)
Travel time to work - Less than 5 minutes (% change since 2000)
Travel time to work - 5 to 9 minutes (%)
Travel time to work - 5 to 9 minutes (% change since 2000)
Travel time to work - 10 to 19 minutes (%)
Travel time to work - 10 to 19 minutes (% change since 2000)
Travel time to work - 20 to 29 minutes (%)
Travel time to work - 20 to 29 minutes (% change since 2000)
Travel time to work - 30 to 39 minutes (%)
Travel time to work - 30 to 39 minutes (% change since 2000)
Travel time to work - 40 to 59 minutes (%)
Travel time to work - 40 to 59 minutes (% change since 2000)
Travel time to work - 60 to 89 minutes (%)
Travel time to work - 60 to 89 minutes (% change since 2000)
Travel time to work - 90 or more minutes (%)
Travel time to work - 90 or more minutes (% change since 2000)
Marital status - Never married (%)
Marital status - Now married (%)
Marital status - Separated (%)
Marital status - Widowed (%)
Marital status - Divorced (%)
Median family income ($)
Median family income (% change since 2000)
Median non-family income ($)
Median non-family income (% change since 2000)
Median per capita income ($)
Median per capita income (% change since 2000)
Median family income ($) - White
Median family income ($) - Black or African American
Median family income ($) - Asian
Median family income ($) - Hispanic or Latino
Median family income ($) - American Indian and Alaska Native
Median family income ($) - Multirace
Median family income ($) - Other Race
Median year house/condo built
Median year apartment built
Year house built - Built 2005 or later (%)
Year house built - Built 2000 to 2004 (%)
Year house built - Built 1990 to 1999 (%)
Year house built - Built 1980 to 1989 (%)
Year house built - Built 1970 to 1979 (%)
Year house built - Built 1960 to 1969 (%)
Year house built - Built 1950 to 1959 (%)
Year house built - Built 1940 to 1949 (%)
Year house built - Built 1939 or earlier (%)
Average household size
Household density (households per square mile)
Average household size - White
Average household size - Black or African American
Average household size - Asian
Average household size - Hispanic or Latino
Average household size - American Indian and Alaska Native
Average household size - Multirace
Average household size - Other Race
Occupied housing units (%)
Vacant housing units (%)
Owner occupied housing units (%)
Renter occupied housing units (%)
Vacancy status - For rent (%)
Vacancy status - For sale only (%)
Vacancy status - Rented or sold, not occupied (%)
Vacancy status - For seasonal, recreational, or occasional use (%)
Vacancy status - For migrant workers (%)
Vacancy status - Other vacant (%)
Residents with income below the poverty level (%)
Residents with income below 50% of the poverty level (%)
Children below poverty level (%)
Poor families by family type - Married-couple family (%)
Poor families by family type - Male, no wife present (%)
Poor families by family type - Female, no husband present (%)
Poverty status for native-born residents (%)
Poverty status for foreign-born residents (%)
Poverty among high school graduates not in families (%)
Poverty among people who did not graduate high school not in families (%)
Residents with income below the poverty level (%) - White
Residents with income below the poverty level (%) - Black or African American
Residents with income below the poverty level (%) - Asian
Residents with income below the poverty level (%) - Hispanic or Latino
Residents with income below the poverty level (%) - American Indian and Alaska Native
Residents with income below the poverty level (%) - Multirace
Residents with income below the poverty level (%) - Other Race
Air pollution - Air Quality Index (AQI)
Air pollution - CO
Air pollution - NO2
Air pollution - SO2
Air pollution - Ozone
Air pollution - PM10
Air pollution - PM25
Air pollution - Pb
Crime - Murders per 100,000 population
Crime - Rapes per 100,000 population
Crime - Robberies per 100,000 population
Crime - Assaults per 100,000 population
Crime - Burglaries per 100,000 population
Crime - Thefts per 100,000 population
Crime - Auto thefts per 100,000 population
Crime - Arson per 100,000 population
Crime - City-data.com crime index
Crime - Violent crime index
Crime - Property crime index
Crime - Murders per 100,000 population (5 year average)
Crime - Rapes per 100,000 population (5 year average)
Crime - Robberies per 100,000 population (5 year average)
Crime - Assaults per 100,000 population (5 year average)
Crime - Burglaries per 100,000 population (5 year average)
Crime - Thefts per 100,000 population (5 year average)
Crime - Auto thefts per 100,000 population (5 year average)
Crime - Arson per 100,000 population (5 year average)
Crime - City-data.com crime index (5 year average)
Crime - Violent crime index (5 year average)
Crime - Property crime index (5 year average)
1996 Presidential Elections Results (%) - Democratic Party (Clinton)
1996 Presidential Elections Results (%) - Republican Party (Dole)
1996 Presidential Elections Results (%) - Other
2000 Presidential Elections Results (%) - Democratic Party (Gore)
2000 Presidential Elections Results (%) - Republican Party (Bush)
2000 Presidential Elections Results (%) - Other
2004 Presidential Elections Results (%) - Democratic Party (Kerry)
2004 Presidential Elections Results (%) - Republican Party (Bush)
2004 Presidential Elections Results (%) - Other
2008 Presidential Elections Results (%) - Democratic Party (Obama)
2008 Presidential Elections Results (%) - Republican Party (McCain)
2008 Presidential Elections Results (%) - Other
2012 Presidential Elections Results (%) - Democratic Party (Obama)
2012 Presidential Elections Results (%) - Republican Party (Romney)
2012 Presidential Elections Results (%) - Other
2016 Presidential Elections Results (%) - Democratic Party (Clinton)
2016 Presidential Elections Results (%) - Republican Party (Trump)
2016 Presidential Elections Results (%) - Other
2020 Presidential Elections Results (%) - Democratic Party (Biden)
2020 Presidential Elections Results (%) - Republican Party (Trump)
2020 Presidential Elections Results (%) - Other
Ancestries Reported - Arab (%)
Ancestries Reported - Czech (%)
Ancestries Reported - Danish (%)
Ancestries Reported - Dutch (%)
Ancestries Reported - English (%)
Ancestries Reported - French (%)
Ancestries Reported - French Canadian (%)
Ancestries Reported - German (%)
Ancestries Reported - Greek (%)
Ancestries Reported - Hungarian (%)
Ancestries Reported - Irish (%)
Ancestries Reported - Italian (%)
Ancestries Reported - Lithuanian (%)
Ancestries Reported - Norwegian (%)
Ancestries Reported - Polish (%)
Ancestries Reported - Portuguese (%)
Ancestries Reported - Russian (%)
Ancestries Reported - Scotch-Irish (%)
Ancestries Reported - Scottish (%)
Ancestries Reported - Slovak (%)
Ancestries Reported - Subsaharan African (%)
Ancestries Reported - Swedish (%)
Ancestries Reported - Swiss (%)
Ancestries Reported - Ukrainian (%)
Ancestries Reported - United States (%)
Ancestries Reported - Welsh (%)
Ancestries Reported - West Indian (%)
Ancestries Reported - Other (%)
Educational Attainment - No schooling completed (%)
Educational Attainment - Less than high school (%)
Educational Attainment - High school or equivalent (%)
Educational Attainment - Less than 1 year of college (%)
Educational Attainment - 1 or more years of college (%)
Educational Attainment - Associate degree (%)
Educational Attainment - Bachelor's degree (%)
Educational Attainment - Master's degree (%)
Educational Attainment - Professional school degree (%)
Educational Attainment - Doctorate degree (%)
School Enrollment - Nursery, preschool (%)
School Enrollment - Kindergarten (%)
School Enrollment - Grade 1 to 4 (%)
School Enrollment - Grade 5 to 8 (%)
School Enrollment - Grade 9 to 12 (%)
School Enrollment - College undergrad (%)
School Enrollment - Graduate or professional (%)
School Enrollment - Not enrolled in school (%)
School enrollment - Public schools (%)
School enrollment - Private schools (%)
School enrollment - Not enrolled (%)
Median number of rooms in houses and condos
Median number of rooms in apartments
Housing units lacking complete plumbing facilities (%)
Housing units lacking complete kitchen facilities (%)
Density of houses
Urban houses (%)
Rural houses (%)
Households with people 60 years and over (%)
Households with people 65 years and over (%)
Households with people 75 years and over (%)
Households with one or more nonrelatives (%)
Households with no nonrelatives (%)
Population in households (%)
Family households (%)
Nonfamily households (%)
Population in families (%)
Family households with own children (%)
Median number of bedrooms in owner occupied houses
Mean number of bedrooms in owner occupied houses
Median number of bedrooms in renter occupied houses
Mean number of bedrooms in renter occupied houses
Median number of vehichles in owner occupied houses
Mean number of vehichles in owner occupied houses
Median number of vehichles in renter occupied houses
Mean number of vehichles in renter occupied houses
Mortgage status - with mortgage (%)
Mortgage status - with second mortgage (%)
Mortgage status - with home equity loan (%)
Mortgage status - with both second mortgage and home equity loan (%)
Mortgage status - without a mortgage (%)
Average family size
Average family size - White
Average family size - Black or African American
Average family size - Asian
Average family size - Hispanic or Latino
Average family size - American Indian and Alaska Native
Average family size - Multirace
Average family size - Other Race
Geographical mobility - Same house 1 year ago (%)
Geographical mobility - Moved within same county (%)
Geographical mobility - Moved from different county within same state (%)
Geographical mobility - Moved from different state (%)
Geographical mobility - Moved from abroad (%)
Place of birth - Born in state of residence (%)
Place of birth - Born in other state (%)
Place of birth - Native, outside of US (%)
Place of birth - Foreign born (%)
Housing units in structures - 1, detached (%)
Housing units in structures - 1, attached (%)
Housing units in structures - 2 (%)
Housing units in structures - 3 or 4 (%)
Housing units in structures - 5 to 9 (%)
Housing units in structures - 10 to 19 (%)
Housing units in structures - 20 to 49 (%)
Housing units in structures - 50 or more (%)
Housing units in structures - Mobile home (%)
Housing units in structures - Boat, RV, van, etc. (%)
House/condo owner moved in on average (years ago)
Renter moved in on average (years ago)
Year householder moved into unit - Moved in 1999 to March 2000 (%)
Year householder moved into unit - Moved in 1995 to 1998 (%)
Year householder moved into unit - Moved in 1990 to 1994 (%)
Year householder moved into unit - Moved in 1980 to 1989 (%)
Year householder moved into unit - Moved in 1970 to 1979 (%)
Year householder moved into unit - Moved in 1969 or earlier (%)
Means of transportation to work - Drove car alone (%)
Means of transportation to work - Carpooled (%)
Means of transportation to work - Public transportation (%)
Means of transportation to work - Bus or trolley bus (%)
Means of transportation to work - Streetcar or trolley car (%)
Means of transportation to work - Subway or elevated (%)
Means of transportation to work - Railroad (%)
Means of transportation to work - Ferryboat (%)
Means of transportation to work - Taxicab (%)
Means of transportation to work - Motorcycle (%)
Means of transportation to work - Bicycle (%)
Means of transportation to work - Walked (%)
Means of transportation to work - Other means (%)
Working at home (%)
Industry diversity
Most Common Industries - Agriculture, forestry, fishing and hunting, and mining (%)
Most Common Industries - Agriculture, forestry, fishing and hunting (%)
Most Common Industries - Mining, quarrying, and oil and gas extraction (%)
Most Common Industries - Construction (%)
Most Common Industries - Manufacturing (%)
Most Common Industries - Wholesale trade (%)
Most Common Industries - Retail trade (%)
Most Common Industries - Transportation and warehousing, and utilities (%)
Most Common Industries - Transportation and warehousing (%)
Most Common Industries - Utilities (%)
Most Common Industries - Information (%)
Most Common Industries - Finance and insurance, and real estate and rental and leasing (%)
Most Common Industries - Finance and insurance (%)
Most Common Industries - Real estate and rental and leasing (%)
Most Common Industries - Professional, scientific, and management, and administrative and waste management services (%)
Most Common Industries - Professional, scientific, and technical services (%)
Most Common Industries - Management of companies and enterprises (%)
Most Common Industries - Administrative and support and waste management services (%)
Most Common Industries - Educational services, and health care and social assistance (%)
Most Common Industries - Educational services (%)
Most Common Industries - Health care and social assistance (%)
Most Common Industries - Arts, entertainment, and recreation, and accommodation and food services (%)
Most Common Industries - Arts, entertainment, and recreation (%)
Most Common Industries - Accommodation and food services (%)
Most Common Industries - Other services, except public administration (%)
Most Common Industries - Public administration (%)
Occupation diversity
Most Common Occupations - Management, business, science, and arts occupations (%)
Most Common Occupations - Management, business, and financial occupations (%)
Most Common Occupations - Management occupations (%)
Most Common Occupations - Business and financial operations occupations (%)
Most Common Occupations - Computer, engineering, and science occupations (%)
Most Common Occupations - Computer and mathematical occupations (%)
Most Common Occupations - Architecture and engineering occupations (%)
Most Common Occupations - Life, physical, and social science occupations (%)
Most Common Occupations - Education, legal, community service, arts, and media occupations (%)
Most Common Occupations - Community and social service occupations (%)
Most Common Occupations - Legal occupations (%)
Most Common Occupations - Education, training, and library occupations (%)
Most Common Occupations - Arts, design, entertainment, sports, and media occupations (%)
Most Common Occupations - Healthcare practitioners and technical occupations (%)
Most Common Occupations - Health diagnosing and treating practitioners and other technical occupations (%)
Most Common Occupations - Health technologists and technicians (%)
Most Common Occupations - Service occupations (%)
Most Common Occupations - Healthcare support occupations (%)
Most Common Occupations - Protective service occupations (%)
Most Common Occupations - Fire fighting and prevention, and other protective service workers including supervisors (%)
Most Common Occupations - Law enforcement workers including supervisors (%)
Most Common Occupations - Food preparation and serving related occupations (%)
Most Common Occupations - Building and grounds cleaning and maintenance occupations (%)
Most Common Occupations - Personal care and service occupations (%)
Most Common Occupations - Sales and office occupations (%)
Most Common Occupations - Sales and related occupations (%)
Most Common Occupations - Office and administrative support occupations (%)
Most Common Occupations - Natural resources, construction, and maintenance occupations (%)
Most Common Occupations - Farming, fishing, and forestry occupations (%)
Most Common Occupations - Construction and extraction occupations (%)
Most Common Occupations - Installation, maintenance, and repair occupations (%)
Most Common Occupations - Production, transportation, and material moving occupations (%)
Most Common Occupations - Production occupations (%)
Most Common Occupations - Transportation occupations (%)
Most Common Occupations - Material moving occupations (%)
People in Group quarters - Institutionalized population (%)
People in Group quarters - Correctional institutions (%)
People in Group quarters - Federal prisons and detention centers (%)
People in Group quarters - Halfway houses (%)
People in Group quarters - Local jails and other confinement facilities (including police lockups) (%)
People in Group quarters - Military disciplinary barracks (%)
People in Group quarters - State prisons (%)
People in Group quarters - Other types of correctional institutions (%)
People in Group quarters - Nursing homes (%)
People in Group quarters - Hospitals/wards, hospices, and schools for the handicapped (%)
People in Group quarters - Hospitals/wards and hospices for chronically ill (%)
People in Group quarters - Hospices or homes for chronically ill (%)
People in Group quarters - Military hospitals or wards for chronically ill (%)
People in Group quarters - Other hospitals or wards for chronically ill (%)
People in Group quarters - Hospitals or wards for drug/alcohol abuse (%)
People in Group quarters - Mental (Psychiatric) hospitals or wards (%)
People in Group quarters - Schools, hospitals, or wards for the mentally retarded (%)
People in Group quarters - Schools, hospitals, or wards for the physically handicapped (%)
People in Group quarters - Institutions for the deaf (%)
People in Group quarters - Institutions for the blind (%)
People in Group quarters - Orthopedic wards and institutions for the physically handicapped (%)
People in Group quarters - Wards in general hospitals for patients who have no usual home elsewhere (%)
People in Group quarters - Wards in military hospitals for patients who have no usual home elsewhere (%)
People in Group quarters - Juvenile institutions (%)
People in Group quarters - Long-term care (%)
People in Group quarters - Homes for abused, dependent, and neglected children (%)
People in Group quarters - Residential treatment centers for emotionally disturbed children (%)
People in Group quarters - Training schools for juvenile delinquents (%)
People in Group quarters - Short-term care, detention or diagnostic centers for delinquent children (%)
People in Group quarters - Type of juvenile institution unknown (%)
People in Group quarters - Noninstitutionalized population (%)
People in Group quarters - College dormitories (includes college quarters off campus) (%)
People in Group quarters - Military quarters (%)
People in Group quarters - On base (%)
People in Group quarters - Barracks, unaccompanied personnel housing (UPH), (Enlisted/Officer), ;and similar group living quarters for military personnel (%)
People in Group quarters - Transient quarters for temporary residents (%)
People in Group quarters - Military ships (%)
People in Group quarters - Group homes (%)
People in Group quarters - Homes or halfway houses for drug/alcohol abuse (%)
People in Group quarters - Homes for the mentally ill (%)
People in Group quarters - Homes for the mentally retarded (%)
People in Group quarters - Homes for the physically handicapped (%)
People in Group quarters - Other group homes (%)
People in Group quarters - Religious group quarters (%)
People in Group quarters - Dormitories (%)
People in Group quarters - Agriculture workers' dormitories on farms (%)
People in Group quarters - Job Corps and vocational training facilities (%)
People in Group quarters - Other workers' dormitories (%)
People in Group quarters - Crews of maritime vessels (%)
People in Group quarters - Other nonhousehold living situations (%)
People in Group quarters - Other noninstitutional group quarters (%)
Residents speaking English at home (%)
Residents speaking English at home - Born in the United States (%)
Residents speaking English at home - Native, born elsewhere (%)
Residents speaking English at home - Foreign born (%)
Residents speaking Spanish at home (%)
Residents speaking Spanish at home - Born in the United States (%)
Residents speaking Spanish at home - Native, born elsewhere (%)
Residents speaking Spanish at home - Foreign born (%)
Residents speaking other language at home (%)
Residents speaking other language at home - Born in the United States (%)
Residents speaking other language at home - Native, born elsewhere (%)
Residents speaking other language at home - Foreign born (%)
Class of Workers - Employee of private company (%)
Class of Workers - Self-employed in own incorporated business (%)
Class of Workers - Private not-for-profit wage and salary workers (%)
Class of Workers - Local government workers (%)
Class of Workers - State government workers (%)
Class of Workers - Federal government workers (%)
Class of Workers - Self-employed workers in own not incorporated business and Unpaid family workers (%)
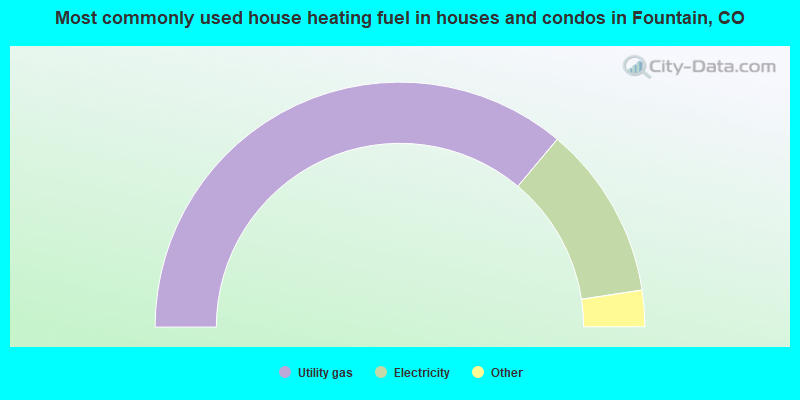
House heating fuel used in houses and condos - Utility gas (%)
House heating fuel used in houses and condos - Bottled, tank, or LP gas (%)
House heating fuel used in houses and condos - Electricity (%)
House heating fuel used in houses and condos - Fuel oil, kerosene, etc. (%)
House heating fuel used in houses and condos - Coal or coke (%)
House heating fuel used in houses and condos - Wood (%)
House heating fuel used in houses and condos - Solar energy (%)
House heating fuel used in houses and condos - Other fuel (%)
House heating fuel used in houses and condos - No fuel used (%)
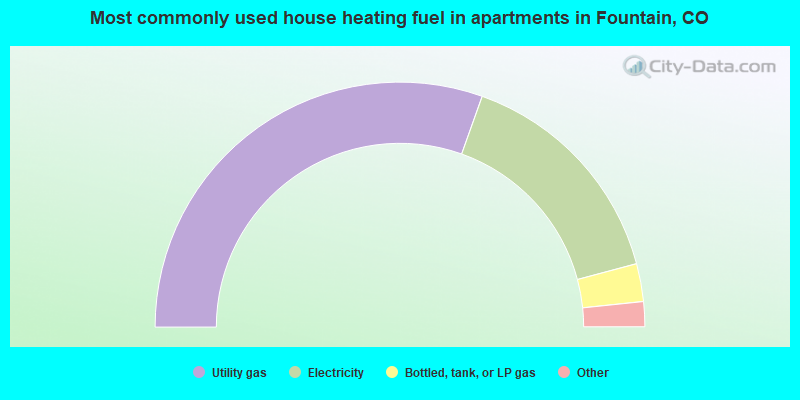
House heating fuel used in apartments - Utility gas (%)
House heating fuel used in apartments - Bottled, tank, or LP gas (%)
House heating fuel used in apartments - Electricity (%)
House heating fuel used in apartments - Fuel oil, kerosene, etc. (%)
House heating fuel used in apartments - Coal or coke (%)
House heating fuel used in apartments - Wood (%)
House heating fuel used in apartments - Solar energy (%)
House heating fuel used in apartments - Other fuel (%)
House heating fuel used in apartments - No fuel used (%)
Armed forces status - In Armed Forces (%)
Armed forces status - Civilian (%)
Armed forces status - Civilian - Veteran (%)
Armed forces status - Civilian - Nonveteran (%)
Fatal accidents locations in years 2005-2021
Fatal accidents locations in 2005
Fatal accidents locations in 2006
Fatal accidents locations in 2007
Fatal accidents locations in 2008
Fatal accidents locations in 2009
Fatal accidents locations in 2010
Fatal accidents locations in 2011
Fatal accidents locations in 2012
Fatal accidents locations in 2013
Fatal accidents locations in 2014
Fatal accidents locations in 2015
Fatal accidents locations in 2016
Fatal accidents locations in 2017
Fatal accidents locations in 2018
Fatal accidents locations in 2019
Fatal accidents locations in 2020
Fatal accidents locations in 2021
Alcohol use - People drinking some alcohol every month (%)
Alcohol use - People not drinking at all (%)
Alcohol use - Average days/month drinking alcohol
Alcohol use - Average drinks/week
Alcohol use - Average days/year people drink much
Audiometry - Average condition of hearing (%)
Audiometry - People that can hear a whisper from across a quiet room (%)
Audiometry - People that can hear normal voice from across a quiet room (%)
Audiometry - Ears ringing, roaring, buzzing (%)
Audiometry - Had a job exposure to loud noise (%)
Audiometry - Had off-work exposure to loud noise (%)
Blood Pressure & Cholesterol - Has high blood pressure (%)
Blood Pressure & Cholesterol - Checking blood pressure at home (%)
Blood Pressure & Cholesterol - Frequently checking blood cholesterol (%)
Blood Pressure & Cholesterol - Has high cholesterol level (%)
Consumer Behavior - Money monthly spent on food at supermarket/grocery store
Consumer Behavior - Money monthly spent on food at other stores
Consumer Behavior - Money monthly spent on eating out
Consumer Behavior - Money monthly spent on carryout/delivered foods
Consumer Behavior - Income spent on food at supermarket/grocery store (%)
Consumer Behavior - Income spent on food at other stores (%)
Consumer Behavior - Income spent on eating out (%)
Consumer Behavior - Income spent on carryout/delivered foods (%)
Current Health Status - General health condition (%)
Current Health Status - Blood donors (%)
Current Health Status - Has blood ever tested for HIV virus (%)
Current Health Status - Left-handed people (%)
Dermatology - People using sunscreen (%)
Diabetes - Diabetics (%)
Diabetes - Had a blood test for high blood sugar (%)
Diabetes - People taking insulin (%)
Diet Behavior & Nutrition - Diet health (%)
Diet Behavior & Nutrition - Milk product consumption (# of products/month)
Diet Behavior & Nutrition - Meals not home prepared (#/week)
Diet Behavior & Nutrition - Meals from fast food or pizza place (#/week)
Diet Behavior & Nutrition - Ready-to-eat foods (#/month)
Diet Behavior & Nutrition - Frozen meals/pizza (#/month)
Drug Use - People that ever used marijuana or hashish (%)
Drug Use - Ever used hard drugs (%)
Drug Use - Ever used any form of cocaine (%)
Drug Use - Ever used heroin (%)
Drug Use - Ever used methamphetamine (%)
Health Insurance - People covered by health insurance (%)
Kidney Conditions-Urology - Avg. # of times urinating at night
Medical Conditions - People with asthma (%)
Medical Conditions - People with anemia (%)
Medical Conditions - People with psoriasis (%)
Medical Conditions - People with overweight (%)
Medical Conditions - Elderly people having difficulties in thinking or remembering (%)
Medical Conditions - People who ever received blood transfusion (%)
Medical Conditions - People having trouble seeing even with glass/contacts (%)
Medical Conditions - People with arthritis (%)
Medical Conditions - People with gout (%)
Medical Conditions - People with congestive heart failure (%)
Medical Conditions - People with coronary heart disease (%)
Medical Conditions - People with angina pectoris (%)
Medical Conditions - People who ever had heart attack (%)
Medical Conditions - People who ever had stroke (%)
Medical Conditions - People with emphysema (%)
Medical Conditions - People with thyroid problem (%)
Medical Conditions - People with chronic bronchitis (%)
Medical Conditions - People with any liver condition (%)
Medical Conditions - People who ever had cancer or malignancy (%)
Mental Health - People who have little interest in doing things (%)
Mental Health - People feeling down, depressed, or hopeless (%)
Mental Health - People who have trouble sleeping or sleeping too much (%)
Mental Health - People feeling tired or having little energy (%)
Mental Health - People with poor appetite or overeating (%)
Mental Health - People feeling bad about themself (%)
Mental Health - People who have trouble concentrating on things (%)
Mental Health - People moving or speaking slowly or too fast (%)
Mental Health - People having thoughts they would be better off dead (%)
Oral Health - Average years since last visit a dentist
Oral Health - People embarrassed because of mouth (%)
Oral Health - People with gum disease (%)
Oral Health - General health of teeth and gums (%)
Oral Health - Average days a week using dental floss/device
Oral Health - Average days a week using mouthwash for dental problem
Oral Health - Average number of teeth
Pesticide Use - Households using pesticides to control insects (%)
Pesticide Use - Households using pesticides to kill weeds (%)
Physical Activity - People doing vigorous-intensity work activities (%)
Physical Activity - People doing moderate-intensity work activities (%)
Physical Activity - People walking or bicycling (%)
Physical Activity - People doing vigorous-intensity recreational activities (%)
Physical Activity - People doing moderate-intensity recreational activities (%)
Physical Activity - Average hours a day doing sedentary activities
Physical Activity - Average hours a day watching TV or videos
Physical Activity - Average hours a day using computer
Physical Functioning - People having limitations keeping them from working (%)
Physical Functioning - People limited in amount of work they can do (%)
Physical Functioning - People that need special equipment to walk (%)
Physical Functioning - People experiencing confusion/memory problems (%)
Physical Functioning - People requiring special healthcare equipment (%)
Prescription Medications - Average number of prescription medicines taking
Preventive Aspirin Use - Adults 40+ taking low-dose aspirin (%)
Reproductive Health - Vaginal deliveries (%)
Reproductive Health - Cesarean deliveries (%)
Reproductive Health - Deliveries resulted in a live birth (%)
Reproductive Health - Pregnancies resulted in a delivery (%)
Reproductive Health - Women breastfeeding newborns (%)
Reproductive Health - Women that had a hysterectomy (%)
Reproductive Health - Women that had both ovaries removed (%)
Reproductive Health - Women that have ever taken birth control pills (%)
Reproductive Health - Women taking birth control pills (%)
Reproductive Health - Women that have ever used Depo-Provera or injectables (%)
Reproductive Health - Women that have ever used female hormones (%)
Sexual Behavior - People 18+ that ever had sex (vaginal, anal, or oral) (%)
Sexual Behavior - Males 18+ that ever had vaginal sex with a woman (%)
Sexual Behavior - Males 18+ that ever performed oral sex on a woman (%)
Sexual Behavior - Males 18+ that ever had anal sex with a woman (%)
Sexual Behavior - Males 18+ that ever had any sex with a man (%)
Sexual Behavior - Females 18+ that ever had vaginal sex with a man (%)
Sexual Behavior - Females 18+ that ever performed oral sex on a man (%)
Sexual Behavior - Females 18+ that ever had anal sex with a man (%)
Sexual Behavior - Females 18+ that ever had any kind of sex with a woman (%)
Sexual Behavior - Average age people first had sex
Sexual Behavior - Average number of female sex partners in lifetime (males 18+)
Sexual Behavior - Average number of female vaginal sex partners in lifetime (males 18+)
Sexual Behavior - Average age people first performed oral sex on a woman (18+)
Sexual Behavior - Average number of woman performed oral sex on in lifetime (18+)
Sexual Behavior - Average number of male sex partners in lifetime (males 18+)
Sexual Behavior - Average number of male anal sex partners in lifetime (males 18+)
Sexual Behavior - Average age people first performed oral sex on a man (18+)
Sexual Behavior - Average number of male oral sex partners in lifetime (18+)
Sexual Behavior - People using protection when performing oral sex (%)
Sexual Behavior - Average number of times people have vaginal or anal sex a year
Sexual Behavior - People having sex without condom (%)
Sexual Behavior - Average number of male sex partners in lifetime (females 18+)
Sexual Behavior - Average number of male vaginal sex partners in lifetime (females 18+)
Sexual Behavior - Average number of female sex partners in lifetime (females 18+)
Sexual Behavior - Circumcised males 18+ (%)
Sleep Disorders - Average hours sleeping at night
Sleep Disorders - People that has trouble sleeping (%)
Smoking-Cigarette Use - People smoking cigarettes (%)
Taste & Smell - People 40+ having problems with smell (%)
Taste & Smell - People 40+ having problems with taste (%)
Taste & Smell - People 40+ that ever had wisdom teeth removed (%)
Taste & Smell - People 40+ that ever had tonsils teeth removed (%)
Taste & Smell - People 40+ that ever had a loss of consciousness because of a head injury (%)
Taste & Smell - People 40+ that ever had a broken nose or other serious injury to face or skull (%)
Taste & Smell - People 40+ that ever had two or more sinus infections (%)
Weight - Average height (inches)
Weight - Average weight (pounds)
Weight - Average BMI
Weight - People that are obese (%)
Weight - People that ever were obese (%)
Weight - People trying to lose weight (%)
16,399 54.8% White alone 8,527 28.5% Hispanic 2,417 8.1% Black alone 1,709 5.7% Two or more races 719 2.4% Asian alone 82 0.3% Native Hawaiian and Other 73 0.2% American Indian alone 25 0.08% Other race alone
Officers per 1,000 residents here:
1.81Colorado average:
2.14
Latest news from Fountain, CO collected exclusively by city-data.com from local newspapers, TV, and radio stations
Fountain, CO City Guides: Ancestries: German (15.1%), American (10.3%), English (4.0%), Irish (3.7%), Italian (2.3%), European (1.7%).
Current Local Time:
Incorporated on 4/23/1903
Land area: 14.0 square miles.
Population density: 2,065 people per square mile (low).
2,117 residents are foreign born (3.8% Latin America , 1.7% Europe , 1.6% Asia ).
This city:
7.1%Colorado:
9.5%
Median real estate property taxes paid for housing units with mortgages in 2022: $1,477 (0.4%)Median real estate property taxes paid for housing units with no mortgage in 2022: $1,227 (0.3%)
Nearest city with pop. 50,000+: Colorado Springs, CO
Nearest city with pop. 1,000,000+: Phoenix, AZ
Nearest cities:
Rock Creek Park, CO (2.7 miles),
Latitude: 38.69 N, Longitude: 104.70 W
Daytime population change due to commuting: -6,934 (-23.2%)Workers who live and work in this city: 2,750 (19.0%)
Unemployment in December 2023:
Population change in the 1990s: +4,138 (+37.4%).
Most common occupations in Fountain, CO (%)
Both Males Females
Material recording, scheduling, dispatching, and distributing workers (5.3%)
Other office and administrative support workers, including supervisors (4.3%)
Driver/sales workers and truck drivers (3.7%)
Electrical equipment mechanics and other installation, maintenance, and repair workers, including supervisors (3.6%)
Other management occupations, except farmers and farm managers (3.3%)
Cashiers (3.3%)
Vehicle and mobile equipment mechanics, installers, and repairers (3.2%)
Driver/sales workers and truck drivers (7.0%)
Electrical equipment mechanics and other installation, maintenance, and repair workers, including supervisors (6.7%)
Vehicle and mobile equipment mechanics, installers, and repairers (6.5%)
Material recording, scheduling, dispatching, and distributing workers (5.9%)
Other management occupations, except farmers and farm managers (4.3%)
Construction traders workers except carpenters, electricians, painters, plumbers, and construction laborers (3.8%)
Other production occupations, including supervisors (3.7%)
Other office and administrative support workers, including supervisors (6.9%)
Information and record clerks, except customer service representatives (5.5%)
Secretaries and administrative assistants (5.1%)
Cashiers (5.0%)
Material recording, scheduling, dispatching, and distributing workers (4.7%)
Child care workers (4.4%)
Health technologists and technicians (4.1%)
Tornado activity:
Fountain-area historical tornado activity is near Colorado state average. It is 33% smaller than the overall U.S. average.
On 6/24/1979, a category F3 (max. wind speeds 158-206 mph) tornado 11.8 miles away from the Fountain city center injured one person and caused between $50,000 and $500,000 in damages.
On 6/13/1977, a category F3 tornado 19.7 miles away from the city center .
Earthquake activity:
Fountain-area historical earthquake activity is significantly above Colorado state average. It is 710% greater than the overall U.S. average. On 8/18/1959 at 06:37:13, a magnitude 7.7 (7.7 UK, Class: Major, Intensity: VIII - XII) earthquake occurred 509.4 miles away from Fountain center, causing $26,000,000 total damage On 8/23/2011 at 05:46:18, a magnitude 5.3 (5.3 MW, Depth: 2.5 mi, Class: Moderate, Intensity: VI - VII) earthquake occurred 112.8 miles away from the city center On 8/10/2005 at 22:08:22, a magnitude 5.0 (5.0 MW, Depth: 3.1 mi) earthquake occurred 121.0 miles away from the city center On 8/10/2005 at 22:08:22, a magnitude 5.0 (5.0 MB, 4.7 MS, 5.0 MW) earthquake occurred 122.7 miles away from the city center On 10/18/1984 at 15:30:23, a magnitude 5.5 (5.4 MB, 5.1 MS, 5.5 ML) earthquake occurred 260.0 miles away from the city center On 8/22/2011 at 23:30:19, a magnitude 4.7 (4.7 MW, Depth: 3.1 mi, Class: Light, Intensity: IV - V) earthquake occurred 115.2 miles away from Fountain center Magnitude types: body-wave magnitude (MB), local magnitude (ML), surface-wave magnitude (MS), moment magnitude (MW) Natural disasters: The number of natural disasters in El Paso County (17) is near the US average (15).Major Disasters (Presidential) Declared: 10Emergencies Declared: 5Floods: 7, Storms: 7, Fires: 4, Landslides: 4, Mudslides: 4, Snows: 2, Tornadoes: 2, Drought: 1, Flash Flood: 1, Heavy Rain: 1, Hurricane: 1, Snowstorm: 1, Other: 1 (Note: some incidents may be assigned to more than one category). Hospitals and medical centers in Fountain: FOUNTAIN DIALYSIS CENTER (DVA) (6910 BANDLEY DR STE 100)
Other hospitals and medical centers near Fountain: A. M. HEALTH, INC. (Home Health Center, about 5 miles away; SECURITY, CO)
ASPEN LIVING CENTER (Nursing Home, about 9 miles away; COLORADO SPRINGS, CO)
HUMAN TOUCH HOME HEALTH CARE AGENCY INC (Home Health Center, about 10 miles away; COLORADO SPRINGS, CO)
CHEYENNE MOUNTAIN CARE AND REHABILITATION CENTER (Nursing Home, about 10 miles away; COLORADO SPRINGS, CO)
LAUREL MANOR CARE CENTER (Nursing Home, about 10 miles away; COLORADO SPRINGS, CO)
MGA HOME HEALTHCARE COLORADO INC (Home Health Center, about 10 miles away; COLORADO SPRINGS, CO)
SOLAMOR HOSPICE OF COLORADO SPRINGS (Hospital, about 10 miles away; COLORADO SPRINGS, CO)
Amtrak station near Fountain: 12 miles: COLORADO SPRINGS (120 S. WEBER) - Bus Station Services: enclosed waiting area, call for taxi service.
Colleges/universities with over 2000 students nearest to Fountain:
Pikes Peak Community College (about 7 miles; Colorado Springs, CO ; Full-time enrollment: 10,395)
Colorado College (about 13 miles; Colorado Springs, CO ; FT enrollment: 2,199)
University of Colorado Colorado Springs (about 15 miles; Colorado Springs, CO ; FT enrollment: 8,700)
Colorado Technical University-Online (about 16 miles; Colorado Springs, CO ; FT enrollment: 22,771)
Colorado Technical University-Colorado Springs (about 16 miles; Colorado Springs, CO ; FT enrollment: 2,049)
United States Air Force Academy (about 25 miles; USAFA, CO ; FT enrollment: 5,088)
Colorado State University-Pueblo (about 28 miles; Pueblo, CO ; FT enrollment: 5,993)
Public high schools in Fountain:
Public elementary/middle schools in Fountain: FOUNTAIN MIDDLE SCHOOL Students: 842, Location: 515 N. SANTE FE, Grades: 6-8)JORDAHL ELEMENTARY SCHOOL Students: 502, Location: 800 PROGRESS DRIVE, Grades: PK-5)JANITELL JUNIOR HIGH SCHOOL Students: 492, Location: 7635 FOUNTAIN MESA ROAD, Grades: 6-8)ARAGON ELEMENTARY SCHOOL Students: 487, Location: 211 SOUTH MAIN STREET, Grades: PK-5)EAGLESIDE ELEMENTARY SCHOOL Students: 380, Location: 9750 SENTRY DRIVE, Grades: PK-5)MESA ELEMENTARY SCHOOL Location: 400 CAMINO DEL REY, Grades: PK-5)
PRAIRIE HEIGHTS ELEMENTARY SCHOOL Location: 7930 INDIAN VILLAGE HEIGHTS, Grades: PK-5)
See full list of schools located in Fountain Birthplace of: Chase Headley - Baseball player.
El Paso County has a predicted average indoor radon screening level greater than 4 pCi/L (pico curies per liter) - Highest Potential Drinking water stations with addresses in Fountain and their reported violations in the past:
FOUNTAIN CITY OF (Population served: 20,000, Purch surface water):
Past health violations:
MCL, Monthly (TCR) - In OCT-2008, Contaminant: Coliform. Follow-up actions: St Public Notif requested (OCT-21-2008), St Violation/Reminder Notice (OCT-21-2008), St Public Notif received (NOV-24-2008), St Compliance achieved (SEP-28-2009)
Past monitoring violations:
Monitoring and Reporting (DBP) - Between JAN-2009 and MAR-2009, Contaminant: Chlorine. Follow-up actions: St Public Notif requested (MAY-08-2009), St Violation/Reminder Notice (MAY-08-2009), St Public Notif received (JUN-30-2009), St Compliance achieved (JUL-07-2009)
Monitoring and Reporting (DBP) - Between OCT-2006 and DEC-2006, Contaminant: Total Haloacetic Acids (HAA5). Follow-up actions: St Violation/Reminder Notice (FEB-12-2007), St Compliance achieved (FEB-27-2007)
Monitoring and Reporting (DBP) - Between OCT-2006 and DEC-2006, Contaminant: TTHM. Follow-up actions: St Violation/Reminder Notice (FEB-12-2007), St Compliance achieved (FEB-27-2007)
One minor monitoring violation
124 regular monitoring violations
Drinking water stations with addresses in Fountain that have no violations reported:
PONDEROSA CG (Population served: 70, Primary Water Source Type: Groundwater)
Average household size: This city:
3.0 peopleColorado:
2.5 people
Percentage of family households: This city:
79.4%Whole state:
63.9%
Percentage of households with unmarried partners: This city:
5.4%Whole state:
6.5%
Likely homosexual households (counted as self-reported same-sex unmarried-partner households)
Lesbian couples: 0.3% of all households Gay men: 0.2% of all households
7 people in other group homes in 2000
Banks with branches in Fountain (2011 data):
U.S. Bank National Association: Fountain Safeway Branch at 6925 Mesa Ridge Parkway, branch established on 2006/10/13. Info updated 2012/01/30: Bank assets: $330,470.8 mil, Deposits: $236,091.5 mil, headquarters in Cincinnati, OH, positive income , 3121 total offices , Holding Company: U.S. Bancorp
Peoples National Bank: Fountain Branch at 6830 Mesa Ridge Parkway, branch established on 2007/08/21. Info updated 2007/12/13: Bank assets: $196.6 mil, Deposits: $148.0 mil, headquarters in Colorado Springs, CO, positive income , Commercial Lending Specialization, 8 total offices , Holding Company: Winter Trust Of 12/3/74
JPMorgan Chase Bank, National Association: Mesa Ridge & Fountain Mesa Banking C at 7780 Fountain Mesa Road, branch established on 2007/10/29. Info updated 2011/11/10: Bank assets: $1,811,678.0 mil, Deposits: $1,190,738.0 mil, headquarters in Columbus, OH, positive income , International Specialization, 5577 total offices , Holding Company: Jpmorgan Chase & Co.
Pikes Peak National Bank: Valley Branch at 6615 Camden Boulevard, branch established on 1995/11/20. Info updated 2006/11/03: Bank assets: $74.4 mil, Deposits: $66.6 mil, headquarters in Colorado Springs, CO, negative income in the last year , Commercial Lending Specialization, 3 total offices , Holding Company: Pikes Peak National Company
Academy Bank, National Association: Hwy 85/87 Branch at 6510 U.S. Highway 85/87, branch established on 2000/04/28. Info updated 2008/06/10: Bank assets: $282.1 mil, Deposits: $218.0 mil, headquarters in Colorado Springs, CO, positive income , Commercial Lending Specialization, 54 total offices , Holding Company: Dickinson Financial Corporation Ii
First State Bank of Colorado: Fountain Branch at 410 South Santa Fe, branch established on 1968/03/11. Info updated 2010/07/09: Bank assets: $179.8 mil, Deposits: $155.0 mil, headquarters in Hotchkiss, CO, positive income , Commercial Lending Specialization, 5 total offices , Holding Company: Custer Bancorp.
For population 15 years and over in Fountain:
Never married: 27.0%Now married: 58.1%Separated: 1.0%Widowed: 2.8%Divorced: 11.1% For population 25 years and over in Fountain:
High school or higher: 95.1%Bachelor's degree or higher: 31.1%Graduate or professional degree: 8.3%Unemployed: 6.3%Mean travel time to work (commute): 23.8 minutes
Education Gini index (Inequality in education) Here:
8.9Colorado average:
11.1
Religion statistics for Fountain, CO (based on El Paso County data)
Religion Adherents Congregations Evangelical Protestant 95,284 265 Catholic 52,310 23 Mainline Protestant 33,697 61 Other 22,775 62 Black Protestant 2,686 11 Orthodox 947 4 None 414,564 -
Source: Clifford Grammich, Kirk Hadaway, Richard Houseal, Dale E.Jones, Alexei Krindatch, Richie Stanley and Richard H.Taylor. 2012. 2010 U.S.Religion Census: Religious Congregations & Membership Study. Association of Statisticians of American Religious Bodies. Jones, Dale E., et al. 2002. Congregations and Membership in the United States 2000. Nashville, TN: Glenmary Research Center. Graphs represent county-level data
Food Environment Statistics: Number of grocery stores : 57This county :
0.97 / 10,000 pop.State :
1.50 / 10,000 pop.
Number of supercenters and club stores : 9This county :
0.15 / 10,000 pop.Colorado :
0.15 / 10,000 pop.
Number of convenience stores (no gas) : 20El Paso County :
0.34 / 10,000 pop.State :
0.45 / 10,000 pop.
Number of convenience stores (with gas) : 168This county :
2.87 / 10,000 pop.State :
3.13 / 10,000 pop.
Number of full-service restaurants : 389El Paso County :
6.64 / 10,000 pop.Colorado :
8.99 / 10,000 pop.
Low-income preschool obesity rate : El Paso County :
7.0%Colorado :
9.6%
Health and Nutrition: Healthy diet rate : Fountain:
48.9%Colorado:
49.4%
Average overall health of teeth and gums : Fountain:
48.0%State:
47.8%
Average BMI : Fountain:
28.9Colorado:
28.5
People feeling badly about themselves : People not drinking alcohol at all : This city:
10.1%State:
9.7%
Average hours sleeping at night : This city:
6.7Colorado:
6.8
Overweight people : Fountain:
34.1%Colorado:
33.3%
General health condition : This city:
57.4%State:
57.3%
Average condition of hearing : Fountain:
81.8%Colorado:
80.2%
More about Health and Nutrition of Fountain, CO Residents
Local government employment and payroll (March 2022)
Function
Full-time employees
Monthly full-time payroll
Average yearly full-time wage
Part-time employees
Monthly part-time payroll
Police Protection - Officers
56 $390,002 $83,572 2 $1,533 Electric Power
47 $354,036 $90,392 2 $7,433 Firefighters
28 $217,748 $93,321 24 $36,615 Other Government Administration
18 $132,994 $88,663 2 $2,790 Other and Unallocable
13 $80,452 $74,263 1 $452 Financial Administration
12 $89,070 $89,070 2 $7,856 Water Supply
12 $82,622 $82,622 2 $1,989 Streets and Highways
9 $46,936 $62,581 0 $0 Police - Other
7 $39,432 $67,598 1 $1,566 Parks and Recreation
6 $32,003 $64,006 16 $4,989 Housing and Community Development (Local)
2 $11,370 $68,220 3 $3,669 Judicial and Legal
2 $7,289 $43,734 0 $0 Fire - Other
2 $12,300 $73,800 0 $0 Transit
0 $0 8 $14,238
Totals for Government
214 $1,496,255 $83,902 63 $83,130
Fountain government finances - Expenditure in 2021 (per resident):
Construction - Housing and Community Development: $2,156,000 ($74.58)
Current Operations - Electric Utilities: $25,387,000 ($878.23)
Police Protection: $8,685,000 ($300.45)Water Utilities: $7,915,000 ($273.81)Local Fire Protection: $6,532,000 ($225.97)General - Other: $3,667,000 ($126.86)Financial Administration: $2,089,000 ($72.27)Regular Highways: $1,933,000 ($66.87)Parks and Recreation: $1,066,000 ($36.88)General Public Buildings: $666,000 ($23.04)Transit Utilities: $661,000 ($22.87)Housing and Community Development: $657,000 ($22.73)Protective Inspection and Regulation - Other: $443,000 ($15.33)Central Staff Services: $299,000 ($10.34)Judicial and Legal Services: $264,000 ($9.13)Miscellaneous Commercial Activities - Other: $43,000 ($1.49)Electric Utilities - Interest on Debt: $2,169,000 ($75.03)
Total Salaries and Wages: $24,517,000 ($848.13)
Transit Utilities - Interest on Debt: $6,000 ($0.21)
Water Utilities - Interest on Debt: $2,915,000 ($100.84)
Fountain government finances - Revenue in 2021 (per resident):
Charges - Other: $862,000 ($29.82)
Housing and Community Development: $451,000 ($15.60)Parks and Recreation: $148,000 ($5.12)Miscellaneous Commercial Activities: $16,000 ($0.55)Federal Intergovernmental - Other: $2,613,000 ($90.39)
Public Welfare: $322,000 ($11.14)Miscellaneous - Fines and Forfeits: $292,000 ($10.10)
Interest Earnings: $141,000 ($4.88)General Revenue - Other: $60,000 ($2.08)Revenue - Electric Utilities: $26,234,000 ($907.53)
Water Utilities: $12,064,000 ($417.34)Transit Utilities: $1,271,000 ($43.97)State Intergovernmental - Highways: $794,000 ($27.47)
Tax - General Sales and Gross Receipts: $20,989,000 ($726.09)
Property: $2,835,000 ($98.07)Other License: $2,165,000 ($74.90)Other Selective Sales: $383,000 ($13.25)Occupation and Business License - Other: $146,000 ($5.05)
Fountain government finances - Debt in 2021 (per resident):
Long Term Debt - Beginning Outstanding - Unspecified Public Purpose: $127,229,000 ($4401.32)
Outstanding Unspecified Public Purpose: $123,165,000 ($4260.73)Retired Unspecified Public Purpose: $13,063,000 ($451.90)Issue, Unspecified Public Purpose: $9,000,000 ($311.34)
Fountain government finances - Cash and Securities in 2021 (per resident):
Bond Funds - Cash and Securities: $4,446,000 ($153.80)
Other Funds - Cash and Securities: $38,403,000 ($1328.50)
Sinking Funds - Cash and Securities: $4,764,000 ($164.80)
9.81% of this county's 2021 resident taxpayers lived in other counties in 2020 ($64,463 average adjusted gross income )
Here:
9.81%Colorado average:
11.28%
0.28% of residents moved from foreign countries ($1,844 average AGI )El Paso County:
0.28%Colorado average:
0.05%
Top counties from which taxpayers relocated into this county between 2020 and 2021:
9.66% of this county's 2020 resident taxpayers moved to other counties in 2021 ($62,154 average adjusted gross income )
Here:
9.66%Colorado average:
11.05%
0.19% of residents moved to foreign countries ($1,409 average AGI )El Paso County:
0.19%Colorado average:
0.03%
Top counties to which taxpayers relocated from this county between 2020 and 2021:
Businesses in Fountain, CO
Name Count Name Count
7-Eleven 2 Papa John's Pizza 1 AT&T 1 Payless 1 Advance Auto Parts 1 Pizza Hut 1 Applebee's 1 Popeyes 1 AutoZone 1 RadioShack 1 Big O Tires 1 SONIC Drive-In 1 Blockbuster 1 Safeway 1 Burger King 1 Starbucks 1 Carl\s Jr. 1 Subway 5 DHL 1 Super 8 1 Dairy Queen 1 T-Mobile 2 Domino's Pizza 1 Taco Bell 2 FedEx 3 U-Haul 3 Goodwill 3 UPS 2 H&R Block 2 Vons 1 Jack In The Box 1 Walgreens 1 Kroger 2 Walmart 1 Little Caesars Pizza 1 Wendy's 1 Lowe's 1 YMCA 1 McDonald's 2
Strongest AM radio stations in Fountain:
KWYD (1580 AM; 10 kW; COLORADO SPRINGS, CO; Owner: PILGRIM COMMUNICATIONS, INC.)
KCBR (1040 AM; daytime; 15 kW; MONUMENT, CO; Owner: KLZ RADIO, INC.)
KCMN (1530 AM; 15 kW; COLORADO SPRINGS, CO)
KKCS (1460 AM; 5 kW; COLORADO SPRINGS, CO; Owner: WALTON STATIONS - COLORADO, INC.)
KBZC (1300 AM; 5 kW; COLORADO SPRINGS, CO; Owner: CITADEL BROADCASTING COMPANY)
KOA (850 AM; 50 kW; DENVER, CO; Owner: JACOR BROADCASTING OF COLORADO, INC.)
KMXA (1090 AM; 50 kW; AURORA, CO; Owner: ENTRAVISION HOLDINGS, LLC)
KLTT (670 AM; 50 kW; COMMERCE CITY, CO; Owner: KLZ RADIO, INC.)
KKZN (760 AM; 50 kW; THORNTON, CO; Owner: JACOR BROADCASTING OF COLORADO, INC.)
KVOR (740 AM; 3 kW; COLORADO SPRINGS, CO; Owner: CITADEL BROADCASTING COMPANY)
KRDO (1240 AM; 1 kW; COLORADO SPRINGS, CO; Owner: THE PIKES PEAK BROADCASTING CO.)
KGHF (1350 AM; 5 kW; PUEBLO, CO; Owner: CLEAR CHANNEL BROADCASTING LICENSES, INC.)
KCUV (1510 AM; 25 kW; LITTLETON, CO; Owner: PEOPLE WIRELESS, INC.)
Strongest FM radio stations in Fountain:
KKFM (98.1 FM; COLORADO SPRINGS, CO; Owner: CITADEL BROADCASTING COMPANY)
KKCS-FM (101.9 FM; COLORADO SPRINGS, CO; Owner: WALTON STATIONS - COLORADO, INC.)
KBIQ (102.7 FM; MANITOU SPRINGS, CO; Owner: BISON MEDIA, INC.)
KRCC (91.5 FM; COLORADO SPRINGS, CO; Owner: THE COLORADO COLLEGE)
KSKX (105.5 FM; SECURITY, CO; Owner: OPTIMA COMMUNICATIONS, INC.)
KGFT (100.7 FM; PUEBLO, CO; Owner: BISON MEDIA, INC)
KTLF (90.5 FM; COLORADO SPRINGS, CO; Owner: EDUCATIONAL COMMUNICATIONS OF COLORADO SPRINGS, INC.)
KKLI (106.3 FM; WIDEFIELD, CO; Owner: CAPSTAR TX LIMITED PARTNERSHIP)
KMOM (96.1 FM; FOUNTAIN, CO; Owner: AMFM TEXAS LICENSES LIMITED PARTNERSHIP)
KCME (88.7 FM; MANITOU SPRINGS, CO; Owner: CHEYENNE MOUNTAIN PUBLIC BROADCAST HOUSE, INC)
KSPZ (92.9 FM; COLORADO SPRINGS, CO; Owner: CITADEL BROADCASTING COMPANY)
KVUU (99.9 FM; PUEBLO, CO; Owner: CAPSTAR TX LIMITED PARTNERSHIP)
KRDO-FM (95.1 FM; COLORADO SPRINGS, CO; Owner: THE PIKES PEAK BROADCASTING CO.)
KILO (94.3 FM; COLORADO SPRINGS, CO; Owner: COLORADO SPRINGS RADIO BCSTERS, INC.)
KEPC (89.7 FM; COLORADO SPRINGS, CO; Owner: PIKES PEAK COMMUNITY COLLEGE)
KKMG (98.9 FM; PUEBLO, CO; Owner: CITADEL BROADCASTING COMPANY)
KCCY (96.9 FM; PUEBLO, CO; Owner: CAPSTAR TX LIMITED PARTNERSHIP)
KYZX (103.9 FM; PUEBLO WEST, CO; Owner: COLORADO SPRINGS RADIO B/CASTRS, INC)
KTLC (89.1 FM; CANON CITY, CO; Owner: MAKE A DIFFERENCE FOUNDATION, INC.)
K203AT (88.5 FM; WESTCLIFFE, ETC., CO; Owner: THE COLORADO COLLEGE)
TV broadcast stations around Fountain:
KKTV (Channel 11; COLORADO SPRINGS, CO; Owner: GRAY MIDAMERICA TV LICENSEE CORP.)
KTSC (Channel 8; PUEBLO, CO; Owner: ROCKY MOUNTAIN PUBLIC BROADCASTING NETWORK, INC.)
KGHB-CA (Channel 27; PUEBLO, ETC., CO; Owner: ENTRAVISION HOLDINGS, LLC)
K23GJ (Channel 23; COLORADO SPRINGS, CO; Owner: SYNCOM MEDIA GROUP, INC.)
KRDO-TV (Channel 13; COLORADO SPRINGS, CO; Owner: THE PIKES PEAK BROADCASTING COMPANY)
KXRM-TV (Channel 21; COLORADO SPRINGS, CO; Owner: RAYCOM NATIONAL, INC.)
K49CJ (Channel 49; COLORADO SPRINGS, CO; Owner: TELEMUNDO OF COLORADO SPRINGS, INC.)
KJCS-LP (Channel 38; COLORADO SPRINGS, CO; Owner: BETA BROADCASTING, INC.)
K63DW (Channel 63; COLORADO SPRINGS, CO; Owner: ROCKY MTN.PUB.B/CING.NETWORK,INC.)
K30AA (Channel 30; COLORADO SPRINGS, CO; Owner: SANGRE DE CRISTO COMMUNICATIONS, INC.)
K43CG (Channel 43; COLORADO SPRINGS, CO; Owner: FULL GOSPEL OUTREACH, INC.)
KXTU-LP (Channel 57; COLORADO SPRINGS, CO; Owner: RAYCOM NATIONAL, INC.)
KWHS-LP (Channel 51; COLORADO SPRINGS, CO; Owner: LE SEA BROADCASTING CORPORATION)
K32EO (Channel 32; COLORADO SPRINGS, CO; Owner: FRONT RANGE EDUCATIONAL MEDIA CORP.)
National Bridge Inventory (NBI) Statistics 47 Number of bridges630ft / 192m Total length $1,668,000 Total costs698,112 Total average daily traffic56,270 Total average daily truck traffic
New bridges - historical statistics
2 1920-1929 2 1930-1939 17 1950-1959 4 1960-1969 4 1970-1979 2 1980-1989 6 1990-1999 8 2000-2009 2 2010-2019
See full National Bridge Inventory statistics for Fountain, CO
Home Mortgage Disclosure Act Aggregated Statistics For Year 2009(Based on 9 partial tracts) A) FHA, FSA/RHS & VA B) Conventional C) Refinancings D) Home Improvement Loans F) Non-occupant Loans on G) Loans On Manufactured Number Average Value Number Average Value Number Average Value Number Average Value Number Average Value Number Average Value
LOANS ORIGINATED 159 $168,685 25 $112,389 279 $176,002 11 $23,319 23 $113,077 7 $92,337 APPLICATIONS APPROVED, NOT ACCEPTED 9 $146,411 2 $91,675 29 $162,221 1 $7,840 2 $92,650 2 $96,700 APPLICATIONS DENIED 16 $150,109 5 $90,886 80 $148,109 18 $26,982 7 $109,446 2 $75,185 APPLICATIONS WITHDRAWN 19 $159,723 5 $111,160 56 $165,995 3 $64,377 4 $88,965 1 $68,030 FILES CLOSED FOR INCOMPLETENESS 2 $136,070 0 $0 13 $174,123 0 $0 0 $0 0 $0
Aggregated Statistics For Year 2008(Based on 9 partial tracts) A) FHA, FSA/RHS & VA B) Conventional C) Refinancings D) Home Improvement Loans F) Non-occupant Loans on G) Loans On Manufactured Number Average Value Number Average Value Number Average Value Number Average Value Number Average Value Number Average Value
LOANS ORIGINATED 121 $174,435 37 $122,900 155 $163,524 24 $26,877 27 $99,718 5 $94,920 APPLICATIONS APPROVED, NOT ACCEPTED 9 $153,637 8 $123,726 29 $167,946 7 $22,223 6 $101,238 1 $104,570 APPLICATIONS DENIED 19 $146,884 13 $76,822 143 $153,331 50 $28,942 16 $129,637 4 $48,720 APPLICATIONS WITHDRAWN 12 $177,576 4 $150,445 47 $165,210 4 $53,662 6 $124,800 1 $75,830 FILES CLOSED FOR INCOMPLETENESS 3 $199,557 1 $119,880 9 $140,553 1 $66,270 2 $175,005 0 $0
Aggregated Statistics For Year 2007(Based on 9 partial tracts) A) FHA, FSA/RHS & VA B) Conventional C) Refinancings D) Home Improvement Loans E) Loans on Dwellings For 5+ Families F) Non-occupant Loans on G) Loans On Manufactured Number Average Value Number Average Value Number Average Value Number Average Value Number Average Value Number Average Value Number Average Value
LOANS ORIGINATED 115 $187,782 121 $134,801 185 $133,239 40 $33,302 0 $0 45 $111,127 11 $85,367 APPLICATIONS APPROVED, NOT ACCEPTED 7 $193,720 16 $122,791 46 $134,029 9 $44,379 0 $0 10 $116,353 2 $89,030 APPLICATIONS DENIED 16 $180,588 40 $117,603 250 $138,241 44 $37,593 0 $0 35 $118,823 6 $76,607 APPLICATIONS WITHDRAWN 15 $186,811 18 $147,104 100 $138,162 6 $93,750 1 $106,470 8 $139,162 1 $81,330 FILES CLOSED FOR INCOMPLETENESS 4 $257,418 7 $134,851 19 $139,646 2 $76,020 0 $0 2 $140,010 1 $101,450
Aggregated Statistics For Year 2006(Based on 9 partial tracts) A) FHA, FSA/RHS & VA B) Conventional C) Refinancings D) Home Improvement Loans E) Loans on Dwellings For 5+ Families F) Non-occupant Loans on G) Loans On Manufactured Number Average Value Number Average Value Number Average Value Number Average Value Number Average Value Number Average Value Number Average Value
LOANS ORIGINATED 130 $190,830 249 $109,810 288 $117,022 44 $34,382 1 $242,750 101 $107,919 9 $107,861 APPLICATIONS APPROVED, NOT ACCEPTED 7 $203,539 38 $102,816 76 $127,263 19 $50,434 0 $0 20 $120,184 3 $30,010 APPLICATIONS DENIED 14 $161,456 74 $103,636 293 $137,059 69 $41,501 0 $0 34 $112,570 7 $68,116 APPLICATIONS WITHDRAWN 23 $195,990 54 $107,322 185 $138,423 11 $68,735 0 $0 20 $112,096 2 $116,845 FILES CLOSED FOR INCOMPLETENESS 2 $209,350 8 $117,086 24 $151,794 2 $52,945 0 $0 4 $123,298 0 $0
Aggregated Statistics For Year 2005(Based on 9 partial tracts) A) FHA, FSA/RHS & VA B) Conventional C) Refinancings D) Home Improvement Loans E) Loans on Dwellings For 5+ Families F) Non-occupant Loans on G) Loans On Manufactured Number Average Value Number Average Value Number Average Value Number Average Value Number Average Value Number Average Value Number Average Value
LOANS ORIGINATED 170 $186,169 315 $100,252 310 $112,276 39 $38,993 2 $2,382,090 93 $107,373 9 $83,969 APPLICATIONS APPROVED, NOT ACCEPTED 10 $197,637 52 $90,058 58 $113,744 14 $37,504 0 $0 16 $91,944 3 $47,050 APPLICATIONS DENIED 22 $181,931 83 $97,907 285 $130,806 78 $30,024 0 $0 29 $126,151 18 $73,061 APPLICATIONS WITHDRAWN 17 $182,371 60 $106,272 189 $135,521 13 $116,264 0 $0 23 $99,531 4 $118,970 FILES CLOSED FOR INCOMPLETENESS 0 $0 11 $95,065 49 $134,439 0 $0 0 $0 8 $104,018 0 $0
Aggregated Statistics For Year 2004(Based on 9 partial tracts) A) FHA, FSA/RHS & VA B) Conventional C) Refinancings D) Home Improvement Loans E) Loans on Dwellings For 5+ Families F) Non-occupant Loans on G) Loans On Manufactured Number Average Value Number Average Value Number Average Value Number Average Value Number Average Value Number Average Value Number Average Value
LOANS ORIGINATED 123 $159,983 176 $98,969 372 $121,586 32 $41,870 2 $317,795 60 $109,629 9 $98,400 APPLICATIONS APPROVED, NOT ACCEPTED 5 $155,708 25 $97,966 79 $123,308 11 $71,458 1 $170,350 7 $101,499 2 $113,965 APPLICATIONS DENIED 20 $139,284 58 $87,548 257 $122,759 56 $27,246 0 $0 14 $109,093 13 $68,338 APPLICATIONS WITHDRAWN 15 $166,994 31 $115,839 154 $123,338 12 $43,660 0 $0 11 $98,624 3 $102,563 FILES CLOSED FOR INCOMPLETENESS 3 $185,500 8 $94,051 49 $129,743 2 $37,355 0 $0 2 $128,780 0 $0
Aggregated Statistics For Year 2003(Based on 9 partial tracts) A) FHA, FSA/RHS & VA B) Conventional C) Refinancings D) Home Improvement Loans E) Loans on Dwellings For 5+ Families F) Non-occupant Loans on Number Average Value Number Average Value Number Average Value Number Average Value Number Average Value Number Average Value
LOANS ORIGINATED 133 $154,405 119 $111,609 594 $115,101 23 $18,205 1 $565,710 65 $109,621 APPLICATIONS APPROVED, NOT ACCEPTED 3 $168,090 16 $106,600 81 $118,869 7 $19,309 0 $0 11 $104,886 APPLICATIONS DENIED 14 $137,368 42 $88,825 244 $111,113 39 $17,952 0 $0 14 $102,924 APPLICATIONS WITHDRAWN 15 $152,752 19 $99,991 150 $119,237 8 $16,599 0 $0 8 $100,139 FILES CLOSED FOR INCOMPLETENESS 1 $175,440 7 $88,946 27 $108,796 1 $17,970 0 $0 1 $141,490
Aggregated Statistics For Year 2002(Based on 7 partial tracts) A) FHA, FSA/RHS & VA B) Conventional C) Refinancings D) Home Improvement Loans E) Loans on Dwellings For 5+ Families F) Non-occupant Loans on Number Average Value Number Average Value Number Average Value Number Average Value Number Average Value Number Average Value
LOANS ORIGINATED 112 $144,771 71 $111,915 334 $108,626 33 $23,936 4 $998,688 45 $104,801 APPLICATIONS APPROVED, NOT ACCEPTED 4 $138,398 15 $85,433 64 $103,495 3 $25,313 0 $0 4 $103,882 APPLICATIONS DENIED 13 $138,655 23 $82,410 169 $100,521 41 $21,943 1 $1,122,900 8 $93,386 APPLICATIONS WITHDRAWN 14 $153,969 16 $97,498 124 $111,074 5 $24,516 0 $0 6 $89,917 FILES CLOSED FOR INCOMPLETENESS 1 $171,470 7 $96,623 34 $99,726 0 $0 0 $0 2 $58,155
Aggregated Statistics For Year 2001(Based on 7 partial tracts) A) FHA, FSA/RHS & VA B) Conventional C) Refinancings D) Home Improvement Loans E) Loans on Dwellings For 5+ Families F) Non-occupant Loans on Number Average Value Number Average Value Number Average Value Number Average Value Number Average Value Number Average Value
LOANS ORIGINATED 173 $139,315 79 $106,268 282 $97,556 45 $21,351 3 $684,247 29 $97,376 APPLICATIONS APPROVED, NOT ACCEPTED 8 $123,822 15 $66,009 39 $92,099 2 $13,525 0 $0 2 $107,855 APPLICATIONS DENIED 13 $132,382 53 $58,165 185 $83,192 42 $17,817 0 $0 8 $86,845 APPLICATIONS WITHDRAWN 18 $152,412 14 $131,265 130 $100,457 10 $31,125 0 $0 7 $95,730 FILES CLOSED FOR INCOMPLETENESS 1 $142,280 5 $87,172 19 $87,868 1 $21,780 0 $0 2 $91,750
Aggregated Statistics For Year 2000(Based on 7 partial tracts) A) FHA, FSA/RHS & VA B) Conventional C) Refinancings D) Home Improvement Loans E) Loans on Dwellings For 5+ Families F) Non-occupant Loans on Number Average Value Number Average Value Number Average Value Number Average Value Number Average Value Number Average Value
LOANS ORIGINATED 132 $122,900 73 $90,999 118 $78,719 46 $23,836 2 $789,300 25 $82,386 APPLICATIONS APPROVED, NOT ACCEPTED 4 $83,342 16 $77,153 26 $79,483 22 $23,610 0 $0 2 $78,915 APPLICATIONS DENIED 15 $120,303 59 $56,365 109 $66,883 43 $18,609 0 $0 5 $52,030 APPLICATIONS WITHDRAWN 7 $105,680 15 $90,167 49 $84,713 8 $53,321 0 $0 2 $75,845 FILES CLOSED FOR INCOMPLETENESS 1 $97,950 1 $139,830 21 $90,694 1 $17,420 0 $0 0 $0
Aggregated Statistics For Year 1999(Based on 7 partial tracts) A) FHA, FSA/RHS & VA B) Conventional C) Refinancings D) Home Improvement Loans E) Loans on Dwellings For 5+ Families F) Non-occupant Loans on Number Average Value Number Average Value Number Average Value Number Average Value Number Average Value Number Average Value
LOANS ORIGINATED 127 $116,199 70 $78,561 183 $74,688 47 $19,746 3 $442,990 24 $82,236 APPLICATIONS APPROVED, NOT ACCEPTED 4 $106,805 19 $64,021 46 $71,545 15 $16,454 0 $0 4 $65,815 APPLICATIONS DENIED 17 $126,275 81 $54,631 124 $71,304 53 $19,524 0 $0 6 $79,770 APPLICATIONS WITHDRAWN 11 $103,848 18 $75,703 69 $83,470 4 $46,798 0 $0 4 $79,275 FILES CLOSED FOR INCOMPLETENESS 6 $126,337 1 $79,000 13 $81,981 3 $25,247 0 $0 1 $42,270
Detailed HMDA statistics for the following Tracts:
0045.01
, 0045.03 , 0045.06 , 0045.07 , 0045.08 , 0045.09
Private Mortgage Insurance Companies Aggregated Statistics For Year 2009(Based on 9 partial tracts) A) Conventional B) Refinancings Number Average Value Number Average Value
LOANS ORIGINATED 4 $178,485 6 $181,362 APPLICATIONS APPROVED, NOT ACCEPTED 1 $188,380 1 $218,310 APPLICATIONS DENIED 1 $224,220 5 $122,726 APPLICATIONS WITHDRAWN 0 $0 0 $0 FILES CLOSED FOR INCOMPLETENESS 0 $0 0 $0
Aggregated Statistics For Year 2008(Based on 9 partial tracts) A) Conventional B) Refinancings C) Non-occupant Loans on Number Average Value Number Average Value Number Average Value
LOANS ORIGINATED 16 $149,642 15 $165,962 5 $117,746 APPLICATIONS APPROVED, NOT ACCEPTED 7 $169,351 6 $147,268 2 $108,315 APPLICATIONS DENIED 3 $85,260 1 $248,030 3 $97,253 APPLICATIONS WITHDRAWN 1 $79,540 1 $106,890 0 $0 FILES CLOSED FOR INCOMPLETENESS 1 $152,120 0 $0 1 $106,470
Aggregated Statistics For Year 2007(Based on 9 partial tracts) A) Conventional B) Refinancings C) Non-occupant Loans on Number Average Value Number Average Value Number Average Value
LOANS ORIGINATED 42 $162,054 30 $159,664 5 $147,096 APPLICATIONS APPROVED, NOT ACCEPTED 3 $215,757 3 $156,437 0 $0 APPLICATIONS DENIED 0 $0 1 $197,610 1 $122,110 APPLICATIONS WITHDRAWN 3 $177,240 1 $190,790 0 $0 FILES CLOSED FOR INCOMPLETENESS 1 $136,640 0 $0 0 $0
Aggregated Statistics For Year 2006(Based on 9 partial tracts) A) Conventional B) Refinancings C) Non-occupant Loans on Number Average Value Number Average Value Number Average Value
LOANS ORIGINATED 16 $150,699 16 $170,035 3 $131,003 APPLICATIONS APPROVED, NOT ACCEPTED 1 $185,120 7 $160,866 0 $0 APPLICATIONS DENIED 0 $0 0 $0 0 $0 APPLICATIONS WITHDRAWN 0 $0 2 $160,620 0 $0 FILES CLOSED FOR INCOMPLETENESS 0 $0 0 $0 0 $0
Aggregated Statistics For Year 2005(Based on 9 partial tracts) A) Conventional B) Refinancings C) Non-occupant Loans on D) Loans On Manufactured Number Average Value Number Average Value Number Average Value Number Average Value
LOANS ORIGINATED 14 $150,219 23 $141,869 2 $119,675 1 $116,080 APPLICATIONS APPROVED, NOT ACCEPTED 1 $184,210 3 $181,687 1 $67,310 0 $0 APPLICATIONS DENIED 1 $81,990 1 $103,630 0 $0 1 $76,660 APPLICATIONS WITHDRAWN 0 $0 2 $115,800 0 $0 0 $0 FILES CLOSED FOR INCOMPLETENESS 0 $0 0 $0 0 $0 0 $0
Aggregated Statistics For Year 2004(Based on 9 partial tracts) A) Conventional B) Refinancings C) Non-occupant Loans on Number Average Value Number Average Value Number Average Value
LOANS ORIGINATED 19 $134,468 33 $137,707 5 $93,076 APPLICATIONS APPROVED, NOT ACCEPTED 3 $122,390 8 $136,488 0 $0 APPLICATIONS DENIED 1 $143,380 0 $0 0 $0 APPLICATIONS WITHDRAWN 1 $118,390 4 $123,235 0 $0 FILES CLOSED FOR INCOMPLETENESS 0 $0 1 $95,790 0 $0
Aggregated Statistics For Year 2003(Based on 9 partial tracts) A) Conventional B) Refinancings C) Non-occupant Loans on Number Average Value Number Average Value Number Average Value
LOANS ORIGINATED 25 $129,337 61 $129,681 10 $101,247 APPLICATIONS APPROVED, NOT ACCEPTED 5 $130,722 15 $132,640 1 $92,790 APPLICATIONS DENIED 1 $75,200 1 $204,890 1 $64,200 APPLICATIONS WITHDRAWN 4 $108,805 3 $102,100 3 $80,763 FILES CLOSED FOR INCOMPLETENESS 0 $0 0 $0 0 $0
Aggregated Statistics For Year 2002(Based on 7 partial tracts) A) Conventional B) Refinancings C) Non-occupant Loans on Number Average Value Number Average Value Number Average Value
LOANS ORIGINATED 19 $135,515 38 $127,205 4 $125,088 APPLICATIONS APPROVED, NOT ACCEPTED 1 $226,130 8 $143,360 1 $184,390 APPLICATIONS DENIED 0 $0 1 $75,830 0 $0 APPLICATIONS WITHDRAWN 1 $73,820 4 $132,068 0 $0 FILES CLOSED FOR INCOMPLETENESS 1 $107,840 0 $0 1 $76,660
Aggregated Statistics For Year 2001(Based on 7 partial tracts) A) Conventional B) Refinancings C) Non-occupant Loans on Number Average Value Number Average Value Number Average Value
LOANS ORIGINATED 28 $128,338 31 $114,846 6 $105,843 APPLICATIONS APPROVED, NOT ACCEPTED 5 $95,856 3 $102,157 1 $83,280 APPLICATIONS DENIED 1 $201,380 1 $171,550 0 $0 APPLICATIONS WITHDRAWN 1 $145,060 0 $0 1 $85,180 FILES CLOSED FOR INCOMPLETENESS 0 $0 0 $0 0 $0
Aggregated Statistics For Year 2000(Based on 7 partial tracts) A) Conventional B) Refinancings C) Non-occupant Loans on Number Average Value Number Average Value Number Average Value
LOANS ORIGINATED 23 $111,450 10 $101,504 4 $135,672 APPLICATIONS APPROVED, NOT ACCEPTED 3 $86,837 3 $73,037 1 $60,940 APPLICATIONS DENIED 2 $116,715 1 $92,980 0 $0 APPLICATIONS WITHDRAWN 1 $93,770 0 $0 0 $0 FILES CLOSED FOR INCOMPLETENESS 1 $117,450 0 $0 1 $93,690
Aggregated Statistics For Year 1999(Based on 7 partial tracts) A) Conventional B) Refinancings C) Non-occupant Loans on Number Average Value Number Average Value Number Average Value
LOANS ORIGINATED 12 $110,420 15 $99,317 4 $114,125 APPLICATIONS APPROVED, NOT ACCEPTED 3 $104,150 5 $92,578 2 $107,025 APPLICATIONS DENIED 4 $143,212 4 $105,438 1 $212,480 APPLICATIONS WITHDRAWN 2 $84,725 0 $0 1 $157,640 FILES CLOSED FOR INCOMPLETENESS 0 $0 0 $0 0 $0
Detailed PMIC statistics for the following Tracts:
0045.01
, 0045.03 , 0045.06 , 0045.07 , 0045.08 , 0045.09
Most common first names in Fountain, CO among deceased individuals Name Count Lived (average)
John 37 69.0 years Robert 33 65.9 years Mary 32 73.7 years William 30 70.9 years James 24 70.0 years Charles 22 72.1 years George 20 69.1 years Donald 13 66.2 years Margaret 12 76.7 years Joe 11 71.7 years
Most common last names in Fountain, CO among deceased individuals Last name Count Lived (average)
Smith 15 69.1 years Brown 11 72.8 years Martinez 9 81.4 years Johnson 9 74.1 years Trujillo 9 70.7 years Davis 8 71.0 years Miller 7 78.7 years Ryan 6 67.0 years Christian 6 69.5 years Wilson 6 74.7 years
Fountain compared to Colorado state average:
Unemployed percentage below state average. Black race population percentage significantly above state average. Hispanic race population percentage above state average. Median age significantly below state average. House age below state average. Number of college students above state average.
#77 on the list of "Top 101 cities with largest percentage of males in occupations: fire fighting and prevention workers including supervisors (population 5,000+)"
#77 on the list of "Top 101 cities with largest percentage of males in industries: public administration (population 5,000+)"
#96 on the list of "Top 101 cities with largest percentage of females in industries: public administration (population 5,000+)"
#30 on the list of "Top 101 counties with the highest percentage of residents relocating from foreign countries between 2010 and 2011 (pop. 50,000+)"
#32 on the list of "Top 101 counties with the lowest average weight of females"
#39 on the list of "Top 101 counties with the highest percentage of residents that exercised in the past month"
#42 on the list of "Top 101 counties with the highest percentage of residents relocating to foreign countries in 2011 (pop. 50,000+)"
#43 on the list of "Top 101 counties with the highest Particulate Matter (PM10 ) Annual air pollution readings in 2012 (µg/m3 )"
Top Patent Applicants
Michael Stevens (11)
Mazy Shambayati (2)
Jason Davidson (2)
Matthew Haggart (1)
Michael Scotina (1)
Raymond Ivy (1)
Ubai Ka'Ab Abu-Bakr (1)
Travis Michelena (1)
Jose Manuel Pimentel Serrano (1)
Dan Elliott (1)
Total of 20 patent applications in 2008-2024.

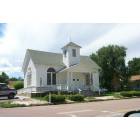
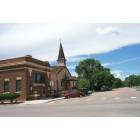
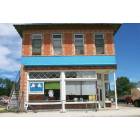
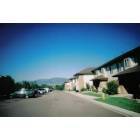
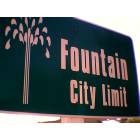
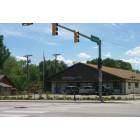
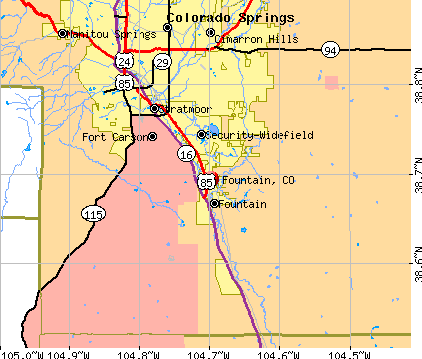


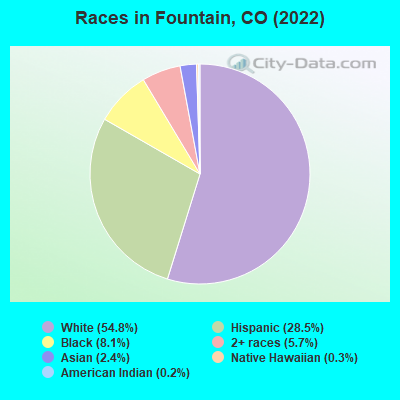
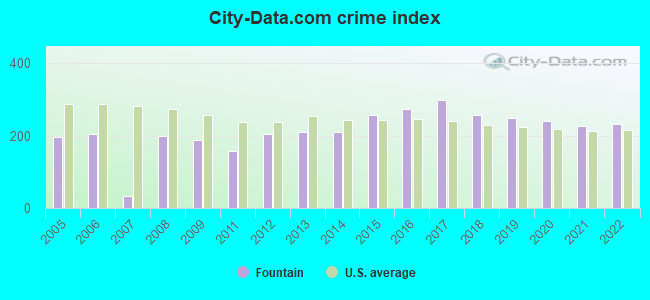
 Recent articles from our blog. Our writers, many of them Ph.D. graduates or candidates, create easy-to-read articles on a wide variety of topics.

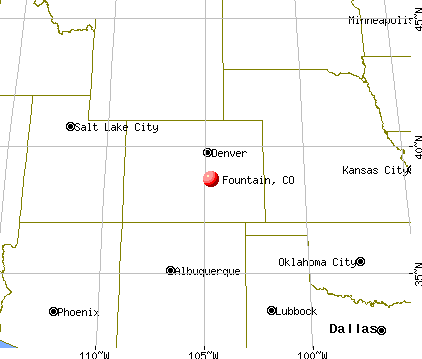
 (12.8 miles
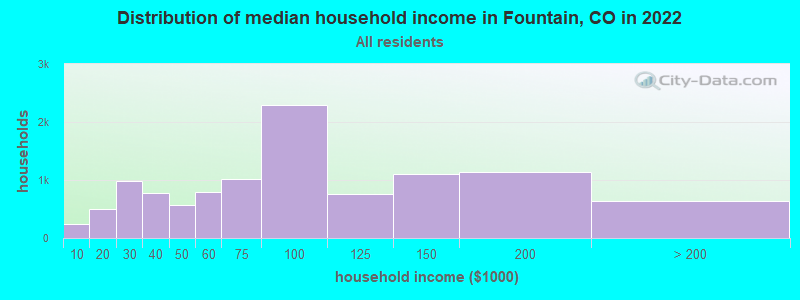
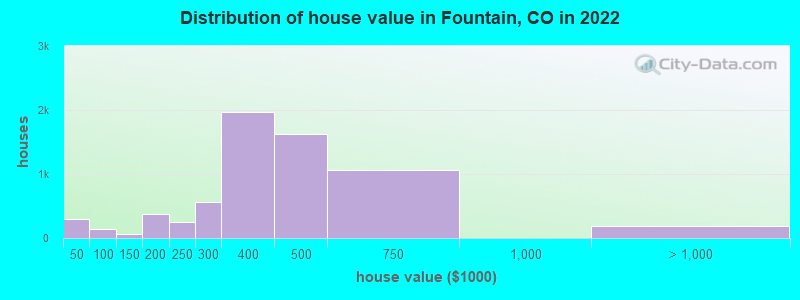
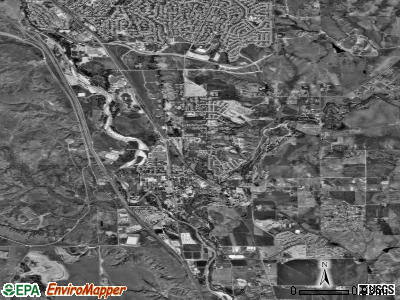
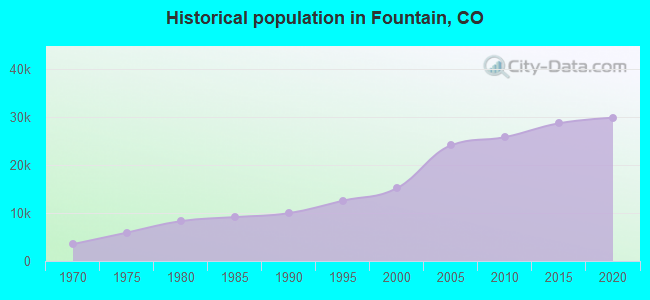
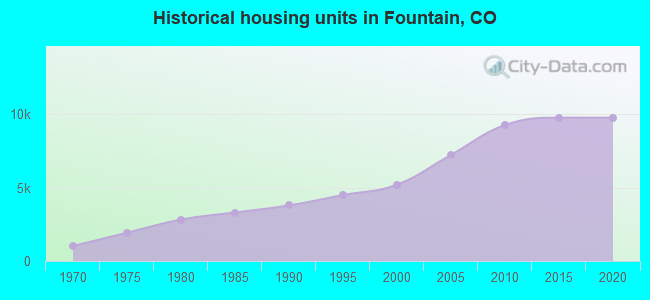
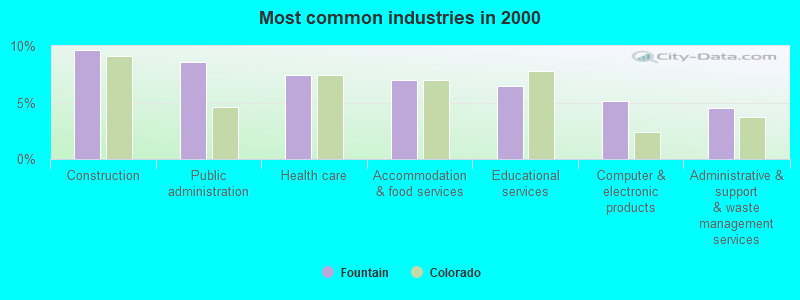
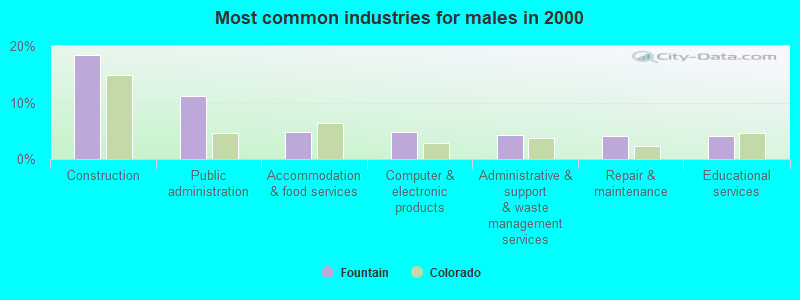
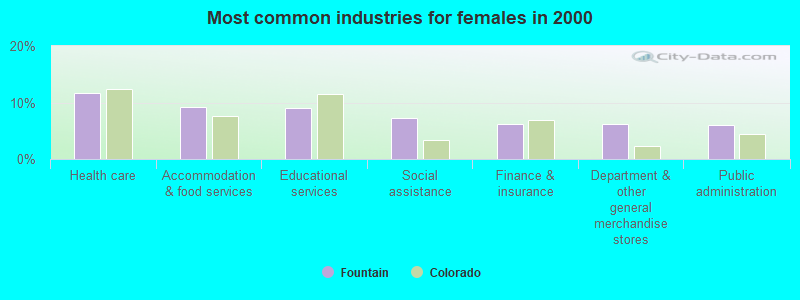
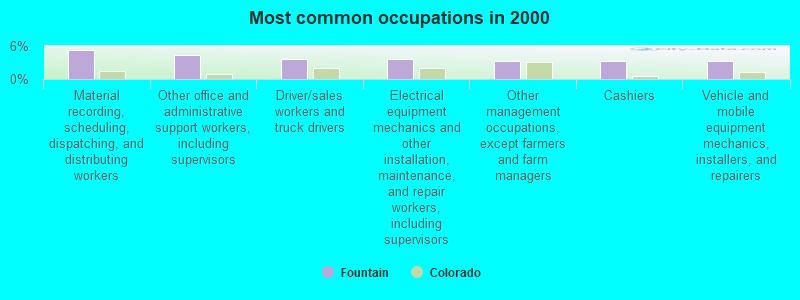
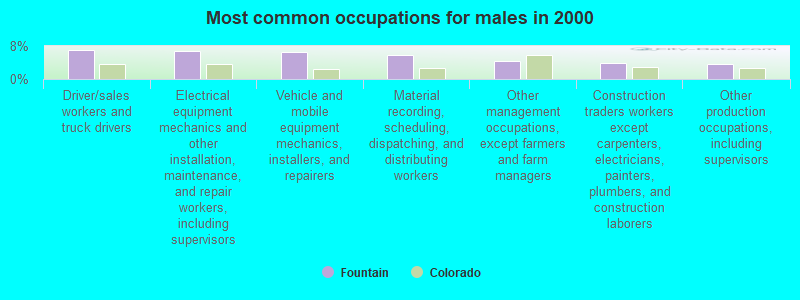
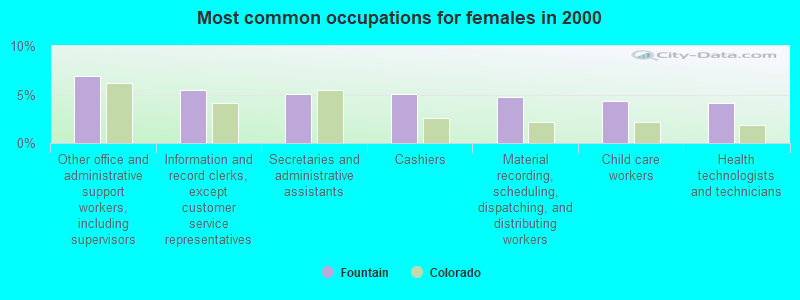
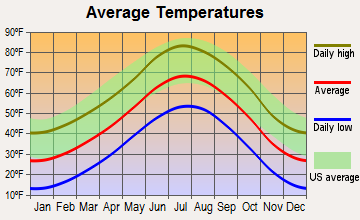
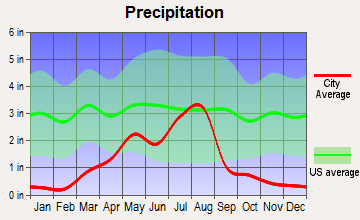
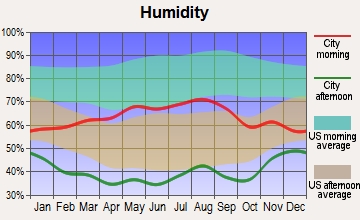
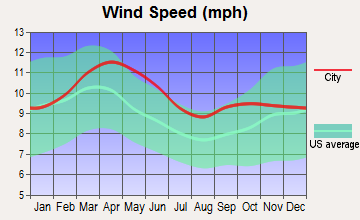
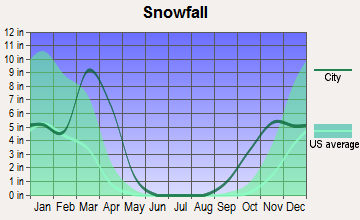
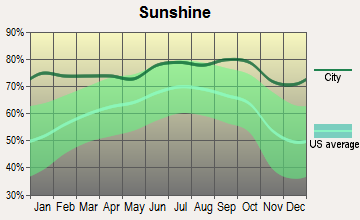
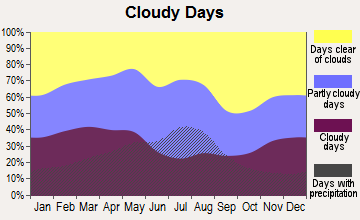
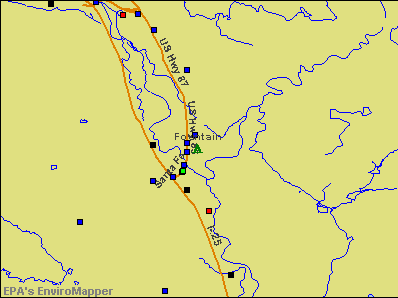

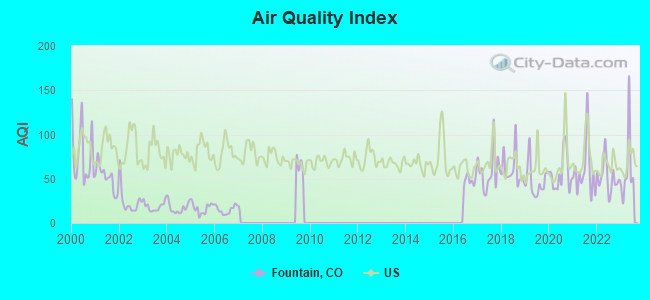
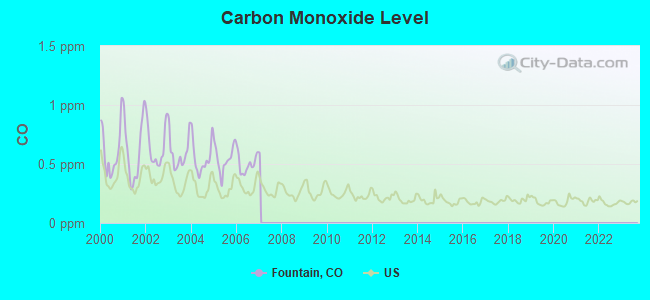
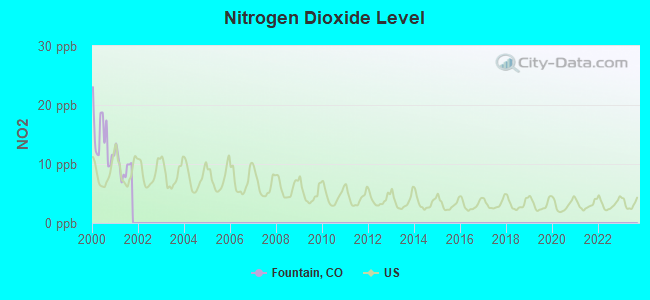
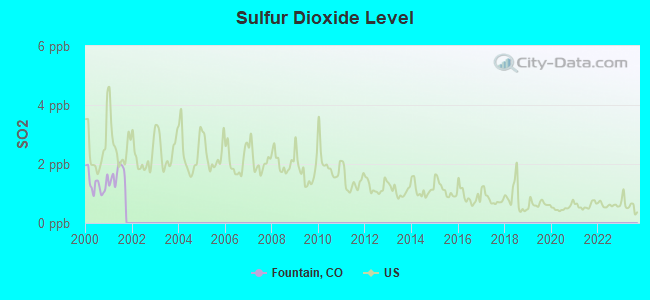
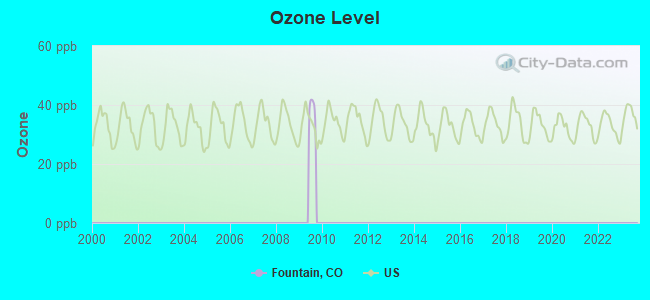
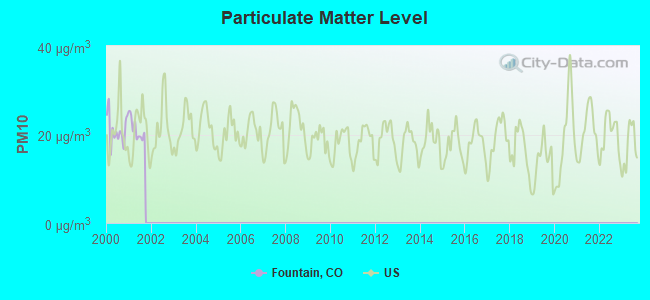
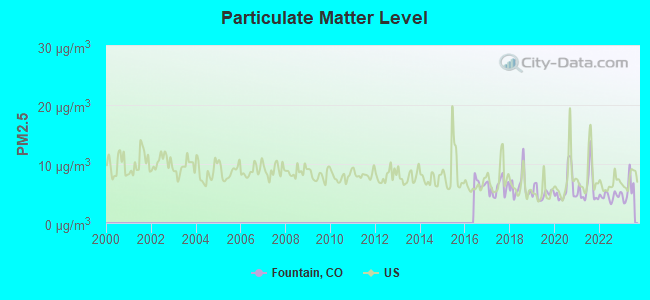
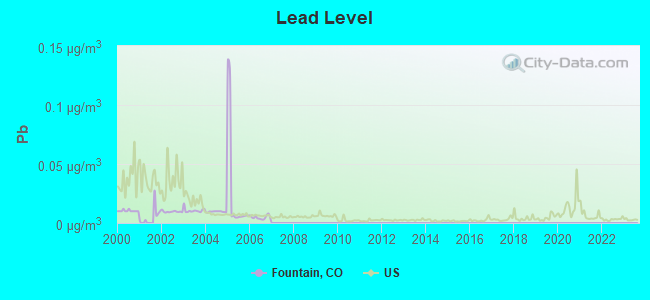
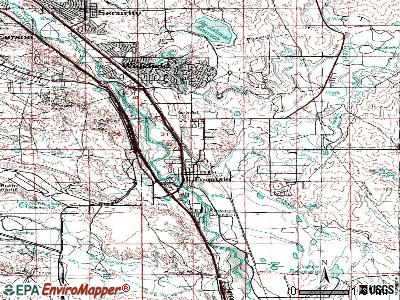
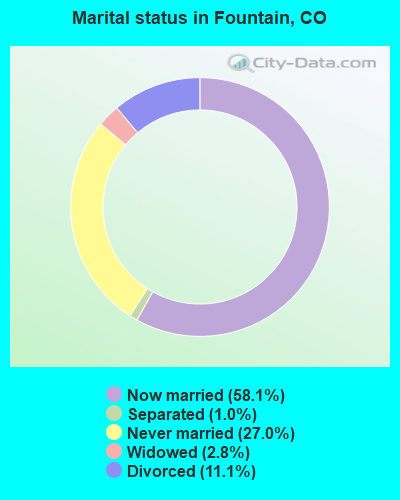
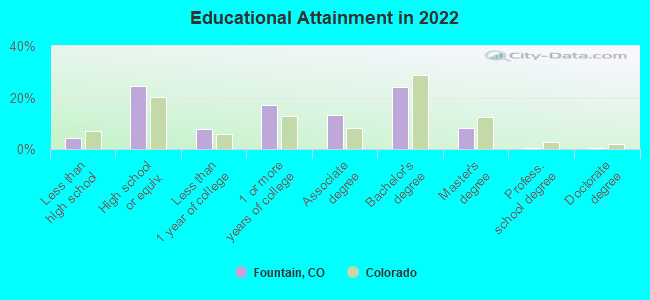
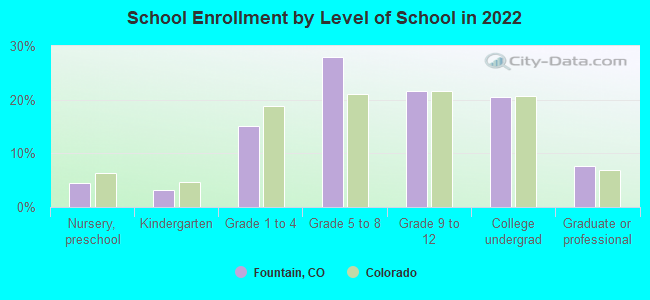
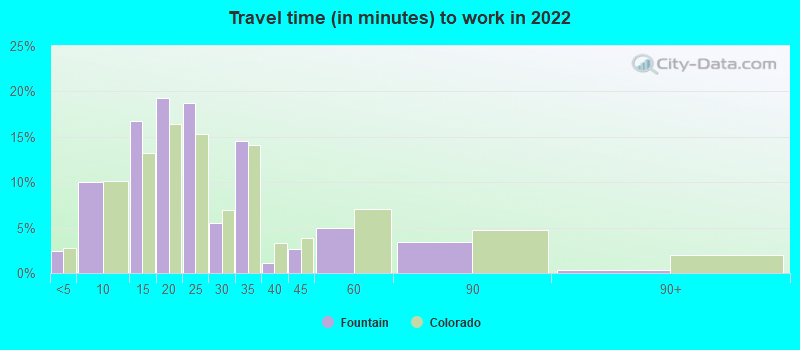
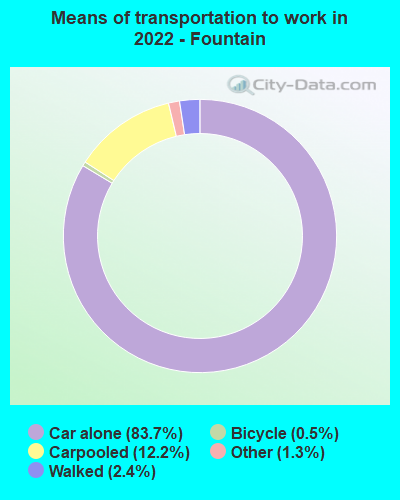
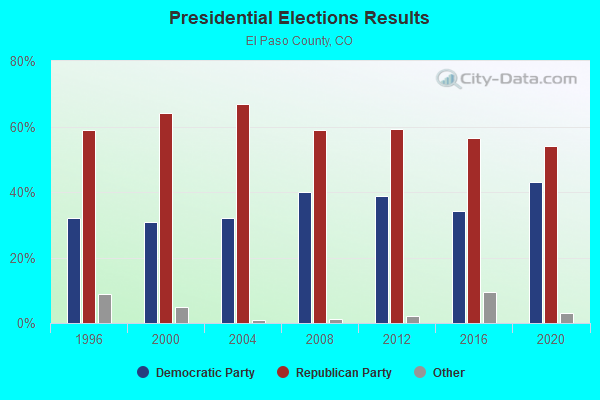
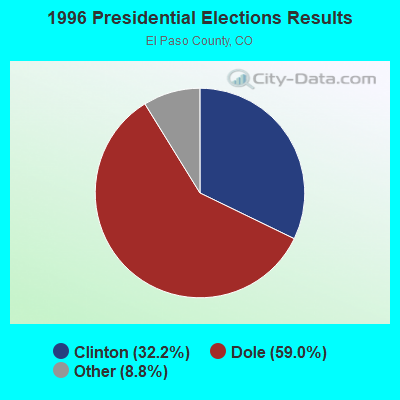
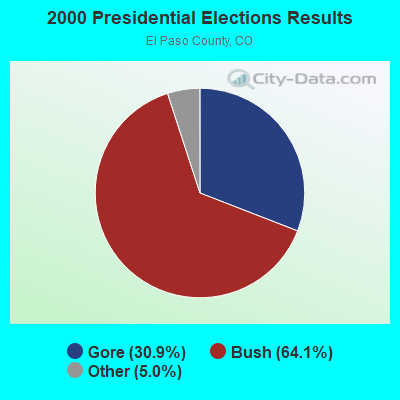
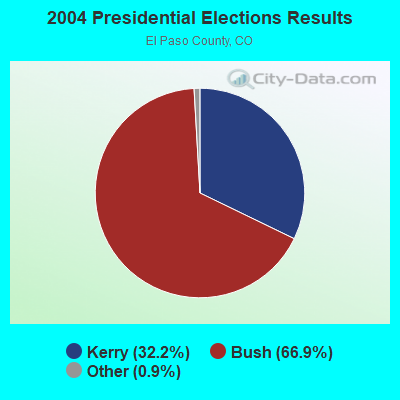
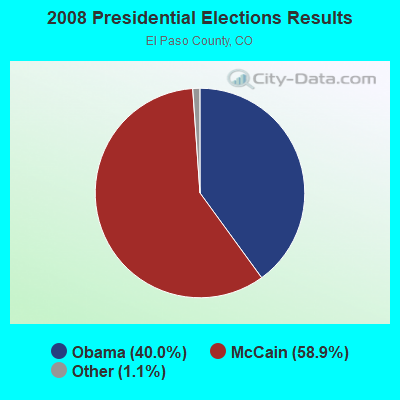
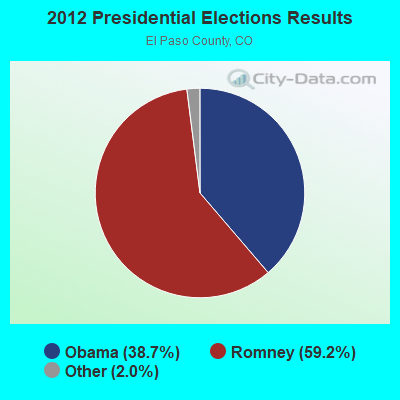
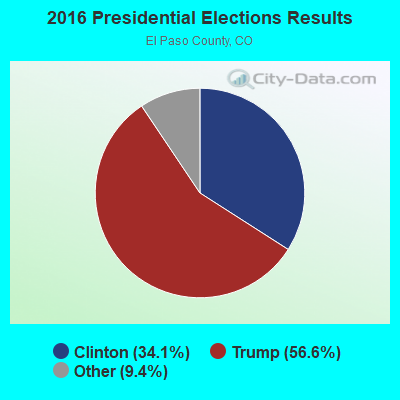
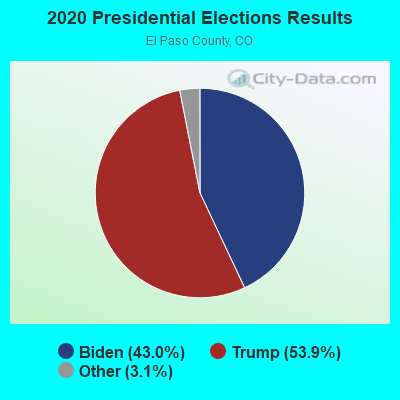
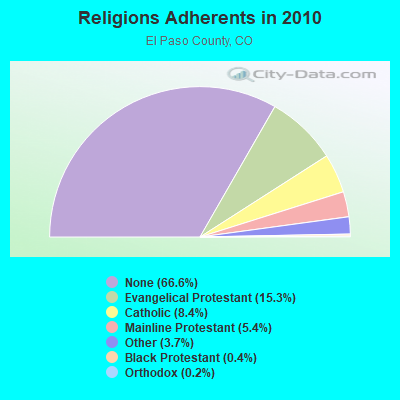
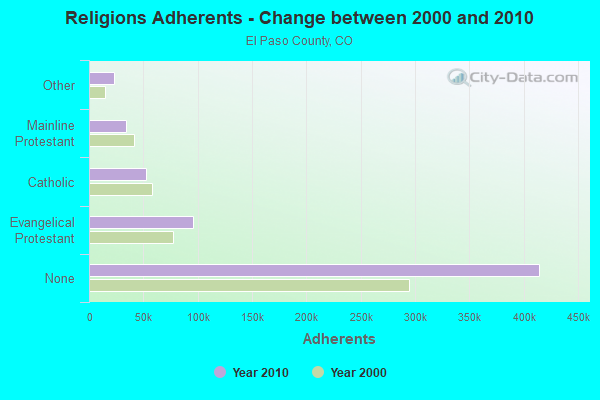
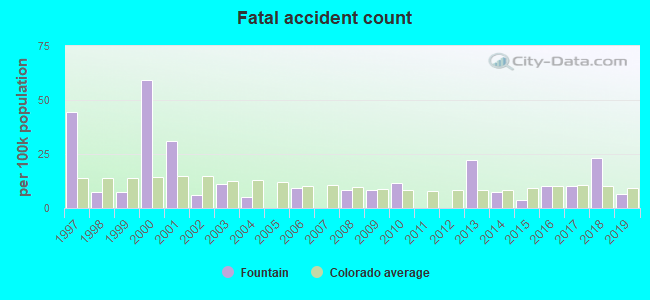
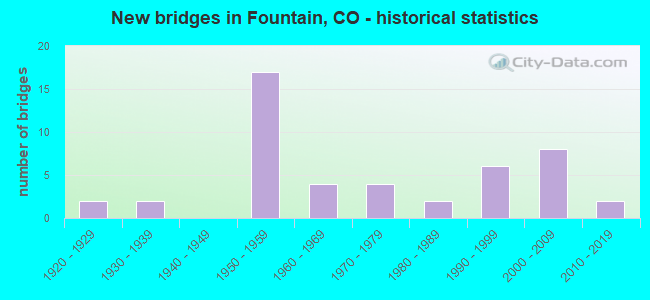
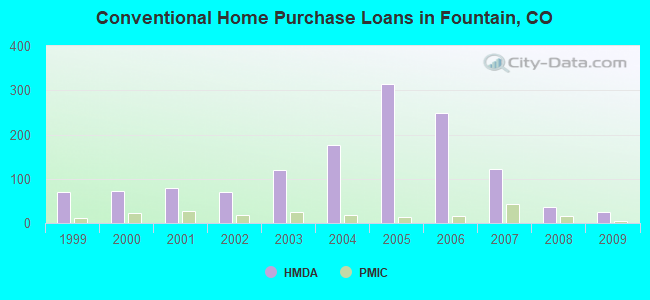
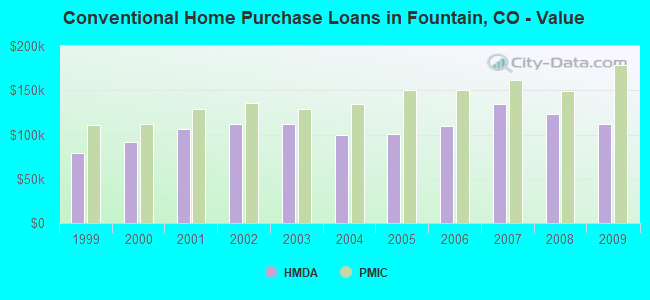
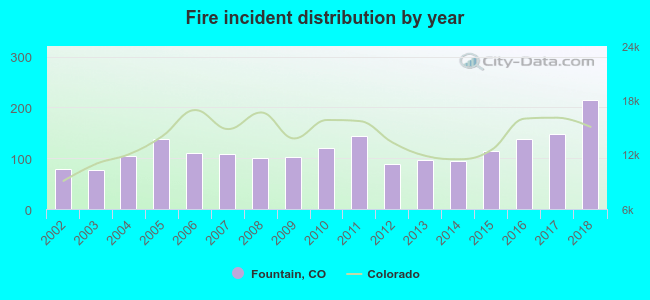 Based on the data from the years 2002 - 2018 the average number of fire incidents per year is 116. The highest number of fires - 214 took place in 2018, and the least - 77 in 2003. The data has a rising trend.
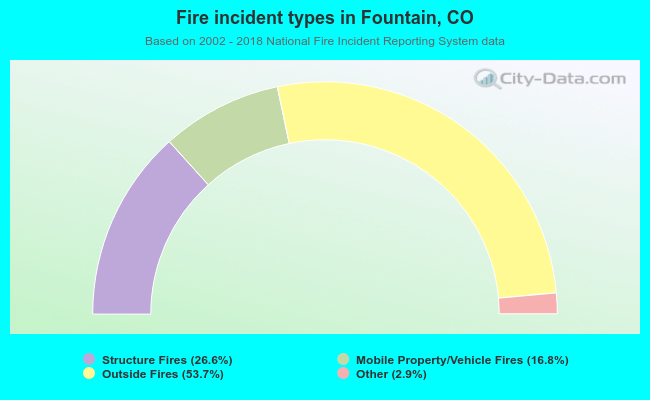 When looking into fire subcategories, the most reports belonged to: Outside Fires (53.7%), and Structure Fires (26.6%).