Garden City, Idaho Submit your own pictures of this city and show them to the world
OSM Map
General Map
Google Map
MSN Map
OSM Map
General Map
Google Map
MSN Map
OSM Map
General Map
Google Map
MSN Map
OSM Map
General Map
Google Map
MSN Map
Please wait while loading the map...
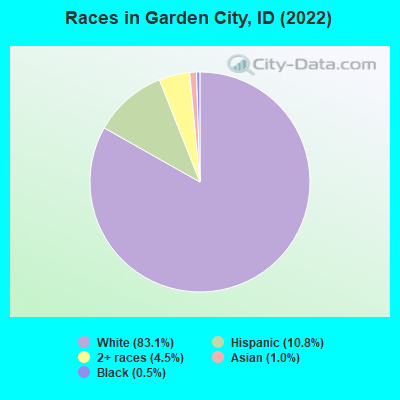
Population in 2022: 12,927 (100% urban, 0% rural). Population change since 2000: +21.7%Males: 5,939 Females: 6,988
March 2022 cost of living index in Garden City: 95.9 (near average, U.S. average is 100) Percentage of residents living in poverty in 2022: 10.5%for White Non-Hispanic residents , 16.0% for Black residents , 29.8% for Hispanic or Latino residents , 17.6% for other race residents , 19.3% for two or more races residents )
Profiles of local businesses
Business Search - 14 Million verified businesses
Data:
Median household income ($)
Median household income (% change since 2000)
Household income diversity
Ratio of average income to average house value (%)
Ratio of average income to average rent
Median household income ($) - White
Median household income ($) - Black or African American
Median household income ($) - Asian
Median household income ($) - Hispanic or Latino
Median household income ($) - American Indian and Alaska Native
Median household income ($) - Multirace
Median household income ($) - Other Race
Median household income for houses/condos with a mortgage ($)
Median household income for apartments without a mortgage ($)
Races - White alone (%)
Races - White alone (% change since 2000)
Races - Black alone (%)
Races - Black alone (% change since 2000)
Races - American Indian alone (%)
Races - American Indian alone (% change since 2000)
Races - Asian alone (%)
Races - Asian alone (% change since 2000)
Races - Hispanic (%)
Races - Hispanic (% change since 2000)
Races - Native Hawaiian and Other Pacific Islander alone (%)
Races - Native Hawaiian and Other Pacific Islander alone (% change since 2000)
Races - Two or more races (%)
Races - Two or more races (% change since 2000)
Races - Other race alone (%)
Races - Other race alone (% change since 2000)
Racial diversity
Unemployment (%)
Unemployment (% change since 2000)
Unemployment (%) - White
Unemployment (%) - Black or African American
Unemployment (%) - Asian
Unemployment (%) - Hispanic or Latino
Unemployment (%) - American Indian and Alaska Native
Unemployment (%) - Multirace
Unemployment (%) - Other Race
Population density (people per square mile)
Population - Males (%)
Population - Females (%)
Population - Males (%) - White
Population - Males (%) - Black or African American
Population - Males (%) - Asian
Population - Males (%) - Hispanic or Latino
Population - Males (%) - American Indian and Alaska Native
Population - Males (%) - Multirace
Population - Males (%) - Other Race
Population - Females (%) - White
Population - Females (%) - Black or African American
Population - Females (%) - Asian
Population - Females (%) - Hispanic or Latino
Population - Females (%) - American Indian and Alaska Native
Population - Females (%) - Multirace
Population - Females (%) - Other Race
Coronavirus confirmed cases (Jun 07, 2024)
Deaths caused by coronavirus (Jun 07, 2024)
Coronavirus confirmed cases (per 100k population) (Jun 07, 2024)
Deaths caused by coronavirus (per 100k population) (Jun 07, 2024)
Daily increase in number of cases (Jun 07, 2024)
Weekly increase in number of cases (Jun 07, 2024)
Cases doubled (in days) (Jun 07, 2024)
Hospitalized patients (Apr 18, 2022)
Negative test results (Apr 18, 2022)
Total test results (Apr 18, 2022)
COVID Vaccine doses distributed (per 100k population) (Sep 19, 2023)
COVID Vaccine doses administered (per 100k population) (Sep 19, 2023)
COVID Vaccine doses distributed (Sep 19, 2023)
COVID Vaccine doses administered (Sep 19, 2023)
Likely homosexual households (%)
Likely homosexual households (% change since 2000)
Likely homosexual households - Lesbian couples (%)
Likely homosexual households - Lesbian couples (% change since 2000)
Likely homosexual households - Gay men (%)
Likely homosexual households - Gay men (% change since 2000)
Cost of living index
Median gross rent ($)
Median contract rent ($)
Median monthly housing costs ($)
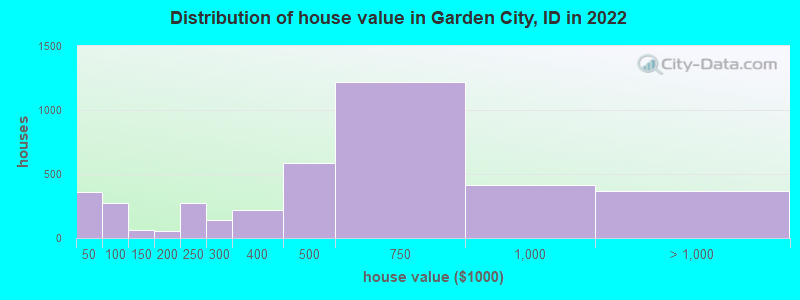
Median house or condo value ($)
Median house or condo value ($ change since 2000)
Mean house or condo value by units in structure - 1, detached ($)
Mean house or condo value by units in structure - 1, attached ($)
Mean house or condo value by units in structure - 2 ($)
Mean house or condo value by units in structure by units in structure - 3 or 4 ($)
Mean house or condo value by units in structure - 5 or more ($)
Mean house or condo value by units in structure - Boat, RV, van, etc. ($)
Mean house or condo value by units in structure - Mobile home ($)
Median house or condo value ($) - White
Median house or condo value ($) - Black or African American
Median house or condo value ($) - Asian
Median house or condo value ($) - Hispanic or Latino
Median house or condo value ($) - American Indian and Alaska Native
Median house or condo value ($) - Multirace
Median house or condo value ($) - Other Race
Median resident age
Resident age diversity
Median resident age - Males
Median resident age - Females
Median resident age - White
Median resident age - Black or African American
Median resident age - Asian
Median resident age - Hispanic or Latino
Median resident age - American Indian and Alaska Native
Median resident age - Multirace
Median resident age - Other Race
Median resident age - Males - White
Median resident age - Males - Black or African American
Median resident age - Males - Asian
Median resident age - Males - Hispanic or Latino
Median resident age - Males - American Indian and Alaska Native
Median resident age - Males - Multirace
Median resident age - Males - Other Race
Median resident age - Females - White
Median resident age - Females - Black or African American
Median resident age - Females - Asian
Median resident age - Females - Hispanic or Latino
Median resident age - Females - American Indian and Alaska Native
Median resident age - Females - Multirace
Median resident age - Females - Other Race
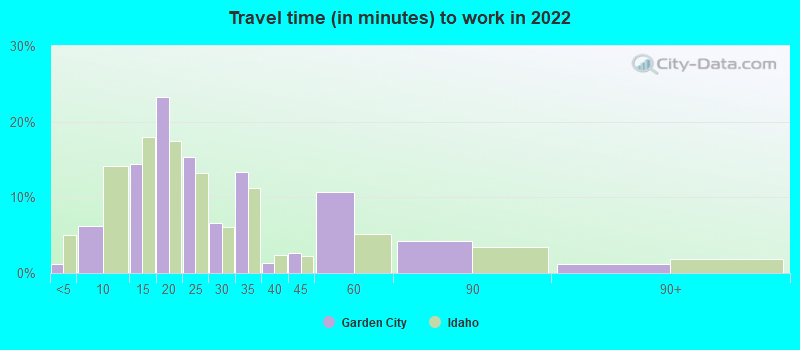
Commute - mean travel time to work (minutes)
Travel time to work - Less than 5 minutes (%)
Travel time to work - Less than 5 minutes (% change since 2000)
Travel time to work - 5 to 9 minutes (%)
Travel time to work - 5 to 9 minutes (% change since 2000)
Travel time to work - 10 to 19 minutes (%)
Travel time to work - 10 to 19 minutes (% change since 2000)
Travel time to work - 20 to 29 minutes (%)
Travel time to work - 20 to 29 minutes (% change since 2000)
Travel time to work - 30 to 39 minutes (%)
Travel time to work - 30 to 39 minutes (% change since 2000)
Travel time to work - 40 to 59 minutes (%)
Travel time to work - 40 to 59 minutes (% change since 2000)
Travel time to work - 60 to 89 minutes (%)
Travel time to work - 60 to 89 minutes (% change since 2000)
Travel time to work - 90 or more minutes (%)
Travel time to work - 90 or more minutes (% change since 2000)
Marital status - Never married (%)
Marital status - Now married (%)
Marital status - Separated (%)
Marital status - Widowed (%)
Marital status - Divorced (%)
Median family income ($)
Median family income (% change since 2000)
Median non-family income ($)
Median non-family income (% change since 2000)
Median per capita income ($)
Median per capita income (% change since 2000)
Median family income ($) - White
Median family income ($) - Black or African American
Median family income ($) - Asian
Median family income ($) - Hispanic or Latino
Median family income ($) - American Indian and Alaska Native
Median family income ($) - Multirace
Median family income ($) - Other Race
Median year house/condo built
Median year apartment built
Year house built - Built 2005 or later (%)
Year house built - Built 2000 to 2004 (%)
Year house built - Built 1990 to 1999 (%)
Year house built - Built 1980 to 1989 (%)
Year house built - Built 1970 to 1979 (%)
Year house built - Built 1960 to 1969 (%)
Year house built - Built 1950 to 1959 (%)
Year house built - Built 1940 to 1949 (%)
Year house built - Built 1939 or earlier (%)
Average household size
Household density (households per square mile)
Average household size - White
Average household size - Black or African American
Average household size - Asian
Average household size - Hispanic or Latino
Average household size - American Indian and Alaska Native
Average household size - Multirace
Average household size - Other Race
Occupied housing units (%)
Vacant housing units (%)
Owner occupied housing units (%)
Renter occupied housing units (%)
Vacancy status - For rent (%)
Vacancy status - For sale only (%)
Vacancy status - Rented or sold, not occupied (%)
Vacancy status - For seasonal, recreational, or occasional use (%)
Vacancy status - For migrant workers (%)
Vacancy status - Other vacant (%)
Residents with income below the poverty level (%)
Residents with income below 50% of the poverty level (%)
Children below poverty level (%)
Poor families by family type - Married-couple family (%)
Poor families by family type - Male, no wife present (%)
Poor families by family type - Female, no husband present (%)
Poverty status for native-born residents (%)
Poverty status for foreign-born residents (%)
Poverty among high school graduates not in families (%)
Poverty among people who did not graduate high school not in families (%)
Residents with income below the poverty level (%) - White
Residents with income below the poverty level (%) - Black or African American
Residents with income below the poverty level (%) - Asian
Residents with income below the poverty level (%) - Hispanic or Latino
Residents with income below the poverty level (%) - American Indian and Alaska Native
Residents with income below the poverty level (%) - Multirace
Residents with income below the poverty level (%) - Other Race
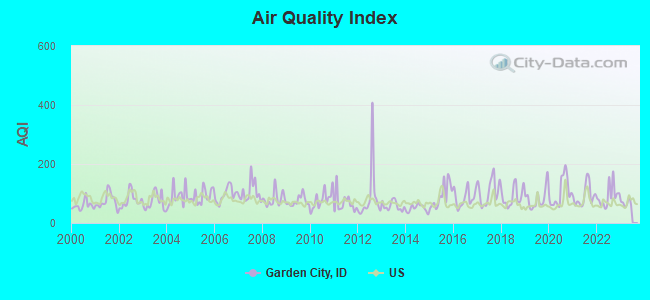
Air pollution - Air Quality Index (AQI)
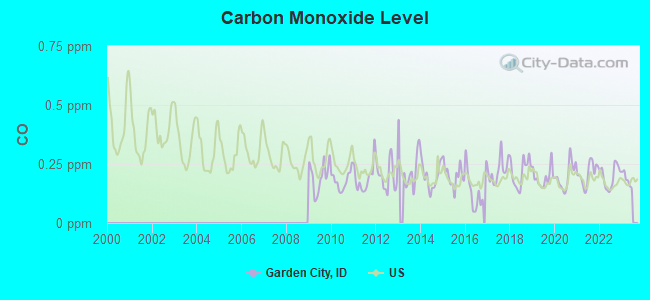
Air pollution - CO
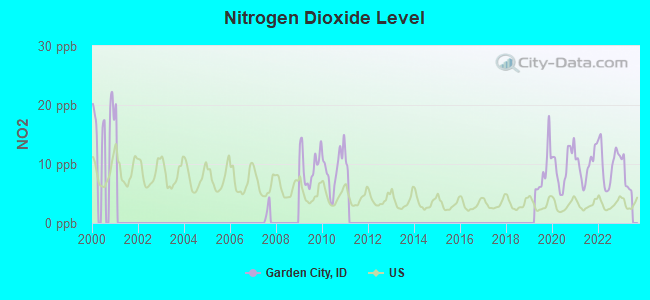
Air pollution - NO2
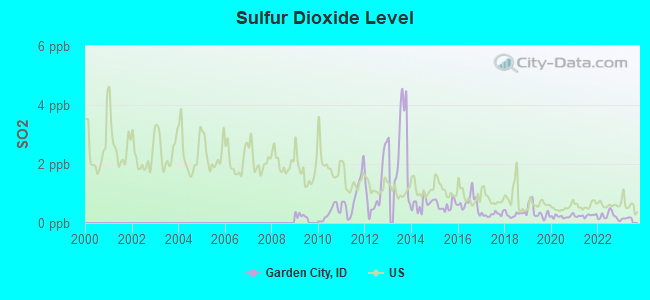
Air pollution - SO2
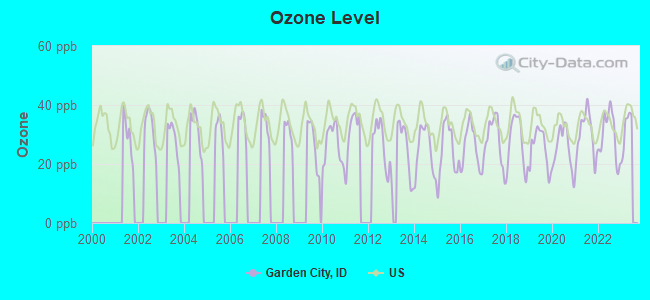
Air pollution - Ozone
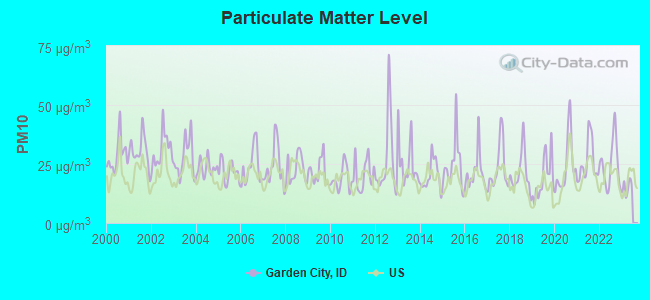
Air pollution - PM10
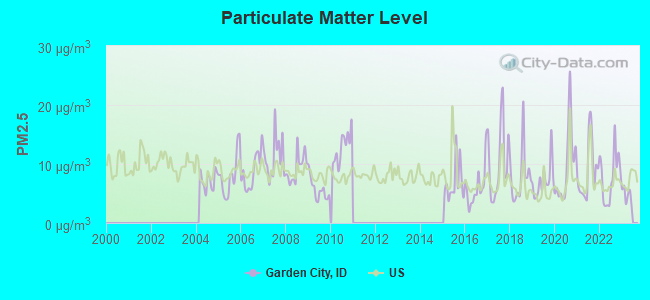
Air pollution - PM25
Air pollution - Pb
Crime - Murders per 100,000 population
Crime - Rapes per 100,000 population
Crime - Robberies per 100,000 population
Crime - Assaults per 100,000 population
Crime - Burglaries per 100,000 population
Crime - Thefts per 100,000 population
Crime - Auto thefts per 100,000 population
Crime - Arson per 100,000 population
Crime - City-data.com crime index
Crime - Violent crime index
Crime - Property crime index
Crime - Murders per 100,000 population (5 year average)
Crime - Rapes per 100,000 population (5 year average)
Crime - Robberies per 100,000 population (5 year average)
Crime - Assaults per 100,000 population (5 year average)
Crime - Burglaries per 100,000 population (5 year average)
Crime - Thefts per 100,000 population (5 year average)
Crime - Auto thefts per 100,000 population (5 year average)
Crime - Arson per 100,000 population (5 year average)
Crime - City-data.com crime index (5 year average)
Crime - Violent crime index (5 year average)
Crime - Property crime index (5 year average)
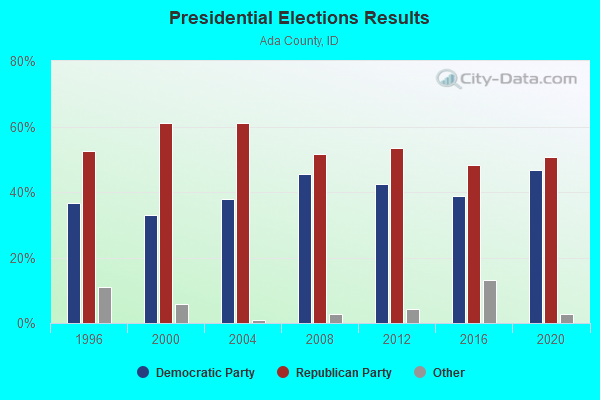
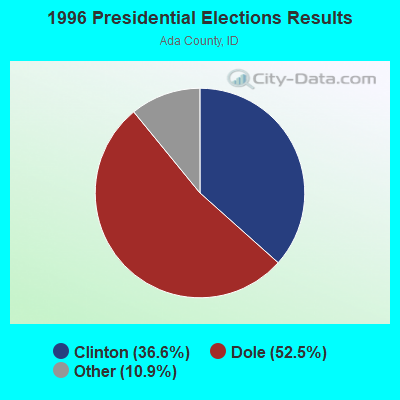
1996 Presidential Elections Results (%) - Democratic Party (Clinton)
1996 Presidential Elections Results (%) - Republican Party (Dole)
1996 Presidential Elections Results (%) - Other
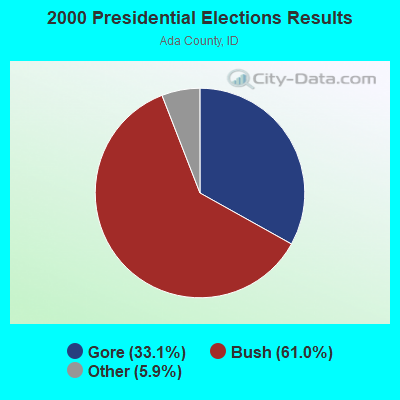
2000 Presidential Elections Results (%) - Democratic Party (Gore)
2000 Presidential Elections Results (%) - Republican Party (Bush)
2000 Presidential Elections Results (%) - Other
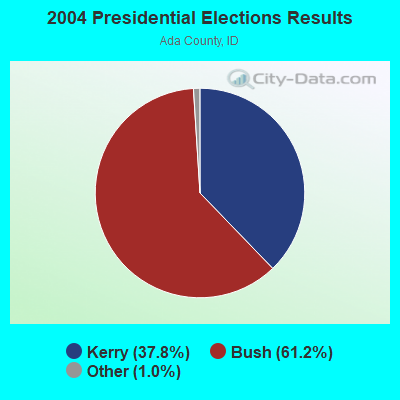
2004 Presidential Elections Results (%) - Democratic Party (Kerry)
2004 Presidential Elections Results (%) - Republican Party (Bush)
2004 Presidential Elections Results (%) - Other
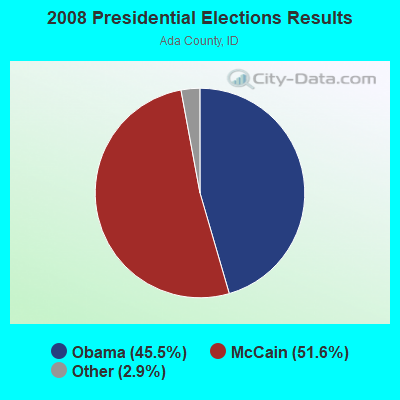
2008 Presidential Elections Results (%) - Democratic Party (Obama)
2008 Presidential Elections Results (%) - Republican Party (McCain)
2008 Presidential Elections Results (%) - Other
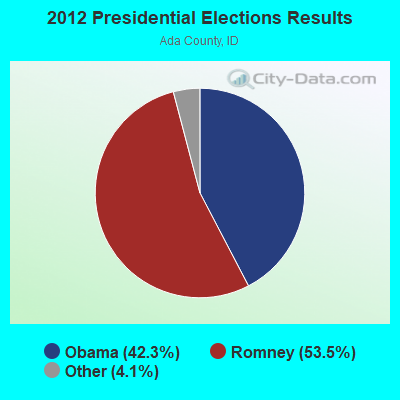
2012 Presidential Elections Results (%) - Democratic Party (Obama)
2012 Presidential Elections Results (%) - Republican Party (Romney)
2012 Presidential Elections Results (%) - Other
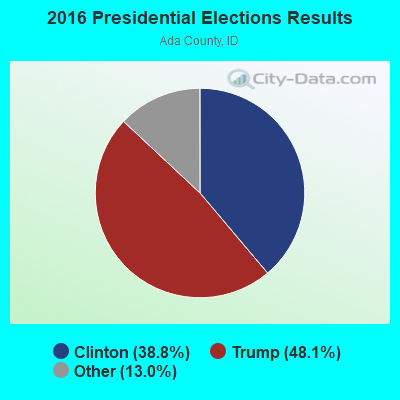
2016 Presidential Elections Results (%) - Democratic Party (Clinton)
2016 Presidential Elections Results (%) - Republican Party (Trump)
2016 Presidential Elections Results (%) - Other
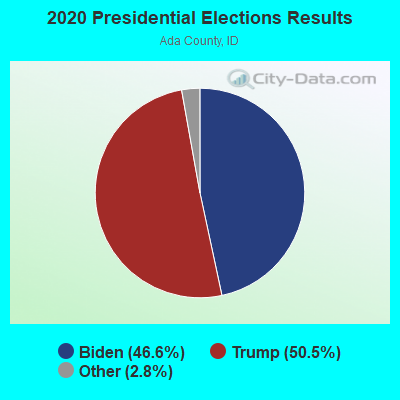
2020 Presidential Elections Results (%) - Democratic Party (Biden)
2020 Presidential Elections Results (%) - Republican Party (Trump)
2020 Presidential Elections Results (%) - Other
Ancestries Reported - Arab (%)
Ancestries Reported - Czech (%)
Ancestries Reported - Danish (%)
Ancestries Reported - Dutch (%)
Ancestries Reported - English (%)
Ancestries Reported - French (%)
Ancestries Reported - French Canadian (%)
Ancestries Reported - German (%)
Ancestries Reported - Greek (%)
Ancestries Reported - Hungarian (%)
Ancestries Reported - Irish (%)
Ancestries Reported - Italian (%)
Ancestries Reported - Lithuanian (%)
Ancestries Reported - Norwegian (%)
Ancestries Reported - Polish (%)
Ancestries Reported - Portuguese (%)
Ancestries Reported - Russian (%)
Ancestries Reported - Scotch-Irish (%)
Ancestries Reported - Scottish (%)
Ancestries Reported - Slovak (%)
Ancestries Reported - Subsaharan African (%)
Ancestries Reported - Swedish (%)
Ancestries Reported - Swiss (%)
Ancestries Reported - Ukrainian (%)
Ancestries Reported - United States (%)
Ancestries Reported - Welsh (%)
Ancestries Reported - West Indian (%)
Ancestries Reported - Other (%)
Educational Attainment - No schooling completed (%)
Educational Attainment - Less than high school (%)
Educational Attainment - High school or equivalent (%)
Educational Attainment - Less than 1 year of college (%)
Educational Attainment - 1 or more years of college (%)
Educational Attainment - Associate degree (%)
Educational Attainment - Bachelor's degree (%)
Educational Attainment - Master's degree (%)
Educational Attainment - Professional school degree (%)
Educational Attainment - Doctorate degree (%)
School Enrollment - Nursery, preschool (%)
School Enrollment - Kindergarten (%)
School Enrollment - Grade 1 to 4 (%)
School Enrollment - Grade 5 to 8 (%)
School Enrollment - Grade 9 to 12 (%)
School Enrollment - College undergrad (%)
School Enrollment - Graduate or professional (%)
School Enrollment - Not enrolled in school (%)
School enrollment - Public schools (%)
School enrollment - Private schools (%)
School enrollment - Not enrolled (%)
Median number of rooms in houses and condos
Median number of rooms in apartments
Housing units lacking complete plumbing facilities (%)
Housing units lacking complete kitchen facilities (%)
Density of houses
Urban houses (%)
Rural houses (%)
Households with people 60 years and over (%)
Households with people 65 years and over (%)
Households with people 75 years and over (%)
Households with one or more nonrelatives (%)
Households with no nonrelatives (%)
Population in households (%)
Family households (%)
Nonfamily households (%)
Population in families (%)
Family households with own children (%)
Median number of bedrooms in owner occupied houses
Mean number of bedrooms in owner occupied houses
Median number of bedrooms in renter occupied houses
Mean number of bedrooms in renter occupied houses
Median number of vehichles in owner occupied houses
Mean number of vehichles in owner occupied houses
Median number of vehichles in renter occupied houses
Mean number of vehichles in renter occupied houses
Mortgage status - with mortgage (%)
Mortgage status - with second mortgage (%)
Mortgage status - with home equity loan (%)
Mortgage status - with both second mortgage and home equity loan (%)
Mortgage status - without a mortgage (%)
Average family size
Average family size - White
Average family size - Black or African American
Average family size - Asian
Average family size - Hispanic or Latino
Average family size - American Indian and Alaska Native
Average family size - Multirace
Average family size - Other Race
Geographical mobility - Same house 1 year ago (%)
Geographical mobility - Moved within same county (%)
Geographical mobility - Moved from different county within same state (%)
Geographical mobility - Moved from different state (%)
Geographical mobility - Moved from abroad (%)
Place of birth - Born in state of residence (%)
Place of birth - Born in other state (%)
Place of birth - Native, outside of US (%)
Place of birth - Foreign born (%)
Housing units in structures - 1, detached (%)
Housing units in structures - 1, attached (%)
Housing units in structures - 2 (%)
Housing units in structures - 3 or 4 (%)
Housing units in structures - 5 to 9 (%)
Housing units in structures - 10 to 19 (%)
Housing units in structures - 20 to 49 (%)
Housing units in structures - 50 or more (%)
Housing units in structures - Mobile home (%)
Housing units in structures - Boat, RV, van, etc. (%)
House/condo owner moved in on average (years ago)
Renter moved in on average (years ago)
Year householder moved into unit - Moved in 1999 to March 2000 (%)
Year householder moved into unit - Moved in 1995 to 1998 (%)
Year householder moved into unit - Moved in 1990 to 1994 (%)
Year householder moved into unit - Moved in 1980 to 1989 (%)
Year householder moved into unit - Moved in 1970 to 1979 (%)
Year householder moved into unit - Moved in 1969 or earlier (%)
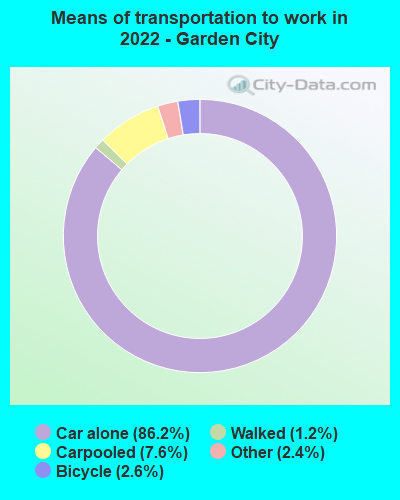
Means of transportation to work - Drove car alone (%)
Means of transportation to work - Carpooled (%)
Means of transportation to work - Public transportation (%)
Means of transportation to work - Bus or trolley bus (%)
Means of transportation to work - Streetcar or trolley car (%)
Means of transportation to work - Subway or elevated (%)
Means of transportation to work - Railroad (%)
Means of transportation to work - Ferryboat (%)
Means of transportation to work - Taxicab (%)
Means of transportation to work - Motorcycle (%)
Means of transportation to work - Bicycle (%)
Means of transportation to work - Walked (%)
Means of transportation to work - Other means (%)
Working at home (%)
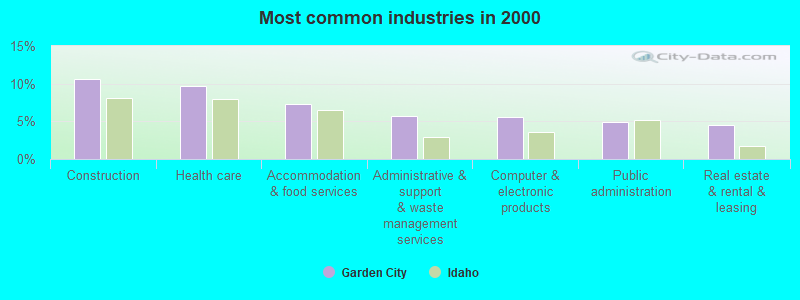
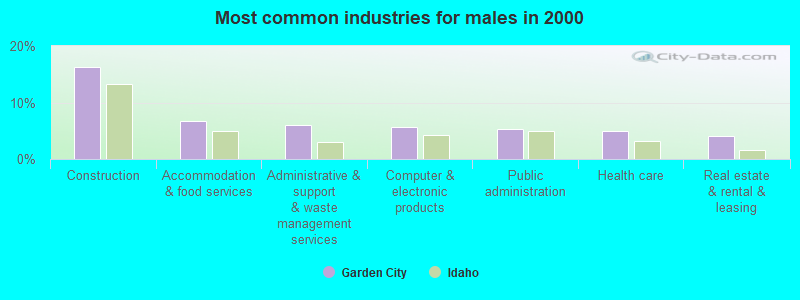
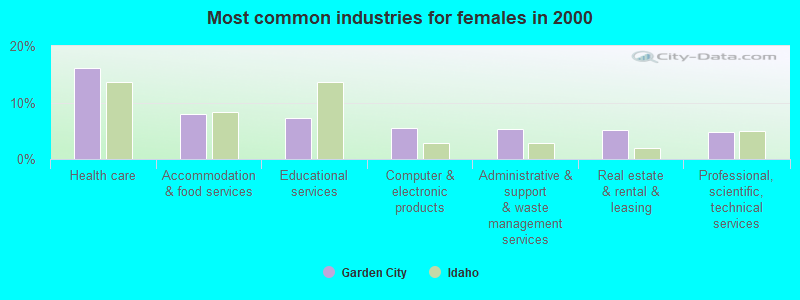
Industry diversity
Most Common Industries - Agriculture, forestry, fishing and hunting, and mining (%)
Most Common Industries - Agriculture, forestry, fishing and hunting (%)
Most Common Industries - Mining, quarrying, and oil and gas extraction (%)
Most Common Industries - Construction (%)
Most Common Industries - Manufacturing (%)
Most Common Industries - Wholesale trade (%)
Most Common Industries - Retail trade (%)
Most Common Industries - Transportation and warehousing, and utilities (%)
Most Common Industries - Transportation and warehousing (%)
Most Common Industries - Utilities (%)
Most Common Industries - Information (%)
Most Common Industries - Finance and insurance, and real estate and rental and leasing (%)
Most Common Industries - Finance and insurance (%)
Most Common Industries - Real estate and rental and leasing (%)
Most Common Industries - Professional, scientific, and management, and administrative and waste management services (%)
Most Common Industries - Professional, scientific, and technical services (%)
Most Common Industries - Management of companies and enterprises (%)
Most Common Industries - Administrative and support and waste management services (%)
Most Common Industries - Educational services, and health care and social assistance (%)
Most Common Industries - Educational services (%)
Most Common Industries - Health care and social assistance (%)
Most Common Industries - Arts, entertainment, and recreation, and accommodation and food services (%)
Most Common Industries - Arts, entertainment, and recreation (%)
Most Common Industries - Accommodation and food services (%)
Most Common Industries - Other services, except public administration (%)
Most Common Industries - Public administration (%)
Occupation diversity
Most Common Occupations - Management, business, science, and arts occupations (%)
Most Common Occupations - Management, business, and financial occupations (%)
Most Common Occupations - Management occupations (%)
Most Common Occupations - Business and financial operations occupations (%)
Most Common Occupations - Computer, engineering, and science occupations (%)
Most Common Occupations - Computer and mathematical occupations (%)
Most Common Occupations - Architecture and engineering occupations (%)
Most Common Occupations - Life, physical, and social science occupations (%)
Most Common Occupations - Education, legal, community service, arts, and media occupations (%)
Most Common Occupations - Community and social service occupations (%)
Most Common Occupations - Legal occupations (%)
Most Common Occupations - Education, training, and library occupations (%)
Most Common Occupations - Arts, design, entertainment, sports, and media occupations (%)
Most Common Occupations - Healthcare practitioners and technical occupations (%)
Most Common Occupations - Health diagnosing and treating practitioners and other technical occupations (%)
Most Common Occupations - Health technologists and technicians (%)
Most Common Occupations - Service occupations (%)
Most Common Occupations - Healthcare support occupations (%)
Most Common Occupations - Protective service occupations (%)
Most Common Occupations - Fire fighting and prevention, and other protective service workers including supervisors (%)
Most Common Occupations - Law enforcement workers including supervisors (%)
Most Common Occupations - Food preparation and serving related occupations (%)
Most Common Occupations - Building and grounds cleaning and maintenance occupations (%)
Most Common Occupations - Personal care and service occupations (%)
Most Common Occupations - Sales and office occupations (%)
Most Common Occupations - Sales and related occupations (%)
Most Common Occupations - Office and administrative support occupations (%)
Most Common Occupations - Natural resources, construction, and maintenance occupations (%)
Most Common Occupations - Farming, fishing, and forestry occupations (%)
Most Common Occupations - Construction and extraction occupations (%)
Most Common Occupations - Installation, maintenance, and repair occupations (%)
Most Common Occupations - Production, transportation, and material moving occupations (%)
Most Common Occupations - Production occupations (%)
Most Common Occupations - Transportation occupations (%)
Most Common Occupations - Material moving occupations (%)
People in Group quarters - Institutionalized population (%)
People in Group quarters - Correctional institutions (%)
People in Group quarters - Federal prisons and detention centers (%)
People in Group quarters - Halfway houses (%)
People in Group quarters - Local jails and other confinement facilities (including police lockups) (%)
People in Group quarters - Military disciplinary barracks (%)
People in Group quarters - State prisons (%)
People in Group quarters - Other types of correctional institutions (%)
People in Group quarters - Nursing homes (%)
People in Group quarters - Hospitals/wards, hospices, and schools for the handicapped (%)
People in Group quarters - Hospitals/wards and hospices for chronically ill (%)
People in Group quarters - Hospices or homes for chronically ill (%)
People in Group quarters - Military hospitals or wards for chronically ill (%)
People in Group quarters - Other hospitals or wards for chronically ill (%)
People in Group quarters - Hospitals or wards for drug/alcohol abuse (%)
People in Group quarters - Mental (Psychiatric) hospitals or wards (%)
People in Group quarters - Schools, hospitals, or wards for the mentally retarded (%)
People in Group quarters - Schools, hospitals, or wards for the physically handicapped (%)
People in Group quarters - Institutions for the deaf (%)
People in Group quarters - Institutions for the blind (%)
People in Group quarters - Orthopedic wards and institutions for the physically handicapped (%)
People in Group quarters - Wards in general hospitals for patients who have no usual home elsewhere (%)
People in Group quarters - Wards in military hospitals for patients who have no usual home elsewhere (%)
People in Group quarters - Juvenile institutions (%)
People in Group quarters - Long-term care (%)
People in Group quarters - Homes for abused, dependent, and neglected children (%)
People in Group quarters - Residential treatment centers for emotionally disturbed children (%)
People in Group quarters - Training schools for juvenile delinquents (%)
People in Group quarters - Short-term care, detention or diagnostic centers for delinquent children (%)
People in Group quarters - Type of juvenile institution unknown (%)
People in Group quarters - Noninstitutionalized population (%)
People in Group quarters - College dormitories (includes college quarters off campus) (%)
People in Group quarters - Military quarters (%)
People in Group quarters - On base (%)
People in Group quarters - Barracks, unaccompanied personnel housing (UPH), (Enlisted/Officer), ;and similar group living quarters for military personnel (%)
People in Group quarters - Transient quarters for temporary residents (%)
People in Group quarters - Military ships (%)
People in Group quarters - Group homes (%)
People in Group quarters - Homes or halfway houses for drug/alcohol abuse (%)
People in Group quarters - Homes for the mentally ill (%)
People in Group quarters - Homes for the mentally retarded (%)
People in Group quarters - Homes for the physically handicapped (%)
People in Group quarters - Other group homes (%)
People in Group quarters - Religious group quarters (%)
People in Group quarters - Dormitories (%)
People in Group quarters - Agriculture workers' dormitories on farms (%)
People in Group quarters - Job Corps and vocational training facilities (%)
People in Group quarters - Other workers' dormitories (%)
People in Group quarters - Crews of maritime vessels (%)
People in Group quarters - Other nonhousehold living situations (%)
People in Group quarters - Other noninstitutional group quarters (%)
Residents speaking English at home (%)
Residents speaking English at home - Born in the United States (%)
Residents speaking English at home - Native, born elsewhere (%)
Residents speaking English at home - Foreign born (%)
Residents speaking Spanish at home (%)
Residents speaking Spanish at home - Born in the United States (%)
Residents speaking Spanish at home - Native, born elsewhere (%)
Residents speaking Spanish at home - Foreign born (%)
Residents speaking other language at home (%)
Residents speaking other language at home - Born in the United States (%)
Residents speaking other language at home - Native, born elsewhere (%)
Residents speaking other language at home - Foreign born (%)
Class of Workers - Employee of private company (%)
Class of Workers - Self-employed in own incorporated business (%)
Class of Workers - Private not-for-profit wage and salary workers (%)
Class of Workers - Local government workers (%)
Class of Workers - State government workers (%)
Class of Workers - Federal government workers (%)
Class of Workers - Self-employed workers in own not incorporated business and Unpaid family workers (%)
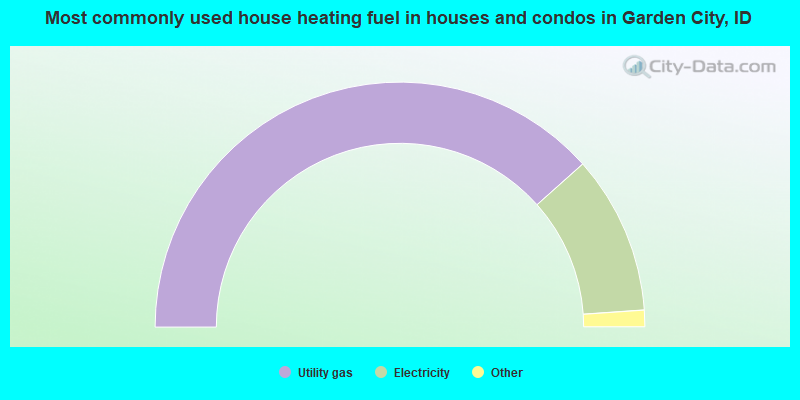
House heating fuel used in houses and condos - Utility gas (%)
House heating fuel used in houses and condos - Bottled, tank, or LP gas (%)
House heating fuel used in houses and condos - Electricity (%)
House heating fuel used in houses and condos - Fuel oil, kerosene, etc. (%)
House heating fuel used in houses and condos - Coal or coke (%)
House heating fuel used in houses and condos - Wood (%)
House heating fuel used in houses and condos - Solar energy (%)
House heating fuel used in houses and condos - Other fuel (%)
House heating fuel used in houses and condos - No fuel used (%)
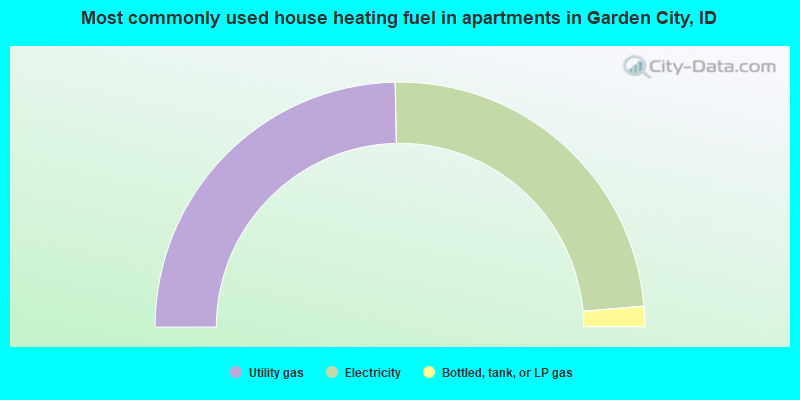
House heating fuel used in apartments - Utility gas (%)
House heating fuel used in apartments - Bottled, tank, or LP gas (%)
House heating fuel used in apartments - Electricity (%)
House heating fuel used in apartments - Fuel oil, kerosene, etc. (%)
House heating fuel used in apartments - Coal or coke (%)
House heating fuel used in apartments - Wood (%)
House heating fuel used in apartments - Solar energy (%)
House heating fuel used in apartments - Other fuel (%)
House heating fuel used in apartments - No fuel used (%)
Armed forces status - In Armed Forces (%)
Armed forces status - Civilian (%)
Armed forces status - Civilian - Veteran (%)
Armed forces status - Civilian - Nonveteran (%)
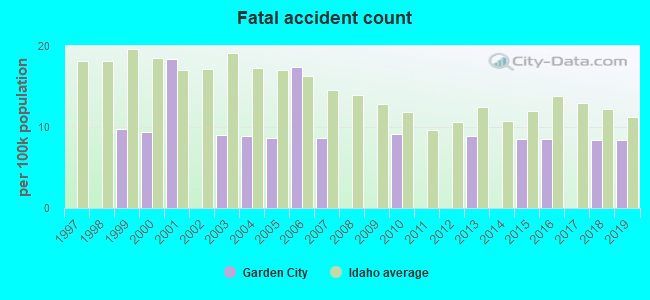
Fatal accidents locations in years 2005-2021
Fatal accidents locations in 2005
Fatal accidents locations in 2006
Fatal accidents locations in 2007
Fatal accidents locations in 2008
Fatal accidents locations in 2009
Fatal accidents locations in 2010
Fatal accidents locations in 2011
Fatal accidents locations in 2012
Fatal accidents locations in 2013
Fatal accidents locations in 2014
Fatal accidents locations in 2015
Fatal accidents locations in 2016
Fatal accidents locations in 2017
Fatal accidents locations in 2018
Fatal accidents locations in 2019
Fatal accidents locations in 2020
Fatal accidents locations in 2021
Alcohol use - People drinking some alcohol every month (%)
Alcohol use - People not drinking at all (%)
Alcohol use - Average days/month drinking alcohol
Alcohol use - Average drinks/week
Alcohol use - Average days/year people drink much
Audiometry - Average condition of hearing (%)
Audiometry - People that can hear a whisper from across a quiet room (%)
Audiometry - People that can hear normal voice from across a quiet room (%)
Audiometry - Ears ringing, roaring, buzzing (%)
Audiometry - Had a job exposure to loud noise (%)
Audiometry - Had off-work exposure to loud noise (%)
Blood Pressure & Cholesterol - Has high blood pressure (%)
Blood Pressure & Cholesterol - Checking blood pressure at home (%)
Blood Pressure & Cholesterol - Frequently checking blood cholesterol (%)
Blood Pressure & Cholesterol - Has high cholesterol level (%)
Consumer Behavior - Money monthly spent on food at supermarket/grocery store
Consumer Behavior - Money monthly spent on food at other stores
Consumer Behavior - Money monthly spent on eating out
Consumer Behavior - Money monthly spent on carryout/delivered foods
Consumer Behavior - Income spent on food at supermarket/grocery store (%)
Consumer Behavior - Income spent on food at other stores (%)
Consumer Behavior - Income spent on eating out (%)
Consumer Behavior - Income spent on carryout/delivered foods (%)
Current Health Status - General health condition (%)
Current Health Status - Blood donors (%)
Current Health Status - Has blood ever tested for HIV virus (%)
Current Health Status - Left-handed people (%)
Dermatology - People using sunscreen (%)
Diabetes - Diabetics (%)
Diabetes - Had a blood test for high blood sugar (%)
Diabetes - People taking insulin (%)
Diet Behavior & Nutrition - Diet health (%)
Diet Behavior & Nutrition - Milk product consumption (# of products/month)
Diet Behavior & Nutrition - Meals not home prepared (#/week)
Diet Behavior & Nutrition - Meals from fast food or pizza place (#/week)
Diet Behavior & Nutrition - Ready-to-eat foods (#/month)
Diet Behavior & Nutrition - Frozen meals/pizza (#/month)
Drug Use - People that ever used marijuana or hashish (%)
Drug Use - Ever used hard drugs (%)
Drug Use - Ever used any form of cocaine (%)
Drug Use - Ever used heroin (%)
Drug Use - Ever used methamphetamine (%)
Health Insurance - People covered by health insurance (%)
Kidney Conditions-Urology - Avg. # of times urinating at night
Medical Conditions - People with asthma (%)
Medical Conditions - People with anemia (%)
Medical Conditions - People with psoriasis (%)
Medical Conditions - People with overweight (%)
Medical Conditions - Elderly people having difficulties in thinking or remembering (%)
Medical Conditions - People who ever received blood transfusion (%)
Medical Conditions - People having trouble seeing even with glass/contacts (%)
Medical Conditions - People with arthritis (%)
Medical Conditions - People with gout (%)
Medical Conditions - People with congestive heart failure (%)
Medical Conditions - People with coronary heart disease (%)
Medical Conditions - People with angina pectoris (%)
Medical Conditions - People who ever had heart attack (%)
Medical Conditions - People who ever had stroke (%)
Medical Conditions - People with emphysema (%)
Medical Conditions - People with thyroid problem (%)
Medical Conditions - People with chronic bronchitis (%)
Medical Conditions - People with any liver condition (%)
Medical Conditions - People who ever had cancer or malignancy (%)
Mental Health - People who have little interest in doing things (%)
Mental Health - People feeling down, depressed, or hopeless (%)
Mental Health - People who have trouble sleeping or sleeping too much (%)
Mental Health - People feeling tired or having little energy (%)
Mental Health - People with poor appetite or overeating (%)
Mental Health - People feeling bad about themself (%)
Mental Health - People who have trouble concentrating on things (%)
Mental Health - People moving or speaking slowly or too fast (%)
Mental Health - People having thoughts they would be better off dead (%)
Oral Health - Average years since last visit a dentist
Oral Health - People embarrassed because of mouth (%)
Oral Health - People with gum disease (%)
Oral Health - General health of teeth and gums (%)
Oral Health - Average days a week using dental floss/device
Oral Health - Average days a week using mouthwash for dental problem
Oral Health - Average number of teeth
Pesticide Use - Households using pesticides to control insects (%)
Pesticide Use - Households using pesticides to kill weeds (%)
Physical Activity - People doing vigorous-intensity work activities (%)
Physical Activity - People doing moderate-intensity work activities (%)
Physical Activity - People walking or bicycling (%)
Physical Activity - People doing vigorous-intensity recreational activities (%)
Physical Activity - People doing moderate-intensity recreational activities (%)
Physical Activity - Average hours a day doing sedentary activities
Physical Activity - Average hours a day watching TV or videos
Physical Activity - Average hours a day using computer
Physical Functioning - People having limitations keeping them from working (%)
Physical Functioning - People limited in amount of work they can do (%)
Physical Functioning - People that need special equipment to walk (%)
Physical Functioning - People experiencing confusion/memory problems (%)
Physical Functioning - People requiring special healthcare equipment (%)
Prescription Medications - Average number of prescription medicines taking
Preventive Aspirin Use - Adults 40+ taking low-dose aspirin (%)
Reproductive Health - Vaginal deliveries (%)
Reproductive Health - Cesarean deliveries (%)
Reproductive Health - Deliveries resulted in a live birth (%)
Reproductive Health - Pregnancies resulted in a delivery (%)
Reproductive Health - Women breastfeeding newborns (%)
Reproductive Health - Women that had a hysterectomy (%)
Reproductive Health - Women that had both ovaries removed (%)
Reproductive Health - Women that have ever taken birth control pills (%)
Reproductive Health - Women taking birth control pills (%)
Reproductive Health - Women that have ever used Depo-Provera or injectables (%)
Reproductive Health - Women that have ever used female hormones (%)
Sexual Behavior - People 18+ that ever had sex (vaginal, anal, or oral) (%)
Sexual Behavior - Males 18+ that ever had vaginal sex with a woman (%)
Sexual Behavior - Males 18+ that ever performed oral sex on a woman (%)
Sexual Behavior - Males 18+ that ever had anal sex with a woman (%)
Sexual Behavior - Males 18+ that ever had any sex with a man (%)
Sexual Behavior - Females 18+ that ever had vaginal sex with a man (%)
Sexual Behavior - Females 18+ that ever performed oral sex on a man (%)
Sexual Behavior - Females 18+ that ever had anal sex with a man (%)
Sexual Behavior - Females 18+ that ever had any kind of sex with a woman (%)
Sexual Behavior - Average age people first had sex
Sexual Behavior - Average number of female sex partners in lifetime (males 18+)
Sexual Behavior - Average number of female vaginal sex partners in lifetime (males 18+)
Sexual Behavior - Average age people first performed oral sex on a woman (18+)
Sexual Behavior - Average number of woman performed oral sex on in lifetime (18+)
Sexual Behavior - Average number of male sex partners in lifetime (males 18+)
Sexual Behavior - Average number of male anal sex partners in lifetime (males 18+)
Sexual Behavior - Average age people first performed oral sex on a man (18+)
Sexual Behavior - Average number of male oral sex partners in lifetime (18+)
Sexual Behavior - People using protection when performing oral sex (%)
Sexual Behavior - Average number of times people have vaginal or anal sex a year
Sexual Behavior - People having sex without condom (%)
Sexual Behavior - Average number of male sex partners in lifetime (females 18+)
Sexual Behavior - Average number of male vaginal sex partners in lifetime (females 18+)
Sexual Behavior - Average number of female sex partners in lifetime (females 18+)
Sexual Behavior - Circumcised males 18+ (%)
Sleep Disorders - Average hours sleeping at night
Sleep Disorders - People that has trouble sleeping (%)
Smoking-Cigarette Use - People smoking cigarettes (%)
Taste & Smell - People 40+ having problems with smell (%)
Taste & Smell - People 40+ having problems with taste (%)
Taste & Smell - People 40+ that ever had wisdom teeth removed (%)
Taste & Smell - People 40+ that ever had tonsils teeth removed (%)
Taste & Smell - People 40+ that ever had a loss of consciousness because of a head injury (%)
Taste & Smell - People 40+ that ever had a broken nose or other serious injury to face or skull (%)
Taste & Smell - People 40+ that ever had two or more sinus infections (%)
Weight - Average height (inches)
Weight - Average weight (pounds)
Weight - Average BMI
Weight - People that are obese (%)
Weight - People that ever were obese (%)
Weight - People trying to lose weight (%)
According to our research of Idaho and other state lists, there were 37 registered sex offenders living in Garden City, Idaho as of June 07, 2024 . The ratio of all residents to sex offenders in Garden City is 322 to 1.The ratio of registered sex offenders to all residents in this city is near the state average.
Officers per 1,000 residents here:
2.33Idaho average:
1.59
Latest news from Garden City, ID collected exclusively by city-data.com from local newspapers, TV, and radio stations
Ancestries: English (11.2%), American (9.9%), European (9.6%), German (7.7%), Irish (7.1%), Norwegian (5.6%).
Current Local Time:
Land area: 4.15 square miles.
Population density: 3,115 people per square mile (average).
789 residents are foreign born (2.6% Latin America , 2.6% Europe , 0.8% North America ).
Median real estate property taxes paid for housing units with mortgages in 2022: $3,161 (0.5%)Median real estate property taxes paid for housing units with no mortgage in 2022: $2,341 (0.7%)
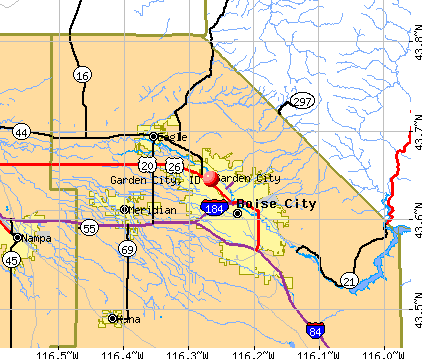
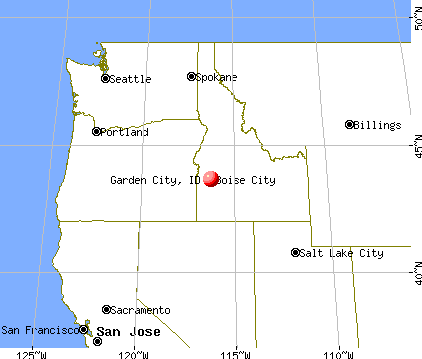
Nearest city with pop. 50,000+: Boise, ID
Nearest city with pop. 200,000+: Northwest Clackamas, OR (335.8 miles
Nearest city with pop. 1,000,000+: Los Angeles, CA
Nearest cities:
Latitude: 43.65 N, Longitude: 116.27 W
Daytime population change due to commuting: +3,355 (+26.1%)Workers who live and work in this city: 1,663 (27.0%)
Area code commonly used in this area: 208
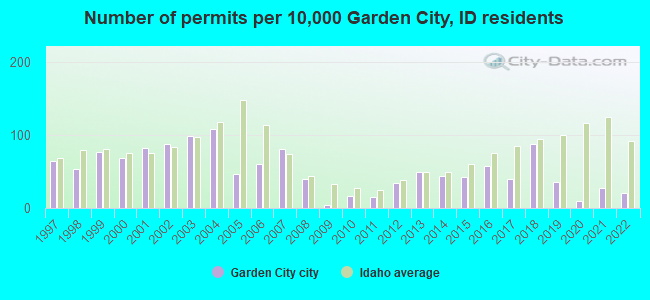
Single-family new house construction building permits:
2022: 21 buildings , average cost: $343,1002021: 29 buildings , average cost: $153,1002020: 10 buildings , average cost: $88,0002019: 38 buildings , average cost: $95,8002018: 94 buildings , average cost: $157,9002017: 42 buildings , average cost: $146,1002016: 61 buildings , average cost: $172,3002015: 45 buildings , average cost: $219,5002014: 47 buildings , average cost: $201,6002013: 52 buildings , average cost: $219,5002012: 36 buildings , average cost: $230,2002011: 16 buildings , average cost: $206,9002010: 18 buildings , average cost: $172,9002009: 4 buildings , average cost: $188,3002008: 42 buildings , average cost: $271,7002007: 86 buildings , average cost: $247,7002006: 64 buildings , average cost: $205,3002005: 49 buildings , average cost: $213,3002004: 115 buildings , average cost: $177,5002003: 104 buildings , average cost: $177,0002002: 94 buildings , average cost: $179,3002001: 87 buildings , average cost: $169,5002000: 73 buildings , average cost: $217,7001999: 82 buildings , average cost: $162,3001998: 57 buildings , average cost: $195,8001997: 68 buildings , average cost: $137,900Unemployment in December 2023: Population change in the 1990s: +3,672 (+52.8%).
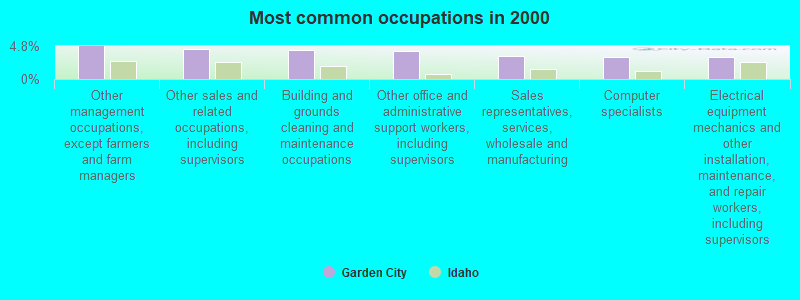
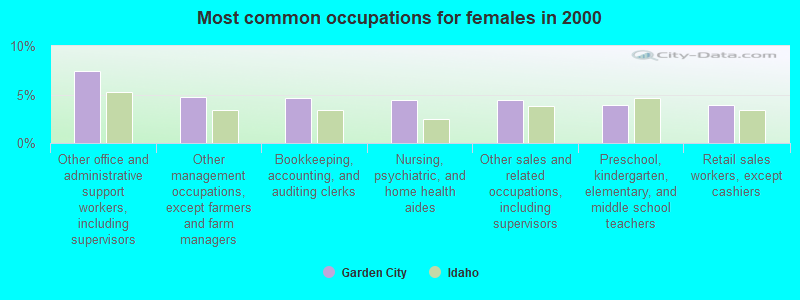
Most common occupations in Garden City, ID (%)
Both Males Females
Other management occupations, except farmers and farm managers (4.8%)
Other sales and related occupations, including supervisors (4.4%)
Building and grounds cleaning and maintenance occupations (4.2%)
Other office and administrative support workers, including supervisors (4.1%)
Sales representatives, services, wholesale and manufacturing (3.3%)
Computer specialists (3.3%)
Electrical equipment mechanics and other installation, maintenance, and repair workers, including supervisors (3.2%)
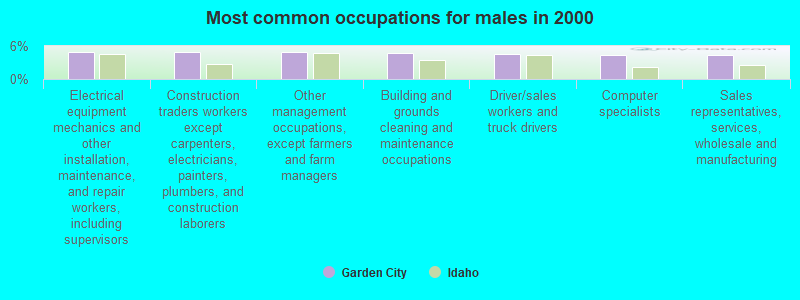
Electrical equipment mechanics and other installation, maintenance, and repair workers, including supervisors (4.9%)
Construction traders workers except carpenters, electricians, painters, plumbers, and construction laborers (4.9%)
Other management occupations, except farmers and farm managers (4.9%)
Building and grounds cleaning and maintenance occupations (4.8%)
Driver/sales workers and truck drivers (4.5%)
Computer specialists (4.4%)
Sales representatives, services, wholesale and manufacturing (4.3%)
Other office and administrative support workers, including supervisors (7.4%)
Other management occupations, except farmers and farm managers (4.7%)
Bookkeeping, accounting, and auditing clerks (4.6%)
Nursing, psychiatric, and home health aides (4.4%)
Other sales and related occupations, including supervisors (4.4%)
Preschool, kindergarten, elementary, and middle school teachers (3.9%)
Retail sales workers, except cashiers (3.9%)
Earthquake activity:
Garden City-area historical earthquake activity is significantly above Idaho state average. It is 2208% greater than the overall U.S. average. On 10/28/1983 at 14:06:06, a magnitude 7.3 (6.2 MB, 7.3 MS, 7.0 MW, Class: Major, Intensity: VIII - XII) earthquake occurred 126.5 miles away from the city center, causing 2 deaths ( 2 shaking deaths) and 3 injuries, causing $15,000,000 total damage On 10/3/1915 at 06:52:48, a magnitude 7.6 (7.6 UK) earthquake occurred 226.6 miles away from Garden City center On 8/18/1959 at 06:37:13, a magnitude 7.7 (7.7 UK) earthquake occurred 285.8 miles away from the city center, causing $26,000,000 total damage On 3/31/2020 at 23:52:30, a magnitude 6.5 (6.5 MW, Depth: 7.5 mi, Class: Strong, Intensity: VII - IX) earthquake occurred 80.4 miles away from the city center On 12/16/1954 at 11:07:12, a magnitude 7.0 (7.0 UK) earthquake occurred 320.3 miles away from the city center On 12/21/1932 at 06:10:09, a magnitude 7.2 (7.2 UK) earthquake occurred 367.6 miles away from Garden City center Magnitude types: body-wave magnitude (MB), surface-wave magnitude (MS), moment magnitude (MW) Natural disasters: The number of natural disasters in Ada County (5) is a lot smaller than the US average (15).Major Disasters (Presidential) Declared: 2Emergencies Declared: 1Floods: 2, Fire: 1, Heavy Rain: 1, Hurricane: 1, Other: 1 (Note: some incidents may be assigned to more than one category). Hospitals and medical centers near Garden City: CAPITAL CARE CENTER (Nursing Home, about 1 miles away; BOISE, ID)
CAPITOL CARE AND REHABILITATION CENTER (Nursing Home, about 1 miles away; BOISE, ID)
ALL VALLEY HOSPICE (Hospital, about 2 miles away; BOISE, ID)
GOOD SAMARITAN SOCIETY - BOISE VILLAGE (Nursing Home, about 2 miles away; BOISE, ID)
SUNHEALTH BEHAVIORAL HEALTH SYSTEM FOR BOISE (Hospital, about 2 miles away; BOISE, ID)
LIFE CARE CENTER OF VALLEY VIEW (Nursing Home, about 3 miles away; BOISE, ID)
INDEPENDENT LIVING SERVICES (SUMMERWIND) (Hospital, about 3 miles away; BOISE, ID)
Amtrak stations near Garden City: 4 miles: BOISE (1212 W. BANNOCK ST.) - Bus Station Services: enclosed waiting area, public restrooms, public payphones, vending machines, free short-term parking, free long-term parking, call for car rental service, call for taxi service, intercity bus service, public transit connection.
16 miles: NAMPA (1424 2ND ST. S.) - Bus Station Services: public payphones, free short-term parking.
Colleges/universities with over 2000 students nearest to Garden City:
Boise State University (about 5 miles; Boise, ID ; Full-time enrollment: 16,774)
College of Western Idaho (about 13 miles; Nampa, ID ; FT enrollment: 6,300)
Northwest Nazarene University (about 17 miles; Nampa, ID ; FT enrollment: 2,290)
Treasure Valley Community College (about 44 miles; Ontario, OR ; FT enrollment: 2,055)
College of Southern Idaho (about 117 miles; Twin Falls, ID ; FT enrollment: 5,051)
Eastern Oregon University (about 147 miles; La Grande, OR ; FT enrollment: 3,127)
Lewis-Clark State College (about 195 miles; Lewiston, ID ; FT enrollment: 3,199)
Public elementary/middle school in Garden City:
See full list of schools located in Garden City Library in Garden City: GARDEN CITY PUBLIC Operating income: $499,552; Location: 6015 GLENWOOD ST; 38,492 books ; 2,780 audio materials ; 3,002 video materials ; 5 local licensed databases ; 51 state licensed databases ; 80 print serial subscriptions )
User-submitted facts and corrections:
The Garden City Library is located at 6015 Glenwood Street
Notable locations in Garden City: (A) , Ada County Paramedics Medical Station 56 (B) , North Ada County Fire and Rescue Station 1 (C) , North Ada County Fire and Rescue Station 2 (D) . Display/hide their locations on the map
Shopping Center: (1) . Display/hide its location on the map
Lake: (A) . Display/hide its location on the map
Tourist attractions:
Ada County has a predicted average indoor radon screening level between 2 and 4 pCi/L (pico curies per liter) - Moderate Potential Drinking water stations with addresses in Garden City and their reported violations in the past:
GARDEN CITY WATER AND SEWER SYSTEM (Population served: 12,500, Groundwater):
Past monitoring violations:
Monitoring and Reporting (DBP) - Between OCT-2013 and DEC-2013, Contaminant: Chlorine
22 regular monitoring violations
Average household size: This city:
2.2 peopleIdaho:
2.7 people
Percentage of family households: This city:
58.4%Whole state:
69.6%
Percentage of households with unmarried partners: This city:
7.5%Whole state:
6.3%
Likely homosexual households (counted as self-reported same-sex unmarried-partner households)
Lesbian couples: 0.5% of all households Gay men: 0.3% of all households
People in group quarters in Garden City in 2010:
55 people in nursing facilities/skilled-nursing facilities
49 people in local jails and other municipal confinement facilities
20 people in correctional residential facilities
2 people in group homes intended for adults
people in other noninstitutional group quarters in 2000people in college dormitories (includes college quarters off campus) in 2000Banks with branches in Garden City (2011 data):
Wells Fargo Bank, National Association: Garden City Branch at 3301 W Chinden Boulevard, branch established on 1964/06/08. Info updated 2011/04/05: Bank assets: $1,161,490.0 mil, Deposits: $905,653.0 mil, headquarters in Sioux Falls, SD, positive income , 6395 total offices , Holding Company: Wells Fargo & Company
Washington Trust Bank: State Street at 7309 W. State Street, branch established on 2003/11/10. Info updated 2009/02/17: Bank assets: $4,172.4 mil, Deposits: $3,522.4 mil, headquarters in Spokane, WA, positive income , Commercial Lending Specialization, 41 total offices , Holding Company: W.T.b. Financial Corporation
JPMorgan Chase Bank, National Association: Garden City Branch at 5425 Chinden Boulevard, branch established on 1994/07/18. Info updated 2011/11/10: Bank assets: $1,811,678.0 mil, Deposits: $1,190,738.0 mil, headquarters in Columbus, OH, positive income , International Specialization, 5577 total offices , Holding Company: Jpmorgan Chase & Co.
Bank of the Cascades: Garden City Branch at 4128 Adams Street, branch established on 1998/09/08. Info updated 2007/01/18: Bank assets: $1,334.8 mil, Deposits: $1,087.3 mil, headquarters in Bend, OR, negative income in the last year , Commercial Lending Specialization, 35 total offices , Holding Company: Cascade Bancorp
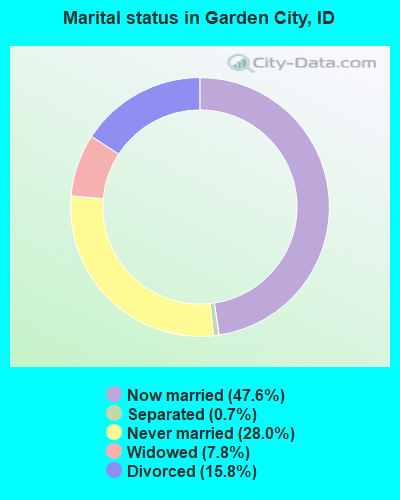
For population 15 years and over in Garden City:
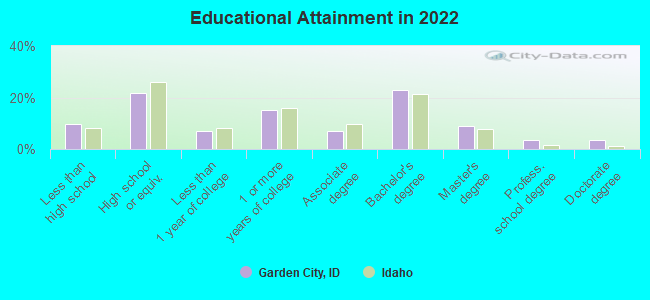
Never married: 28.0%Now married: 47.6%Separated: 0.7%Widowed: 7.8%Divorced: 15.8% For population 25 years and over in Garden City:
High school or higher: 91.5%Bachelor's degree or higher: 36.4%Graduate or professional degree: 14.2%Unemployed: 5.1%Mean travel time to work (commute): 16.3 minutes
Education Gini index (Inequality in education) Here:
14.3Idaho average:
11.0
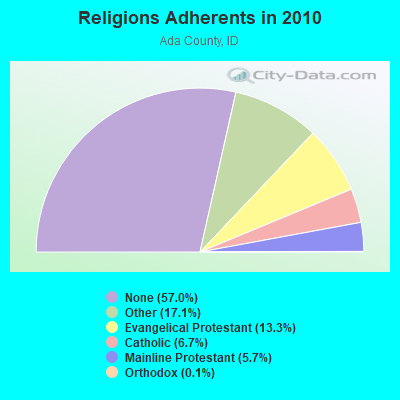
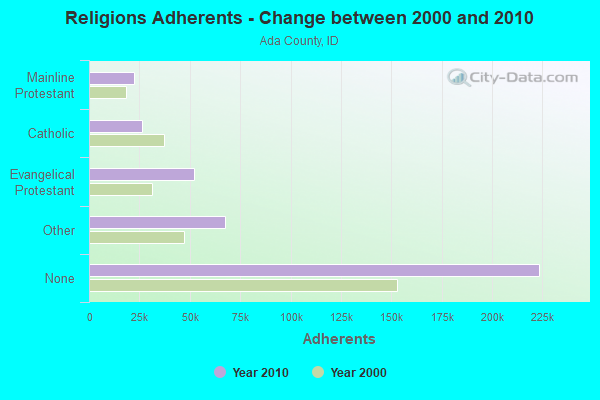
Religion statistics for Garden City, ID (based on Ada County data)
Religion Adherents Congregations Other 67,288 156 Evangelical Protestant 52,126 147 Catholic 26,302 9 Mainline Protestant 22,441 37 Orthodox 420 4 Black Protestant 252 2 None 223,536 -
Source: Clifford Grammich, Kirk Hadaway, Richard Houseal, Dale E.Jones, Alexei Krindatch, Richie Stanley and Richard H.Taylor. 2012. 2010 U.S.Religion Census: Religious Congregations & Membership Study. Association of Statisticians of American Religious Bodies. Jones, Dale E., et al. 2002. Congregations and Membership in the United States 2000. Nashville, TN: Glenmary Research Center. Graphs represent county-level data
Food Environment Statistics: Number of grocery stores : 46Here :
1.23 / 10,000 pop.State :
1.88 / 10,000 pop.
Number of supercenters and club stores : 10Ada County :
0.27 / 10,000 pop.State :
0.28 / 10,000 pop.
Number of convenience stores (no gas) : 7Ada County :
0.19 / 10,000 pop.Idaho :
0.53 / 10,000 pop.
Number of convenience stores (with gas) : 99This county :
2.65 / 10,000 pop.Idaho :
3.87 / 10,000 pop.
Number of full-service restaurants : 291Here :
7.80 / 10,000 pop.Idaho :
7.75 / 10,000 pop.
Adult obesity rate : This county :
22.1%Idaho :
25.7%
Low-income preschool obesity rate : Ada County :
10.1%Idaho :
11.7%
Health and Nutrition: Healthy diet rate : Garden City:
49.6%Idaho:
48.7%
Average overall health of teeth and gums : This city:
47.2%Idaho:
45.7%
People feeling badly about themselves : Garden City:
21.2%Idaho:
21.8%
People not drinking alcohol at all : Average hours sleeping at night : Overweight people : Garden City:
33.1%Idaho:
33.4%
General health condition : Garden City:
56.7%Idaho:
56.0%
Average condition of hearing : Garden City:
78.8%Idaho:
78.5%
More about Health and Nutrition of Garden City, ID Residents
Local government employment and payroll (March 2022)
Function
Full-time employees
Monthly full-time payroll
Average yearly full-time wage
Part-time employees
Monthly part-time payroll
Police Protection - Officers
25 $244,882 $117,543 0 $0 Other Government Administration
9 $57,908 $77,211 2 $1,864 Police - Other
8 $33,980 $50,970 1 $929 Sewerage
7 $39,246 $67,279 0 $0 Financial Administration
7 $30,865 $52,911 0 $0 Local Libraries
6 $30,531 $61,062 12 $13,319 Water Supply
5 $23,921 $57,410 0 $0 Parks and Recreation
2 $7,936 $47,616 0 $0 Judicial and Legal
2 $14,488 $86,928 2 $1,264
Totals for Government
71 $483,757 $81,762 17 $17,376
Garden City government finances - Expenditure in 2021 (per resident):
Construction - Water Utilities: $350,000 ($27.08)
Current Operations - Police Protection: $4,748,000 ($367.29)
Sewerage: $2,822,000 ($218.30)Solid Waste Management: $2,242,000 ($173.44)Central Staff Services: $1,583,000 ($122.46)Libraries: $865,000 ($66.91)Water Utilities: $861,000 ($66.60)Parks and Recreation: $858,000 ($66.37)Judicial and Legal Services: $473,000 ($36.59)Financial Administration: $428,000 ($33.11)General - Interest on Debt: $16,000 ($1.24)
Other Capital Outlay - Police Protection: $165,000 ($12.76)
Water Utilities: $122,000 ($9.44)Sewerage: $29,000 ($2.24)Total Salaries and Wages: $5,286,000 ($408.91)
Water Utilities - Interest on Debt: $14,000 ($1.08)
Garden City government finances - Revenue in 2021 (per resident):
Charges - Sewerage: $3,330,000 ($257.60)
Solid Waste Management: $2,225,000 ($172.12)Miscellaneous - General Revenue - Other: $1,834,000 ($141.87)
Fines and Forfeits: $111,000 ($8.59)Interest Earnings: $76,000 ($5.88)Donations From Private Sources: $47,000 ($3.64)Revenue - Water Utilities: $2,872,000 ($222.17)
State Intergovernmental - General Local Government Support: $1,333,000 ($103.12)
Tax - Property: $4,605,000 ($356.23)
Alcoholic Beverage License: $37,000 ($2.86)Other License: $4,000 ($0.31)
Garden City government finances - Debt in 2021 (per resident):
Long Term Debt - Beginning Outstanding - Unspecified Public Purpose: $690,000 ($53.38)
Outstanding Unspecified Public Purpose: $470,000 ($36.36)Retired Unspecified Public Purpose: $220,000 ($17.02)
Garden City government finances - Cash and Securities in 2021 (per resident):
Other Funds - Cash and Securities: $6,392,000 ($494.47)
Sinking Funds - Cash and Securities: $157,000 ($12.15)
8.72% of this county's 2021 resident taxpayers lived in other counties in 2020 ($85,598 average adjusted gross income )
Here:
8.72%Idaho average:
9.53%
0.03% of residents moved from foreign countries ($213 average AGI )Ada County:
0.03%Idaho average:
0.03%
Top counties from which taxpayers relocated into this county between 2020 and 2021:
7.23% of this county's 2020 resident taxpayers moved to other counties in 2021 ($67,504 average adjusted gross income )
Here:
7.23%Idaho average:
7.66%
0.02% of residents moved to foreign countries ($112 average AGI )Ada County:
0.02%Idaho average:
0.02%
Top counties to which taxpayers relocated from this county between 2020 and 2021:
Businesses in Garden City, ID
Name Count Name Count
AT&T 1 SONIC Drive-In 1 Applebee's 1 Starbucks 1 Carl\s Jr. 1 Subway 1 Dairy Queen 1 Taco Bell 1 FedEx 1 U-Haul 1 KFC 1 Walgreens 2 Kroger 2 Wendy's 1 Panda Express 1
Strongest AM radio stations in Garden City:
KGEM (1140 AM; 10 kW; BOISE, ID; Owner: JOURNAL BROADCAST CORPORATION)
KBOI (670 AM; 50 kW; BOISE, ID; Owner: CITADEL BROADCASTING COMPANY)
KBSU (730 AM; 15 kW; BOISE, ID; Owner: IDAHO STATE BOARD OF EDUCATION)
KIDO (580 AM; 5 kW; NAMPA, ID; Owner: CITICASTERS LICENSES, L.P.)
KFXD (630 AM; 5 kW; BOISE, ID; Owner: CITICASTERS LICENSES, L.P.)
KBGN (1060 AM; daytime; 10 kW; CALDWELL, ID; Owner: NELSON M. AND KAREN E. WILSON)
KTIK (1350 AM; 5 kW; NAMPA, ID; Owner: CITADEL BROADCASTING COMPANY)
KSPD (790 AM; 1 kW; BOISE, ID; Owner: KSPD, INC.)
KKIC (950 AM; 4 kW; BOISE, ID; Owner: WESTERN PACIFIC, INC)
KWEI (1260 AM; 50 kW; WEISER, ID; Owner: TREASURE VALLEY BROADCASTING CO.)
KCID (1490 AM; 1 kW; CALDWELL, ID; Owner: JOURNAL BROADCAST CORPORATION)
KSRV (1380 AM; 5 kW; ONTARIO, OR; Owner: HBG-RADIO ONTARIO LLC)
KALL (700 AM; 50 kW; NORTH SALT LAKE CITY, UT; Owner: CITICASTERS LICENSES, L.P.)
Strongest FM radio stations in Garden City:
KBSX (91.5 FM; BOISE, ID; Owner: IDAHO STATE BOARD OF EDUCATION)
KIZN (92.3 FM; BOISE, ID; Owner: CITADEL BROADCASTING COMPANY)
KKGL (96.9 FM; NAMPA, ID; Owner: CITADEL BROADCASTING COMPANY)
KQFC (97.9 FM; BOISE, ID; Owner: CITADEL BROADCASTING COMPANY)
KZMG (93.1 FM; NEW PLYMOUTH, ID; Owner: CITADEL BROADCASTING COMPANY)
KBSU-FM (90.3 FM; BOISE, ID; Owner: IDAHO STATE BOARD OF EDUCATION)
KCIX (105.9 FM; GARDEN CITY, ID; Owner: CITICASTERS LICENSES, L.P.)
KRVB (94.9 FM; NAMPA, ID; Owner: JOURNAL BROADCAST CORPORATION)
KXLT-FM (107.9 FM; EAGLE, ID; Owner: CITICASTERS LICENSES, L.P.)
KJOT (105.1 FM; BOISE, ID; Owner: JOURNAL BROADCAST CORPORATION)
KTHI (107.1 FM; CALDWELL, ID; Owner: JOURNAL BROADCAST CORPORATION)
KBXL (94.1 FM; CALDWELL, ID; Owner: KSPD, INC.)
KTSY (89.5 FM; CALDWELL, ID; Owner: GEM STATE ADVENTIST ACADEMY)
KSAS-FM (103.3 FM; CALDWELL, ID; Owner: CITICASTERS LICENSES, L.P.)
KLTB (104.3 FM; BOISE, ID; Owner: CITICASTERS LICENSES, L.P.)
K239AC (95.7 FM; GARDEN CITY, ID; Owner: CALVARY CHAPEL OF TWIN FALLS, INC.)
KJHY (101.9 FM; EMMETT, ID; Owner: CAPITAL WEST INC)
KWEI-FM (99.5 FM; FRUITLAND, ID; Owner: TREASURE VALLEY BROADCASTING CO.)
KQXR (100.3 FM; PAYETTE, ID; Owner: JOURNAL BROADCAST CORPORATION)
KSRV-FM (96.1 FM; ONTARIO, OR; Owner: HBG-RADIO ONTARIO LLC)
TV broadcast stations around Garden City:
KTRV (Channel 12; NAMPA, ID; Owner: IDAHO INDEPENDENT TELEVISION, INC.)
K35GE (Channel 35; BOISE, ID; Owner: EQUITY BROADCASTING CORPORATION)
K30GS (Channel 30; BOISE, ID; Owner: MS COMMUNICATIONS, LLC)
KBCI-TV (Channel 2; BOISE, ID; Owner: FISHER BROADCASTING - IDAHO TV, L.L.C.)
K17ED (Channel 17; PAYETTE, ID; Owner: DOUG GARCIA)
KAID (Channel 4; BOISE, ID; Owner: STATE BOARD OF EDUCATION, STATE OF IDAHO)
KIVI (Channel 6; NAMPA, ID; Owner: JOURNAL BROADCAST CORPORATION)
KNIN-TV (Channel 9; CALDWELL, ID; Owner: BANKS-BOISE, INC.)
KTVB (Channel 7; BOISE, ID; Owner: KING BROADCASTING COMPANY)
K31FD (Channel 25; BOISE, ID; Owner: THREE ANGELS BROADCASTING NETWORK)
K60FH (Channel 60; BOISE, ID; Owner: MS COMMUNICATIONS, LLC)
K64EJ (Channel 64; BOISE, ID; Owner: GARY M. COCOLA FAMILY TRUST, GARY M. COCOLA, TRUSTEE)
K56FQ (Channel 56; BOISE, ID; Owner: MS COMMUNICATIONS, LLC)
K47BE (Channel 47; BOISE, ID; Owner: TRINITY BROADCASTING NETWORK)
KCLP-CA (Channel 22; BOISE, ID; Owner: ALPHA & OMEGA COMMUNICATIONS, L.L.C.)
KBSE-LP (Channel 33; BOISE/NAMPA/CALDWELL, ID; Owner: GARY M. COCOLA FAMILY TRUST)
KITL-LP (Channel 20; BOISE, ID; Owner: GARY M. COCOLA, TRUSTEE, GARY M. COCOLA FAMILY TRUST)
KIWB-LP (Channel 43; BOISE, ID; Owner: GARY M. COCOLA, TRUSTEE, GARY M. COCOLA, FAMILY TRUST)
National Bridge Inventory (NBI) Statistics 9 Number of bridges787ft / 240m Total length $75,475,000 Total costs77,500 Total average daily traffic5,684 Total average daily truck traffic
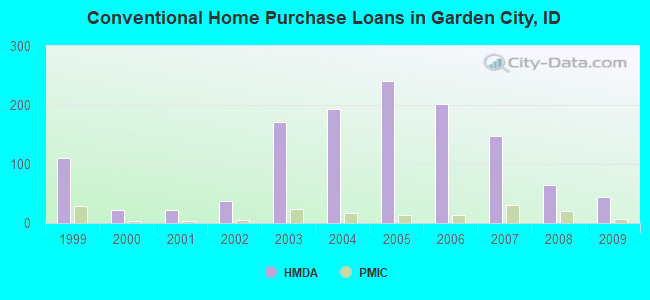
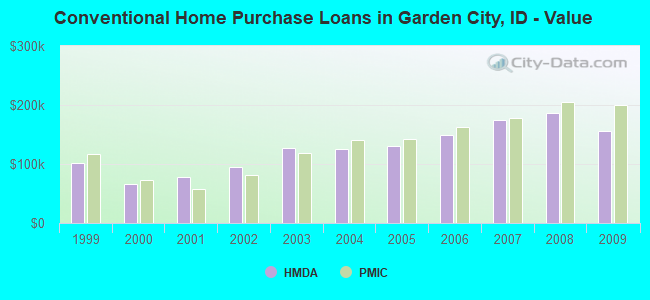
Home Mortgage Disclosure Act Aggregated Statistics For Year 2009(Based on 4 partial tracts) A) FHA, FSA/RHS & VA B) Conventional C) Refinancings D) Home Improvement Loans F) Non-occupant Loans on G) Loans On Manufactured Number Average Value Number Average Value Number Average Value Number Average Value Number Average Value Number Average Value
LOANS ORIGINATED 39 $159,810 44 $155,952 189 $163,463 7 $135,346 21 $144,966 4 $103,222 APPLICATIONS APPROVED, NOT ACCEPTED 2 $145,395 5 $213,760 31 $173,135 1 $163,480 2 $202,450 2 $58,400 APPLICATIONS DENIED 4 $118,110 7 $134,687 77 $179,088 5 $74,252 10 $193,675 6 $100,517 APPLICATIONS WITHDRAWN 2 $139,480 5 $137,324 35 $183,748 3 $45,013 2 $208,345 1 $85,090 FILES CLOSED FOR INCOMPLETENESS 0 $0 0 $0 11 $153,188 0 $0 0 $0 1 $110,960
Aggregated Statistics For Year 2008(Based on 4 partial tracts) A) FHA, FSA/RHS & VA B) Conventional C) Refinancings D) Home Improvement Loans F) Non-occupant Loans on G) Loans On Manufactured Number Average Value Number Average Value Number Average Value Number Average Value Number Average Value Number Average Value
LOANS ORIGINATED 24 $174,488 64 $186,371 113 $163,211 13 $111,316 21 $151,418 5 $94,906 APPLICATIONS APPROVED, NOT ACCEPTED 2 $163,885 8 $205,745 25 $150,834 1 $117,240 4 $129,568 3 $45,720 APPLICATIONS DENIED 5 $187,124 12 $159,604 85 $176,328 12 $130,073 9 $175,983 10 $86,220 APPLICATIONS WITHDRAWN 3 $170,697 7 $165,500 33 $170,438 3 $91,697 3 $165,293 1 $91,220 FILES CLOSED FOR INCOMPLETENESS 0 $0 2 $250,770 4 $153,778 1 $65,040 1 $329,700 0 $0
Aggregated Statistics For Year 2007(Based on 4 partial tracts) A) FHA, FSA/RHS & VA B) Conventional C) Refinancings D) Home Improvement Loans F) Non-occupant Loans on G) Loans On Manufactured Number Average Value Number Average Value Number Average Value Number Average Value Number Average Value Number Average Value
LOANS ORIGINATED 11 $176,576 148 $175,341 150 $160,663 27 $88,263 45 $150,771 8 $94,811 APPLICATIONS APPROVED, NOT ACCEPTED 1 $94,050 17 $155,138 35 $150,923 5 $79,214 7 $132,977 4 $73,305 APPLICATIONS DENIED 2 $178,190 25 $143,717 81 $171,027 17 $66,258 15 $107,560 9 $60,081 APPLICATIONS WITHDRAWN 0 $0 17 $188,149 35 $168,304 7 $109,637 7 $187,321 1 $116,750 FILES CLOSED FOR INCOMPLETENESS 0 $0 3 $146,703 7 $199,627 1 $125,990 2 $123,985 0 $0
Aggregated Statistics For Year 2006(Based on 4 partial tracts) A) FHA, FSA/RHS & VA B) Conventional C) Refinancings D) Home Improvement Loans E) Loans on Dwellings For 5+ Families F) Non-occupant Loans on G) Loans On Manufactured Number Average Value Number Average Value Number Average Value Number Average Value Number Average Value Number Average Value Number Average Value
LOANS ORIGINATED 11 $167,964 202 $148,472 203 $142,309 28 $50,209 0 $0 79 $132,504 9 $77,738 APPLICATIONS APPROVED, NOT ACCEPTED 0 $0 32 $124,064 36 $141,806 1 $67,600 0 $0 12 $137,554 6 $62,443 APPLICATIONS DENIED 1 $183,470 41 $127,950 93 $124,244 20 $80,776 0 $0 17 $130,042 17 $70,029 APPLICATIONS WITHDRAWN 2 $123,805 25 $131,904 51 $153,279 6 $68,460 1 $3,271,200 9 $141,457 1 $49,890 FILES CLOSED FOR INCOMPLETENESS 0 $0 2 $137,690 11 $145,460 2 $54,880 0 $0 2 $85,160 0 $0
Aggregated Statistics For Year 2005(Based on 4 partial tracts) A) FHA, FSA/RHS & VA B) Conventional C) Refinancings D) Home Improvement Loans E) Loans on Dwellings For 5+ Families F) Non-occupant Loans on G) Loans On Manufactured Number Average Value Number Average Value Number Average Value Number Average Value Number Average Value Number Average Value Number Average Value
LOANS ORIGINATED 14 $128,076 241 $131,293 168 $124,712 13 $46,008 1 $635,600 88 $117,825 9 $62,631 APPLICATIONS APPROVED, NOT ACCEPTED 2 $130,270 29 $130,907 35 $109,312 3 $93,940 0 $0 10 $102,536 2 $77,580 APPLICATIONS DENIED 2 $127,055 55 $124,217 99 $111,079 19 $33,378 0 $0 25 $132,464 17 $64,108 APPLICATIONS WITHDRAWN 3 $126,523 29 $147,843 68 $115,996 11 $121,883 0 $0 11 $125,280 2 $114,405 FILES CLOSED FOR INCOMPLETENESS 0 $0 4 $119,255 16 $141,138 0 $0 0 $0 1 $162,650 0 $0
Aggregated Statistics For Year 2004(Based on 4 partial tracts) A) FHA, FSA/RHS & VA B) Conventional C) Refinancings D) Home Improvement Loans F) Non-occupant Loans on G) Loans On Manufactured Number Average Value Number Average Value Number Average Value Number Average Value Number Average Value Number Average Value
LOANS ORIGINATED 23 $121,802 193 $126,155 157 $120,411 9 $41,123 49 $101,115 6 $49,842 APPLICATIONS APPROVED, NOT ACCEPTED 1 $92,990 21 $118,042 31 $111,941 1 $30,730 3 $79,720 2 $28,235 APPLICATIONS DENIED 4 $115,465 34 $85,338 99 $104,916 19 $29,254 11 $89,516 15 $63,226 APPLICATIONS WITHDRAWN 2 $94,410 18 $118,119 41 $113,703 4 $93,625 5 $104,878 2 $48,895 FILES CLOSED FOR INCOMPLETENESS 0 $0 2 $93,595 14 $148,743 1 $29,600 0 $0 0 $0
Aggregated Statistics For Year 2003(Based on 4 partial tracts) A) FHA, FSA/RHS & VA B) Conventional C) Refinancings D) Home Improvement Loans E) Loans on Dwellings For 5+ Families F) Non-occupant Loans on Number Average Value Number Average Value Number Average Value Number Average Value Number Average Value Number Average Value
LOANS ORIGINATED 43 $116,454 171 $126,747 445 $124,372 12 $30,309 1 $395,350 54 $99,911 APPLICATIONS APPROVED, NOT ACCEPTED 2 $90,185 23 $119,837 47 $111,054 1 $16,930 0 $0 7 $66,409 APPLICATIONS DENIED 5 $104,198 38 $74,985 109 $93,557 12 $22,058 0 $0 16 $83,712 APPLICATIONS WITHDRAWN 2 $127,770 19 $118,490 63 $105,000 2 $36,750 0 $0 11 $73,252 FILES CLOSED FOR INCOMPLETENESS 0 $0 2 $122,415 15 $114,431 1 $28,950 0 $0 2 $104,080
Aggregated Statistics For Year 2002(Based on 1 partial tract) A) FHA, FSA/RHS & VA B) Conventional C) Refinancings D) Home Improvement Loans F) Non-occupant Loans on Number Average Value Number Average Value Number Average Value Number Average Value Number Average Value
LOANS ORIGINATED 15 $97,318 38 $94,133 38 $105,475 6 $9,542 8 $83,006 APPLICATIONS APPROVED, NOT ACCEPTED 2 $98,135 22 $88,322 13 $132,421 1 $8,180 2 $85,050 APPLICATIONS DENIED 3 $85,597 25 $61,826 16 $62,255 9 $6,633 2 $107,540 APPLICATIONS WITHDRAWN 6 $86,142 4 $98,340 11 $93,898 2 $6,950 2 $58,880 FILES CLOSED FOR INCOMPLETENESS 0 $0 4 $84,848 2 $47,840 0 $0 1 $74,420
Aggregated Statistics For Year 2001(Based on 1 partial tract) A) FHA, FSA/RHS & VA B) Conventional C) Refinancings D) Home Improvement Loans E) Loans on Dwellings For 5+ Families F) Non-occupant Loans on Number Average Value Number Average Value Number Average Value Number Average Value Number Average Value Number Average Value
LOANS ORIGINATED 9 $86,232 22 $77,580 24 $83,927 4 $15,130 0 $0 6 $66,923 APPLICATIONS APPROVED, NOT ACCEPTED 1 $48,250 11 $50,332 4 $43,342 0 $0 0 $0 2 $40,480 APPLICATIONS DENIED 1 $64,610 19 $44,463 13 $81,592 4 $3,475 1 $4,090 2 $27,805 APPLICATIONS WITHDRAWN 1 $215,900 7 $62,737 15 $64,388 1 $12,270 0 $0 1 $46,610 FILES CLOSED FOR INCOMPLETENESS 1 $77,690 0 $0 3 $122,397 0 $0 0 $0 0 $0
Aggregated Statistics For Year 2000(Based on 1 partial tract) A) FHA, FSA/RHS & VA B) Conventional C) Refinancings D) Home Improvement Loans F) Non-occupant Loans on Number Average Value Number Average Value Number Average Value Number Average Value Number Average Value
LOANS ORIGINATED 10 $80,553 22 $65,647 8 $67,571 3 $6,817 2 $94,455 APPLICATIONS APPROVED, NOT ACCEPTED 4 $40,480 17 $49,597 5 $73,766 1 $4,090 2 $65,015 APPLICATIONS DENIED 9 $71,149 53 $45,457 16 $70,126 3 $39,527 4 $52,135 APPLICATIONS WITHDRAWN 1 $26,990 11 $82,226 4 $58,678 0 $0 1 $61,340 FILES CLOSED FOR INCOMPLETENESS 1 $56,430 3 $43,343 3 $60,790 0 $0 1 $45,800
Aggregated Statistics For Year 1999(Based on 3 partial tracts) A) FHA, FSA/RHS & VA B) Conventional C) Refinancings D) Home Improvement Loans F) Non-occupant Loans on Number Average Value Number Average Value Number Average Value Number Average Value Number Average Value
LOANS ORIGINATED 30 $101,945 110 $100,937 93 $87,838 15 $14,601 22 $63,145 APPLICATIONS APPROVED, NOT ACCEPTED 1 $140,330 24 $64,538 18 $87,307 4 $15,922 2 $44,225 APPLICATIONS DENIED 4 $77,288 90 $56,792 53 $71,505 11 $19,355 4 $77,978 APPLICATIONS WITHDRAWN 1 $106,960 15 $85,049 28 $81,596 3 $37,603 2 $75,600 FILES CLOSED FOR INCOMPLETENESS 0 $0 5 $104,826 9 $94,208 0 $0 0 $0
Detailed HMDA statistics for the following Tracts:
0003.01
, 0011.00 , 0024.12 , 0102.23
Private Mortgage Insurance Companies Aggregated Statistics For Year 2009(Based on 4 partial tracts) A) Conventional B) Refinancings Number Average Value Number Average Value
LOANS ORIGINATED 6 $199,697 5 $159,310 APPLICATIONS APPROVED, NOT ACCEPTED 2 $189,250 2 $196,440 APPLICATIONS DENIED 1 $207,090 0 $0 APPLICATIONS WITHDRAWN 0 $0 0 $0 FILES CLOSED FOR INCOMPLETENESS 0 $0 0 $0
Aggregated Statistics For Year 2008(Based on 4 partial tracts) A) Conventional B) Refinancings C) Non-occupant Loans on Number Average Value Number Average Value Number Average Value
LOANS ORIGINATED 21 $205,118 10 $185,848 3 $159,193 APPLICATIONS APPROVED, NOT ACCEPTED 6 $220,820 7 $165,339 1 $85,150 APPLICATIONS DENIED 2 $273,835 1 $282,450 1 $191,770 APPLICATIONS WITHDRAWN 1 $357,420 0 $0 0 $0 FILES CLOSED FOR INCOMPLETENESS 0 $0 0 $0 0 $0
Aggregated Statistics For Year 2007(Based on 4 partial tracts) A) Conventional B) Refinancings C) Non-occupant Loans on D) Loans On Manufactured Number Average Value Number Average Value Number Average Value Number Average Value
LOANS ORIGINATED 31 $178,195 7 $175,006 3 $149,880 1 $105,500 APPLICATIONS APPROVED, NOT ACCEPTED 4 $196,748 1 $254,220 1 $254,950 0 $0 APPLICATIONS DENIED 0 $0 0 $0 0 $0 0 $0 APPLICATIONS WITHDRAWN 0 $0 0 $0 0 $0 0 $0 FILES CLOSED FOR INCOMPLETENESS 0 $0 0 $0 0 $0 0 $0
Aggregated Statistics For Year 2006(Based on 4 partial tracts) A) Conventional B) Refinancings C) Non-occupant Loans on Number Average Value Number Average Value Number Average Value
LOANS ORIGINATED 14 $163,514 4 $198,278 2 $151,285 APPLICATIONS APPROVED, NOT ACCEPTED 1 $208,650 1 $213,490 0 $0 APPLICATIONS DENIED 0 $0 0 $0 0 $0 APPLICATIONS WITHDRAWN 0 $0 0 $0 0 $0 FILES CLOSED FOR INCOMPLETENESS 0 $0 0 $0 0 $0
Aggregated Statistics For Year 2005(Based on 4 partial tracts) A) Conventional B) Refinancings C) Non-occupant Loans on Number Average Value Number Average Value Number Average Value
LOANS ORIGINATED 14 $141,793 12 $128,490 3 $139,333 APPLICATIONS APPROVED, NOT ACCEPTED 2 $138,255 2 $124,635 0 $0 APPLICATIONS DENIED 0 $0 0 $0 0 $0 APPLICATIONS WITHDRAWN 0 $0 0 $0 0 $0 FILES CLOSED FOR INCOMPLETENESS 0 $0 0 $0 0 $0
Aggregated Statistics For Year 2004(Based on 4 partial tracts) A) Conventional B) Refinancings C) Non-occupant Loans on Number Average Value Number Average Value Number Average Value
LOANS ORIGINATED 17 $140,677 11 $123,560 6 $113,915 APPLICATIONS APPROVED, NOT ACCEPTED 3 $173,587 3 $125,937 0 $0 APPLICATIONS DENIED 0 $0 0 $0 0 $0 APPLICATIONS WITHDRAWN 2 $130,045 1 $101,890 0 $0 FILES CLOSED FOR INCOMPLETENESS 0 $0 1 $96,090 0 $0
Aggregated Statistics For Year 2003(Based on 4 partial tracts) A) Conventional B) Refinancings C) Non-occupant Loans on Number Average Value Number Average Value Number Average Value
LOANS ORIGINATED 23 $118,220 33 $121,138 5 $112,342 APPLICATIONS APPROVED, NOT ACCEPTED 7 $106,591 7 $110,474 3 $71,743 APPLICATIONS DENIED 1 $101,360 2 $82,600 0 $0 APPLICATIONS WITHDRAWN 2 $200,475 1 $112,100 0 $0 FILES CLOSED FOR INCOMPLETENESS 0 $0 1 $93,450 0 $0
Aggregated Statistics For Year 2002(Based on 1 partial tract) A) Conventional B) Refinancings C) Non-occupant Loans on Number Average Value Number Average Value Number Average Value
LOANS ORIGINATED 5 $81,452 1 $56,430 1 $49,890 APPLICATIONS APPROVED, NOT ACCEPTED 1 $49,070 1 $107,130 0 $0 APPLICATIONS DENIED 0 $0 1 $103,040 0 $0 APPLICATIONS WITHDRAWN 0 $0 0 $0 0 $0 FILES CLOSED FOR INCOMPLETENESS 0 $0 0 $0 0 $0
Aggregated Statistics For Year 2001(Based on 1 partial tract) A) Conventional B) Refinancings C) Non-occupant Loans on Number Average Value Number Average Value Number Average Value
LOANS ORIGINATED 3 $58,063 3 $102,770 2 $33,530 APPLICATIONS APPROVED, NOT ACCEPTED 1 $40,070 1 $99,770 0 $0 APPLICATIONS DENIED 0 $0 0 $0 0 $0 APPLICATIONS WITHDRAWN 0 $0 0 $0 0 $0 FILES CLOSED FOR INCOMPLETENESS 0 $0 0 $0 0 $0
Aggregated Statistics For Year 2000(Based on 1 partial tract) A) Conventional B) Refinancings C) Non-occupant Loans on Number Average Value Number Average Value Number Average Value
LOANS ORIGINATED 3 $72,510 1 $48,250 2 $49,070 APPLICATIONS APPROVED, NOT ACCEPTED 0 $0 0 $0 0 $0 APPLICATIONS DENIED 0 $0 0 $0 0 $0 APPLICATIONS WITHDRAWN 0 $0 0 $0 0 $0 FILES CLOSED FOR INCOMPLETENESS 0 $0 0 $0 0 $0
Aggregated Statistics For Year 1999(Based on 3 partial tracts) A) Conventional B) Refinancings C) Non-occupant Loans on Number Average Value Number Average Value Number Average Value
LOANS ORIGINATED 29 $116,593 12 $113,446 3 $117,463 APPLICATIONS APPROVED, NOT ACCEPTED 2 $127,895 2 $110,800 0 $0 APPLICATIONS DENIED 1 $69,280 0 $0 0 $0 APPLICATIONS WITHDRAWN 0 $0 0 $0 0 $0 FILES CLOSED FOR INCOMPLETENESS 0 $0 0 $0 0 $0
Detailed PMIC statistics for the following Tracts:
0003.01
, 0011.00 , 0024.12 , 0102.23 Garden City compared to Idaho state average:
Unemployed percentage below state average. Length of stay since moving in significantly above state average. House age below state average. Percentage of population with a bachelor's degree or higher above state average. Garden City on our top lists :
#40 on the list of "Top 101 cities with largest percentage of males in occupations: personal care and service occupations (population 5,000+)"
#90 on the list of "Top 101 cities with the largest house values disparities (population 5,000+)"
#20 on the list of "Top 101 counties with the highest percentage of residents that exercised in the past month"
#26 on the list of "Top 101 counties with the largest decrease in the number of infant deaths per 1000 residents 2000-2006 to 2007-2013 (pop. 50,000+)"
#27 on the list of "Top 101 counties with highest percentage of residents voting for 3rd party candidates in the 2012 Presidential Election (pop. 50,000+)"
#29 on the list of "Top 101 counties with the most Other congregations"
#30 on the list of "Top 101 counties with the highest percentage of residents that keep firearms around their homes"
Top Patent Applicants
Ulrich Boettiger (15)
Claudia A. Delaney (13)
Wolfgang Mueller (13)
Lars Heineck (10)
Lars P. Heineck (8)
Paul H. Cooperrider (4)
Donald Westmoreland (2)
Brian P. Schmitz (2)
Daniel Donegan (2)
Kris K. Brown (2)
Total of 85 patent applications in 2008-2024.


 Recent articles from our blog. Our writers, many of them Ph.D. graduates or candidates, create easy-to-read articles on a wide variety of topics.

 (2.6 miles
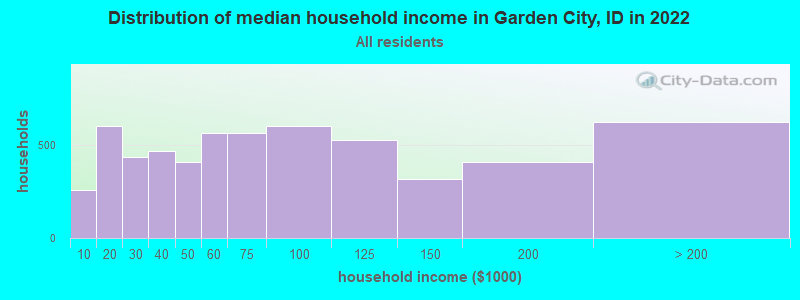


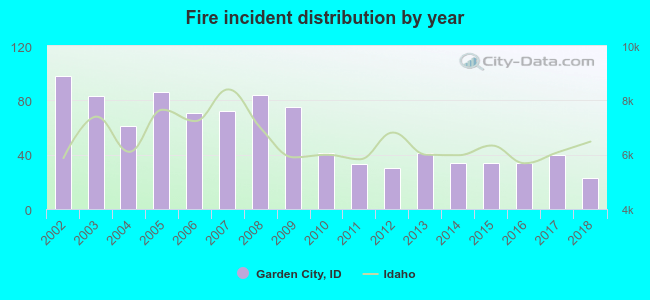 According to the data from the years 2002 - 2018 the average number of fires per year is 55. The highest number of fires - 98 took place in 2002, and the least - 23 in 2018. The data has a dropping trend.
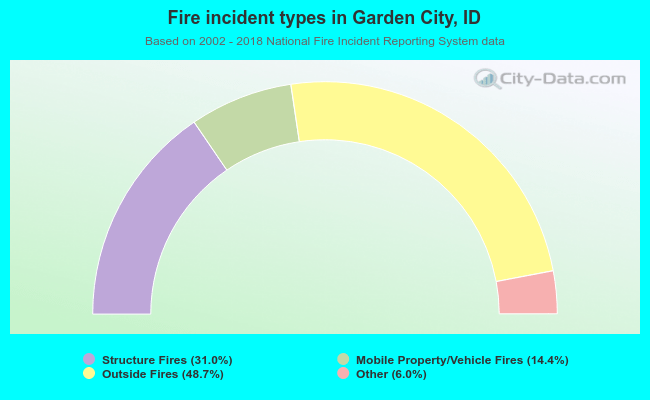 When looking into fire subcategories, the most incidents belonged to: Outside Fires (48.7%), and Structure Fires (31.0%).