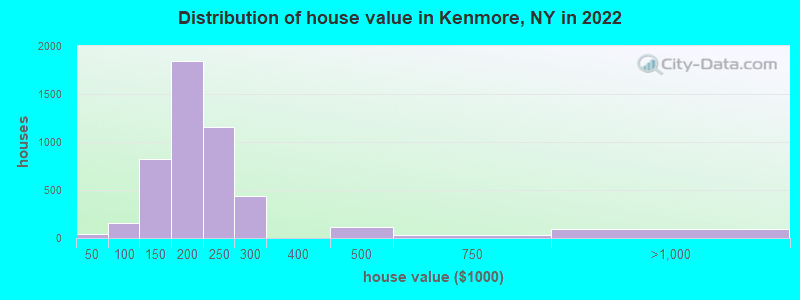
Estimated median house or condo value in 2022: $204,229 (it was $82,100 in 2000)
Kenmore:
$204,229
NY:
$400,400
Mean prices in 2022:all housing units: $244,055; detached houses: $258,042; townhouses or other attached units: $217,708; in 2-unit structures: $199,670; in 3-to-4-unit structures: $213,644; in 5-or-more-unit structures: $334,912; mobile homes: $67,367; occupied boats, rvs, vans, etc.: $89,496
Median gross rent in 2022: $994.
March 2022 cost of living index in Kenmore: 101.5 (near average, U.S. average is 100)
Percentage of residents living in poverty in 2022: 8.1%
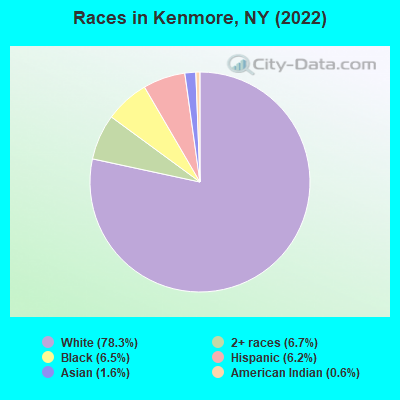
(4.9% for White Non-Hispanic residents, 12.8% for Black residents, 20.1% for Hispanic or Latino residents, 22.1% for American Indian residents, 38.4% for two or more races residents)
According to our research of New York and other state lists, there were 7 registered sex offenders living in Kenmore, New York as of May 21, 2024. The ratio of all residents to sex offenders in Kenmore is 2,184 to 1. The ratio of registered sex offenders to all residents in this city is lower than the state average.
Crime rates in Kenmore by year
Type
2009
2010
2011
2012
2013
2014
2015
2016
2017
2018
2019
2020
2022
Murders (per 100,000)
0 (0.0)
0 (0.0)
1 (6.5)
0 (0.0)
1 (6.6)
0 (0.0)
0 (0.0)
0 (0.0)
0 (0.0)
0 (0.0)
0 (0.0)
0 (0.0)
0 (0.0)
Rapes (per 100,000)
2 (13.5)
4 (25.9)
0 (0.0)
1 (6.5)
2 (13.1)
1 (6.6)
0 (0.0)
0 (0.0)
0 (0.0)
0 (0.0)
0 (0.0)
0 (0.0)
0 (0.0)
Robberies (per 100,000)
14 (94.2)
11 (71.3)
6 (38.7)
5 (32.3)
10 (65.5)
2 (13.1)
7 (46.1)
11 (72.8)
6 (39.8)
5 (32.9)
4 (26.6)
9 (60.1)
3 (20.0)
Assaults (per 100,000)
14 (94.2)
12 (77.8)
10 (64.5)
17 (109.8)
13 (85.2)
14 (92.0)
9 (59.2)
18 (119.1)
7 (46.4)
9 (59.3)
7 (46.6)
28 (187.1)
5 (33.3)
Burglaries (per 100,000)
54 (363.5)
49 (317.7)
57 (367.9)
71 (458.4)
34 (222.9)
46 (302.3)
42 (276.4)
40 (264.7)
38 (251.9)
20 (131.8)
23 (153.1)
27 (180.4)
14 (93.4)
Thefts (per 100,000)
229 (1,541)
279 (1,809)
231 (1,491)
256 (1,653)
181 (1,186)
260 (1,709)
269 (1,771)
202 (1,337)
188 (1,246)
159 (1,048)
147 (978.4)
201 (1,343)
135 (900.3)
Auto thefts (per 100,000)
14 (94.2)
11 (71.3)
8 (51.6)
8 (51.7)
5 (32.8)
9 (59.1)
9 (59.2)
5 (33.1)
5 (33.1)
6 (39.5)
5 (33.3)
14 (93.5)
23 (153.4)
Arson (per 100,000)
1 (6.7)
0 (0.0)
0 (0.0)
1 (6.5)
0 (0.0)
0 (0.0)
0 (0.0)
2 (13.2)
0 (0.0)
0 (0.0)
0 (0.0)
0 (0.0)
0 (0.0)
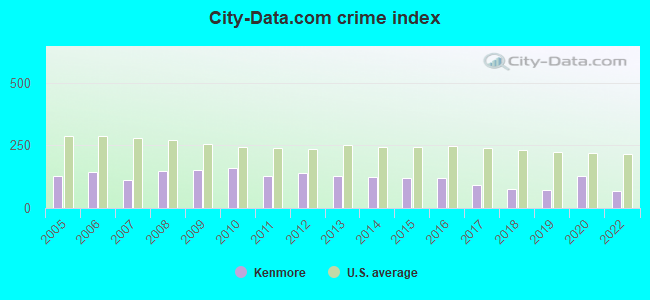
City-Data.com crime index
152.5
158.0
127.0
139.1
126.0
121.8
120.6
120.3
91.3
76.0
69.8
129.3
67.5
The City-Data.com crime index weighs serious crimes and violent crimes more heavily. Higher means more crime, U.S. average is 246.1. It adjusts for the number of visitors and daily workers commuting into cities.
Latest news from Kenmore, NY collected exclusively by city-data.com from local newspapers, TV, and radio stations
Ancestries: Italian (21.3%), Irish (13.0%), German (8.8%), Polish (8.4%), African (4.2%), European (3.5%).
Current Local Time: EST time zone
Incorporated in 1899
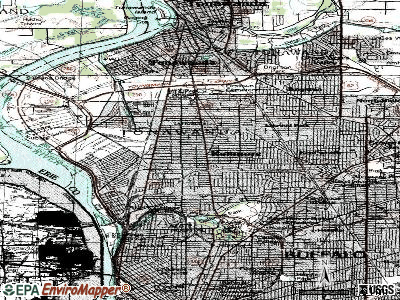
Land area: 1.44 square miles.
Population density: 10,453 people per square mile (high).
473 residents are foreign born (1.1% Asia, 0.7% North America, 0.5% Europe, 0.4% Africa, 0.4% Latin America).
This village:
3.1%
New York:
22.6%
Median real estate property taxes paid for housing units with mortgages in 2022: $4,590 (2.2%) Median real estate property taxes paid for housing units with no mortgage in 2022: $4,452 (2.2%)
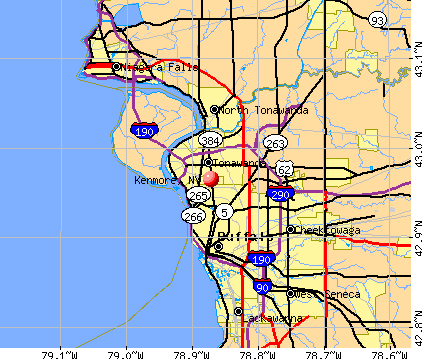
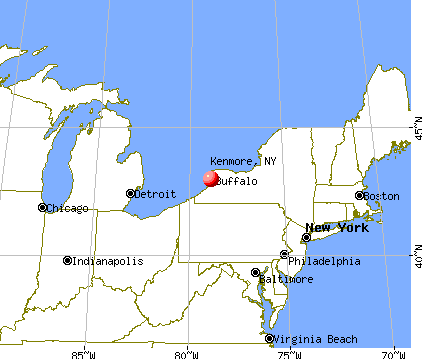
Nearest city with pop. 50,000+: Buffalo, NY (4.3 miles , pop. 292,648).
Nearest city with pop. 1,000,000+: Philadelphia, PA (281.7 miles , pop. 1,517,550).
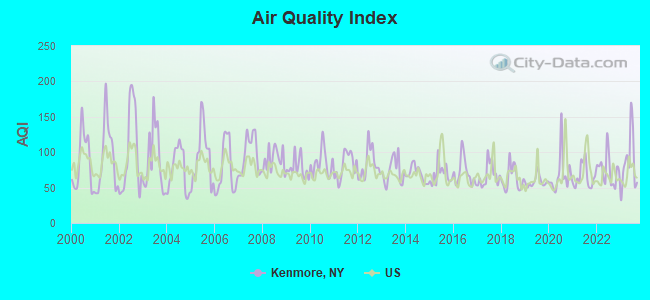
Air Quality Index (AQI) level in 2023 was 86.0. This is about average.
City:
86.0
U.S.:
72.6
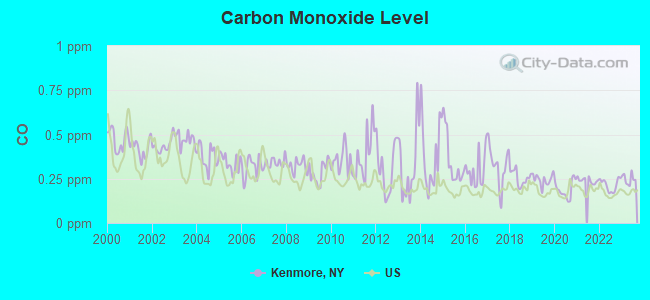
Carbon Monoxide (CO) [ppm] level in 2023 was 0.248. This is about average.Closest monitor was 2.4 miles away from the city center.
City:
0.248
U.S.:
0.251
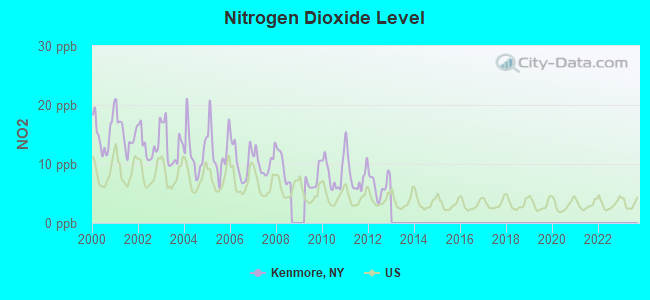
Nitrogen Dioxide (NO2) [ppb] level in 2012 was 6.43. This is worse than average.Closest monitor was 2.4 miles away from the city center.
City:
6.43
U.S.:
5.11
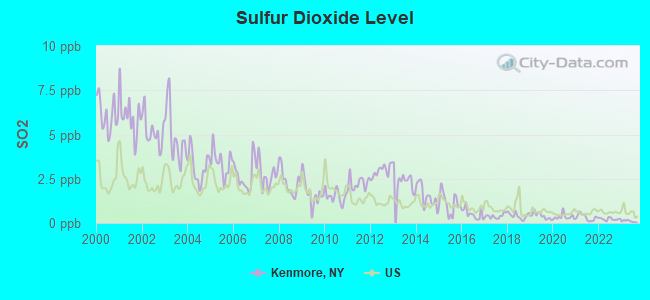
Sulfur Dioxide (SO2) [ppb] level in 2023 was 0.107. This is significantly better than average.Closest monitor was 0.8 miles away from the city center.
City:
0.107
U.S.:
1.515
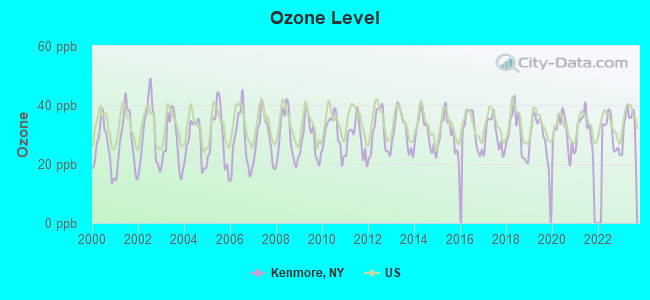
Ozone [ppb] level in 2023 was 33.8. This is about average.Closest monitor was 2.4 miles away from the city center.
City:
33.8
U.S.:
33.3
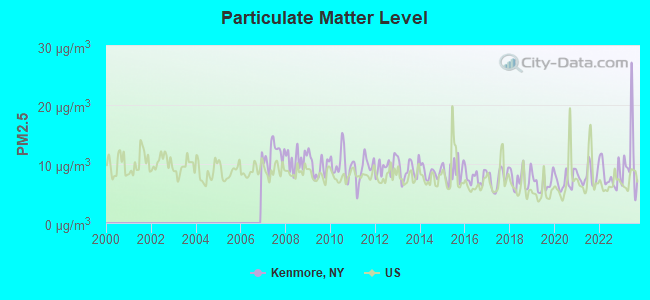
Particulate Matter (PM2.5) [µg/m3] level in 2023 was 10.6. This is worse than average.Closest monitor was 5.4 miles away from the city center.
City:
10.6
U.S.:
8.1
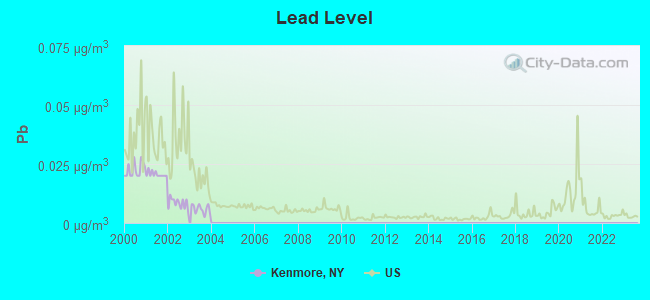
Lead (Pb) [µg/m3] level in 2003 was 0.00542. This is significantly better than average.Closest monitor was 1.9 miles away from the city center.
City:
0.00542
U.S.:
0.00931
Tornado activity:
Kenmore-area historical tornado activity is below New York state average. It is 76% smaller than the overall U.S. average.
On 8/19/1970, a category F3 (max. wind speeds 158-206 mph) tornado 20.4 miles away from the Kenmore village center injured 3 peopleand causedbetween $50,000 and $500,000 in damages.
On 7/7/1961, a category F2 (max. wind speeds 113-157 mph) tornado 4.6 miles away from the village center causedbetween $50,000 and $500,000 in damages.
Earthquake activity:
Kenmore-area historical earthquake activity is significantly above New York state average. It is 67% smaller than the overall U.S. average.
On 9/25/1998 at 19:52:52, a magnitude 5.2 (4.8 MB, 4.3 MS, 5.2 LG, 4.5 MW, Depth: 3.1 mi, Class: Moderate, Intensity: VI - VII) earthquake occurred 128.4 miles away from Kenmore center On 1/31/1986 at 16:46:43, a magnitude 5.0 (5.0 MB) earthquake occurred 150.3 miles away from the city center On 10/7/1983 at 10:18:46, a magnitude 5.3 (5.1 MB, 5.3 LG, 5.1 ML) earthquake occurred 237.4 miles away from Kenmore center On 8/23/2011 at 17:51:04, a magnitude 5.8 (5.8 MW, Depth: 3.7 mi) earthquake occurred 353.1 miles away from Kenmore center On 4/20/2002 at 10:50:47, a magnitude 5.3 (5.3 ML, Depth: 3.0 mi) earthquake occurred 279.8 miles away from the city center On 4/20/2002 at 10:50:47, a magnitude 5.2 (5.2 MB, 4.2 MS, 5.2 MW, 5.0 MW) earthquake occurred 278.2 miles away from Kenmore center Magnitude types: regional Lg-wave magnitude (LG), body-wave magnitude (MB), local magnitude (ML), surface-wave magnitude (MS), moment magnitude (MW)
Natural disasters:
The number of natural disasters in Erie County (22) is greater than the US average (15). Major Disasters (Presidential) Declared: 11 Emergencies Declared: 10
Causes of natural disasters: Storms: 8, Floods: 7, Snowstorms: 6, Hurricanes: 2, Snows: 2, Winter Storms: 2, Blizzard: 1, Ice Storm: 1, Power Outage: 1, Wind: 1, Other: 2 (Note: some incidents may be assigned to more than one category).
TOWN OF TONAWANDA PUBLIC LIBRARY (Operating income: $1,177,732; Location: 160 DELAWARE ROAD; 111,282 books; 8,126 audio materials; 10,414 video materials; 58 local licensed databases; 14 state licensed databases; 4 other licensed databases; 292 print serial subscriptions)
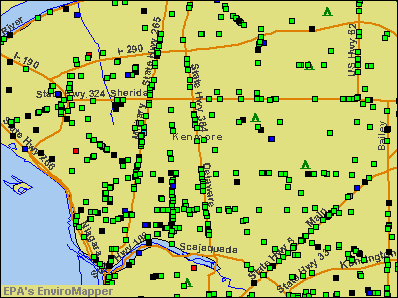
Notable locations in Kenmore: Village of Kenmore Fire Department (A), Town of Tonawanda Public Library Kenmore Branch (B). Display/hide their locations on the map
Churches in Kenmore include: Calvary Full Gospel Church (A), Church of the Advent (B), First Church of Christ Scientist (C), Kenmore Baptist Church (D), Kenmore Presbyterian Church (E), Kenmore United Methodist Church (F), Knox United Presbyterian Church (G), Pilgrim Evangelical Lutheran Church (H), Saint Paul's Roman Catholic Church (I). Display/hide their locations on the map
Birthplace of: Chris Lee (politician) - Former politician, Rusty Jeffers - Bodybuilder, Dan McFall - Ice hockey player.
Erie County has a predicted average indoor radon screening level greater than 4 pCi/L (pico curies per liter) - Highest Potential
Average household size:
This village:
2.2 people
New York:
2.6 people
Percentage of family households:
This village:
56.4%
Whole state:
63.5%
Percentage of households with unmarried partners:
This village:
6.5%
Whole state:
6.8%
Likely homosexual households (counted as self-reported same-sex unmarried-partner households)
Lesbian couples: 0.4% of all households
Gay men: 0.2% of all households
5 people in group homes intended for adults in 2010
2 people in group homes for juveniles (non-correctional) in 2010
People in group quarters in Kenmore in 2000:
92 people in other noninstitutional group quarters
18 people in homes for the physically handicapped
8 people in homes for the mentally retarded
8 people in religious group quarters
Banks with branches in Kenmore (2011 data):
Manufacturers and Traders Trust Company: Kenmore Drive-In Facility, Kenmore Branch, Delaware Sheridan Branch. Info updated 2011/08/08: Bank assets: $76,887.1 mil, Deposits: $60,064.2 mil, headquarters in Buffalo, NY, positive income, Commercial Lending Specialization, 808 total offices, Holding Company: M&T Bank Corporation
Bank of America, National Association: Delaware Sheridan Branch at 3588 Delaware Avenue, branch established on 1963/05/24. Info updated 2009/11/18: Bank assets: $1,451,969.3 mil, Deposits: $1,077,176.8 mil, headquarters in Charlotte, NC, positive income, 5782 total offices, Holding Company: Bank Of America Corporation
HSBC Bank USA, National Association: Kenmore Branch at 2853 Delaware Avenue, branch established on 1980/09/27. Info updated 2010/11/30: Bank assets: $206,009.7 mil, Deposits: $149,026.8 mil, headquarters in Mc Lean, VA, positive income, 474 total offices, Holding Company: Hsbc Holdings Plc
Northwest Savings Bank: Kenmore Branch at 2981 Delaware Ave., branch established on 2002/12/05. Info updated 2009/11/23: Bank assets: $7,975.9 mil, Deposits: $5,985.6 mil, headquarters in Warren, PA, positive income, Mortgage Lending Specialization, 172 total offices
RBS Citizens, National Association: Kenmore Branch at 1698 Sheridan Drive, branch established on 1997/10/03. Info updated 2007/09/19: Bank assets: $106,940.6 mil, Deposits: $75,690.2 mil, headquarters in Providence, RI, positive income, 1135 total offices, Holding Company: Uk Financial Investments Limited
KeyBank National Association: Kenmore Branch at 2858 Delaware Avenue, branch established on 1966/07/01. Info updated 2008/03/03: Bank assets: $86,198.8 mil, Deposits: $64,214.8 mil, headquarters in Cleveland, OH, positive income, Commercial Lending Specialization, 1067 total offices, Holding Company: Keycorp
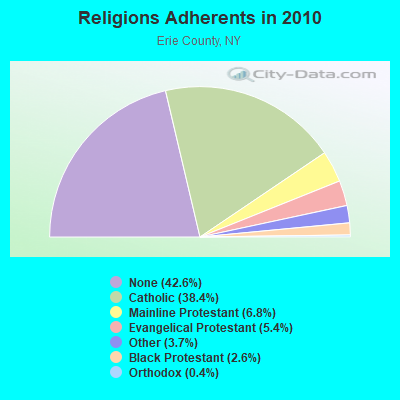
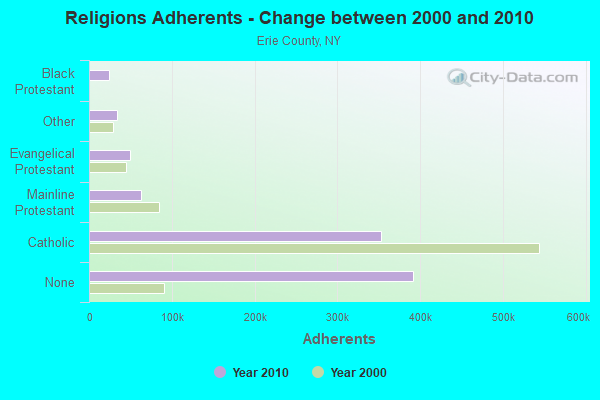
Religion statistics for Kenmore, NY (based on Erie County data)
Religion
Adherents
Congregations
Catholic
352,894
111
Mainline Protestant
62,675
212
Evangelical Protestant
49,435
209
Other
34,076
79
Black Protestant
24,192
69
Orthodox
4,103
9
None
391,665
-
Source: Clifford Grammich, Kirk Hadaway, Richard Houseal, Dale E.Jones, Alexei Krindatch, Richie Stanley and Richard H.Taylor. 2012. 2010 U.S.Religion Census: Religious Congregations & Membership Study. Association of Statisticians of American Religious Bodies. Jones, Dale E., et al. 2002. Congregations and Membership in the United States 2000. Nashville, TN: Glenmary Research Center. Graphs represent county-level data
Aircraft: CESSNA 182F (Category: Land, Seats: 4, Weight: Up to 12,499 Pounds, Speed: 119 mph), Engine: CONT MOTOR O-470 SERIES (230 HP) (Reciprocating) N-Number: 3410U, N3410U, N-3410U, Serial Number: 18254810, Year manufactured: 1963, Airworthiness Date: 04/24/1963, Certificate Issue Date: 01/03/2020 Registrant (Co-Owned): James A Greco, 131 Westchester Blvd, Kenmore, NY 14217, Other Owners: Dennis M Smith
Aircraft: MOONEY M20C (Category: Land, Seats: 4, Weight: Up to 12,499 Pounds, Speed: 127 mph), Engine: LYCOMING O&VO-360 SER (180 HP) (Reciprocating) N-Number: 6866N, N6866N, N-6866N, Serial Number: 680145, Year manufactured: 1968, Airworthiness Date: 09/24/1999, Certificate Issue Date: 02/14/2003 Registrant (Individual): Peter A Mancini, 354 Hamilton Blvd, Kenmore, NY 14217
Aircraft: TAYLORCRAFT BF (Category: Land, Seats: 2, Weight: Up to 12,499 Pounds, Speed: 78 mph), Engine: LYCOMING 0-145B SERIES (65 HP) (Reciprocating) N-Number: 29577, N29577, N-29577, Serial Number: 2420, Year manufactured: 1940 Registrant (Individual): Jerome A Caneen, 104 Tulane Rd, Kenmore, NY 14217 Deregistered:Cancel Date: 03/23/2018
Aircraft: 3D ROBOTICS SOLO (Category: Land, Engines: 4), Engine: Electric N-Number: 666NZ, N666NZ, N-666NZ, Serial Number: 121B Registrant (Individual): Reported Sale, 204 Knowlton Ave, Kenmore, NY 14217 Deregistered:Cancel Date: 05/31/2018
Aircraft: AERONCA 65-TAC (Category: Land, Seats: 2, Weight: Up to 12,499 Pounds, Speed: 71 mph), Engine: CONT MOTOR A&C65 SERIES (65 HP) (Reciprocating) N-Number: 39369, N39369, N-39369, Serial Number: C4342TA, Year manufactured: 1942 Registrant (Individual): Ted B Hollands, 55 Tremaine Ave, Kenmore, NY 14217 Deregistered:Cancel Date: 11/18/2017
Home Mortgage Disclosure Act Aggregated Statistics For Year 2009 (Based on 4 full tracts)
A) FHA, FSA/RHS & VA Home Purchase Loans
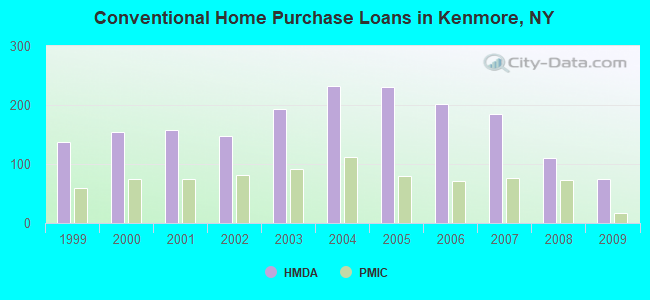
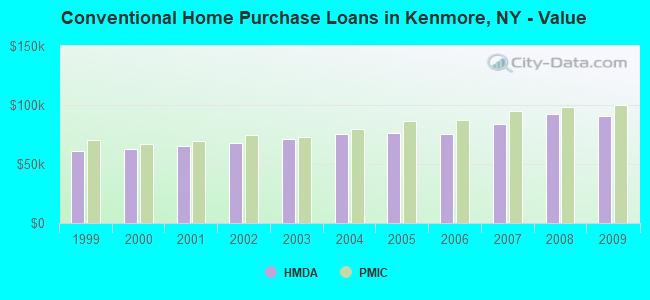
B) Conventional Home Purchase Loans
C) Refinancings
D) Home Improvement Loans
E) Loans on Dwellings For 5+ Families
F) Non-occupant Loans on < 5 Family Dwellings (A B C & D)
Number
Average Value
Number
Average Value
Number
Average Value
Number
Average Value
Number
Average Value
Number
Average Value
LOANS ORIGINATED
147
$102,238
75
$91,013
146
$92,445
11
$36,091
1
$14,217,000
11
$84,000
APPLICATIONS APPROVED, NOT ACCEPTED
3
$141,333
3
$88,333
22
$92,455
3
$18,000
0
$0
0
$0
APPLICATIONS DENIED
7
$96,429
7
$66,571
56
$90,786
14
$32,143
0
$0
7
$65,286
APPLICATIONS WITHDRAWN
11
$108,545
5
$129,000
35
$96,743
2
$92,500
0
$0
1
$71,000
FILES CLOSED FOR INCOMPLETENESS
2
$72,500
1
$120,000
17
$94,706
1
$110,000
0
$0
0
$0
Aggregated Statistics For Year 2008 (Based on 4 full tracts)
A) FHA, FSA/RHS & VA Home Purchase Loans
B) Conventional Home Purchase Loans
C) Refinancings
D) Home Improvement Loans
E) Loans on Dwellings For 5+ Families
F) Non-occupant Loans on < 5 Family Dwellings (A B C & D)
G) Loans On Manufactured Home Dwelling (A B C & D)
Number
Average Value
Number
Average Value
Number
Average Value
Number
Average Value
Number
Average Value
Number
Average Value
Number
Average Value
LOANS ORIGINATED
87
$102,690
111
$92,514
88
$87,193
49
$17,490
1
$625,000
25
$71,480
0
$0
APPLICATIONS APPROVED, NOT ACCEPTED
5
$102,200
6
$73,167
23
$87,783
6
$30,000
0
$0
4
$69,500
0
$0
APPLICATIONS DENIED
10
$103,300
23
$79,391
86
$98,093
55
$24,727
0
$0
9
$59,444
2
$54,500
APPLICATIONS WITHDRAWN
2
$79,500
4
$64,000
54
$97,185
8
$54,375
0
$0
9
$63,667
0
$0
FILES CLOSED FOR INCOMPLETENESS
1
$142,000
5
$104,200
17
$88,765
0
$0
0
$0
1
$75,000
0
$0
Aggregated Statistics For Year 2007 (Based on 4 full tracts)
A) FHA, FSA/RHS & VA Home Purchase Loans
B) Conventional Home Purchase Loans
C) Refinancings
D) Home Improvement Loans
E) Loans on Dwellings For 5+ Families
F) Non-occupant Loans on < 5 Family Dwellings (A B C & D)
G) Loans On Manufactured Home Dwelling (A B C & D)
Number
Average Value
Number
Average Value
Number
Average Value
Number
Average Value
Number
Average Value
Number
Average Value
Number
Average Value
LOANS ORIGINATED
60
$100,683
185
$83,714
141
$76,624
59
$20,034
3
$156,667
32
$75,094
1
$87,000
APPLICATIONS APPROVED, NOT ACCEPTED
1
$68,000
8
$65,750
28
$68,143
11
$17,182
0
$0
5
$66,800
1
$95,000
APPLICATIONS DENIED
6
$76,500
19
$77,368
118
$88,873
54
$22,593
1
$79,000
8
$66,875
2
$54,000
APPLICATIONS WITHDRAWN
1
$104,000
14
$82,714
68
$80,500
4
$64,000
1
$1,000,000
5
$77,400
0
$0
FILES CLOSED FOR INCOMPLETENESS
0
$0
1
$113,000
16
$85,312
1
$10,000
0
$0
3
$76,667
0
$0
Aggregated Statistics For Year 2006 (Based on 4 full tracts)
A) FHA, FSA/RHS & VA Home Purchase Loans
B) Conventional Home Purchase Loans
C) Refinancings
D) Home Improvement Loans
E) Loans on Dwellings For 5+ Families
F) Non-occupant Loans on < 5 Family Dwellings (A B C & D)
G) Loans On Manufactured Home Dwelling (A B C & D)
Number
Average Value
Number
Average Value
Number
Average Value
Number
Average Value
Number
Average Value
Number
Average Value
Number
Average Value
LOANS ORIGINATED
65
$100,354
202
$75,649
142
$80,620
71
$27,085
2
$241,500
41
$71,415
0
$0
APPLICATIONS APPROVED, NOT ACCEPTED
2
$101,500
26
$63,808
24
$72,958
9
$20,333
0
$0
8
$81,250
1
$21,000
APPLICATIONS DENIED
2
$107,000
23
$81,391
145
$78,979
86
$23,500
0
$0
16
$53,125
2
$38,000
APPLICATIONS WITHDRAWN
2
$94,500
11
$74,182
98
$71,908
6
$55,833
0
$0
4
$71,250
0
$0
FILES CLOSED FOR INCOMPLETENESS
1
$79,000
9
$90,444
21
$81,810
1
$59,000
0
$0
2
$75,000
0
$0
Aggregated Statistics For Year 2005 (Based on 4 full tracts)
A) FHA, FSA/RHS & VA Home Purchase Loans
B) Conventional Home Purchase Loans
C) Refinancings
D) Home Improvement Loans
E) Loans on Dwellings For 5+ Families
F) Non-occupant Loans on < 5 Family Dwellings (A B C & D)
G) Loans On Manufactured Home Dwelling (A B C & D)
Number
Average Value
Number
Average Value
Number
Average Value
Number
Average Value
Number
Average Value
Number
Average Value
Number
Average Value
LOANS ORIGINATED
58
$90,948
231
$75,926
176
$71,216
49
$25,612
3
$362,000
55
$67,655
0
$0
APPLICATIONS APPROVED, NOT ACCEPTED
1
$120,000
13
$75,769
22
$83,045
11
$14,364
0
$0
2
$67,500
0
$0
APPLICATIONS DENIED
3
$92,667
27
$55,741
155
$82,226
79
$24,392
0
$0
24
$36,208
1
$20,000
APPLICATIONS WITHDRAWN
2
$115,000
11
$82,818
95
$87,779
14
$122,857
0
$0
4
$80,750
0
$0
FILES CLOSED FOR INCOMPLETENESS
0
$0
7
$68,857
31
$79,774
3
$62,000
0
$0
0
$0
0
$0
Aggregated Statistics For Year 2004 (Based on 4 full tracts)
A) FHA, FSA/RHS & VA Home Purchase Loans
B) Conventional Home Purchase Loans
C) Refinancings
D) Home Improvement Loans
E) Loans on Dwellings For 5+ Families
F) Non-occupant Loans on < 5 Family Dwellings (A B C & D)
G) Loans On Manufactured Home Dwelling (A B C & D)
Number
Average Value
Number
Average Value
Number
Average Value
Number
Average Value
Number
Average Value
Number
Average Value
Number
Average Value
LOANS ORIGINATED
53
$92,604
232
$75,172
191
$72,094
36
$36,222
3
$1,435,333
46
$64,826
0
$0
APPLICATIONS APPROVED, NOT ACCEPTED
4
$69,750
17
$77,412
32
$72,688
8
$29,500
0
$0
3
$59,667
1
$90,000
APPLICATIONS DENIED
3
$90,667
16
$75,188
139
$78,647
50
$20,720
1
$450,000
3
$71,333
0
$0
APPLICATIONS WITHDRAWN
3
$65,000
17
$75,412
91
$75,319
9
$44,444
1
$255,000
4
$60,500
1
$65,000
FILES CLOSED FOR INCOMPLETENESS
1
$118,000
17
$65,588
39
$80,641
5
$32,600
0
$0
5
$61,200
0
$0
Aggregated Statistics For Year 2003 (Based on 4 full tracts)
A) FHA, FSA/RHS & VA Home Purchase Loans
B) Conventional Home Purchase Loans
C) Refinancings
D) Home Improvement Loans
E) Loans on Dwellings For 5+ Families
F) Non-occupant Loans on < 5 Family Dwellings (A B C & D)
Number
Average Value
Number
Average Value
Number
Average Value
Number
Average Value
Number
Average Value
Number
Average Value
LOANS ORIGINATED
69
$81,855
193
$71,104
418
$70,347
15
$13,067
2
$185,000
40
$61,850
APPLICATIONS APPROVED, NOT ACCEPTED
4
$60,750
11
$69,455
72
$68,486
9
$22,556
0
$0
3
$80,333
APPLICATIONS DENIED
7
$69,000
13
$62,538
182
$72,549
34
$16,000
0
$0
10
$53,500
APPLICATIONS WITHDRAWN
5
$66,800
6
$75,333
94
$70,957
4
$35,250
0
$0
3
$77,333
FILES CLOSED FOR INCOMPLETENESS
0
$0
3
$68,667
21
$73,095
2
$19,500
0
$0
0
$0
Aggregated Statistics For Year 2002 (Based on 4 full tracts)
A) FHA, FSA/RHS & VA Home Purchase Loans
B) Conventional Home Purchase Loans
C) Refinancings
D) Home Improvement Loans
E) Loans on Dwellings For 5+ Families
F) Non-occupant Loans on < 5 Family Dwellings (A B C & D)
Number
Average Value
Number
Average Value
Number
Average Value
Number
Average Value
Number
Average Value
Number
Average Value
LOANS ORIGINATED
83
$77,892
147
$68,068
225
$67,102
44
$10,659
1
$656,000
27
$59,926
APPLICATIONS APPROVED, NOT ACCEPTED
2
$60,500
14
$48,143
50
$75,140
11
$12,273
0
$0
4
$57,500
APPLICATIONS DENIED
4
$78,750
19
$58,789
123
$69,341
42
$14,190
0
$0
2
$58,000
APPLICATIONS WITHDRAWN
3
$81,667
7
$69,000
88
$70,852
9
$27,111
0
$0
4
$69,000
FILES CLOSED FOR INCOMPLETENESS
1
$69,000
1
$58,000
20
$62,950
3
$19,667
0
$0
0
$0
Aggregated Statistics For Year 2001 (Based on 4 full tracts)
A) FHA, FSA/RHS & VA Home Purchase Loans
B) Conventional Home Purchase Loans
C) Refinancings
D) Home Improvement Loans
E) Loans on Dwellings For 5+ Families
F) Non-occupant Loans on < 5 Family Dwellings (A B C & D)
Number
Average Value
Number
Average Value
Number
Average Value
Number
Average Value
Number
Average Value
Number
Average Value
LOANS ORIGINATED
78
$71,603
157
$65,567
214
$66,210
32
$16,781
2
$373,000
25
$55,800
APPLICATIONS APPROVED, NOT ACCEPTED
1
$87,000
10
$63,000
38
$69,158
9
$14,778
0
$0
1
$56,000
APPLICATIONS DENIED
2
$74,500
21
$66,286
151
$67,073
44
$16,523
1
$200,000
4
$78,000
APPLICATIONS WITHDRAWN
7
$57,000
6
$65,833
86
$64,849
10
$22,200
0
$0
3
$38,333
FILES CLOSED FOR INCOMPLETENESS
0
$0
5
$61,200
17
$64,824
2
$6,500
0
$0
1
$42,000
Aggregated Statistics For Year 2000 (Based on 4 full tracts)
A) FHA, FSA/RHS & VA Home Purchase Loans
B) Conventional Home Purchase Loans
C) Refinancings
D) Home Improvement Loans
F) Non-occupant Loans on < 5 Family Dwellings (A B C & D)
Number
Average Value
Number
Average Value
Number
Average Value
Number
Average Value
Number
Average Value
LOANS ORIGINATED
92
$70,522
154
$63,039
66
$52,955
41
$16,244
17
$48,471
APPLICATIONS APPROVED, NOT ACCEPTED
1
$65,000
10
$58,400
23
$77,174
13
$12,769
1
$70,000
APPLICATIONS DENIED
7
$66,429
21
$56,857
91
$55,242
34
$19,588
5
$57,400
APPLICATIONS WITHDRAWN
3
$64,667
5
$52,000
40
$55,500
6
$30,833
1
$48,000
FILES CLOSED FOR INCOMPLETENESS
1
$95,000
3
$54,667
12
$75,167
0
$0
2
$70,000
Aggregated Statistics For Year 1999 (Based on 4 full tracts)
A) FHA, FSA/RHS & VA Home Purchase Loans
B) Conventional Home Purchase Loans
C) Refinancings
D) Home Improvement Loans
E) Loans on Dwellings For 5+ Families
F) Non-occupant Loans on < 5 Family Dwellings (A B C & D)
2002 - 2017 National Fire Incident Reporting System (NFIRS) incidents
Based on the data from the years 2002 - 2017 the average number of fire incidents per year is 54. The highest number of fire incidents - 74 took place in 2004, and the least - 0 in 2015. The data has a declining trend.
When looking into fire subcategories, the most incidents belonged to: Structure Fires (58.9%), and Outside Fires (21.7%).
Fire incident types reported to NFIRS in Kenmore, NY


 Recent articles from our blog. Our writers, many of them Ph.D. graduates or candidates, create easy-to-read articles on a wide variety of topics.


 (4.3 miles
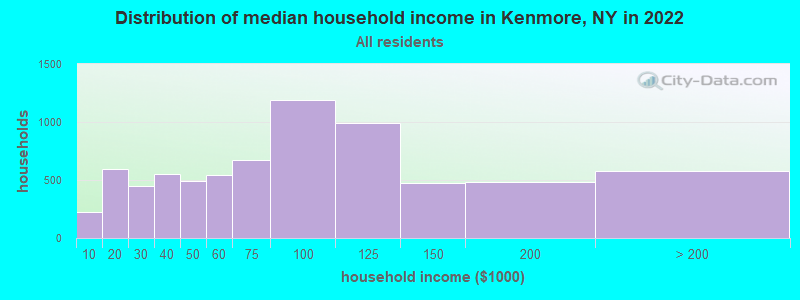


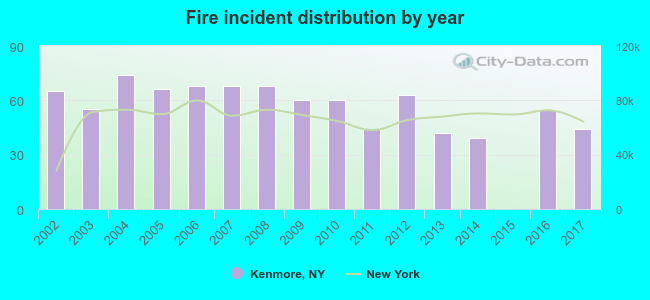 Based on the data from the years 2002 - 2017 the average number of fire incidents per year is 54. The highest number of fire incidents - 74 took place in 2004, and the least - 0 in 2015. The data has a declining trend.
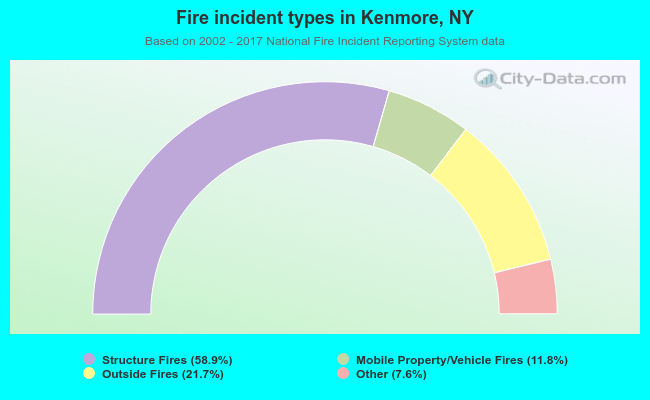 When looking into fire subcategories, the most incidents belonged to: Structure Fires (58.9%), and Outside Fires (21.7%).