Neenah, Wisconsin Submit your own pictures of this city and show them to the world
OSM Map
General Map
Google Map
MSN Map
OSM Map
General Map
Google Map
MSN Map
OSM Map
General Map
Google Map
MSN Map
OSM Map
General Map
Google Map
MSN Map
Please wait while loading the map...
Population in 2022: 27,361 (100% urban, 0% rural). Population change since 2000: +11.6%Males: 13,877 Females: 13,484
March 2022 cost of living index in Neenah: 90.4 (less than average, U.S. average is 100) Percentage of residents living in poverty in 2022: 10.3%for White Non-Hispanic residents , 32.2% for Black residents , 17.2% for Hispanic or Latino residents , 1.1% for American Indian residents , 21.3% for other race residents , 21.0% for two or more races residents )
Profiles of local businesses
Business Search - 14 Million verified businesses
Data:
Median household income ($)
Median household income (% change since 2000)
Household income diversity
Ratio of average income to average house value (%)
Ratio of average income to average rent
Median household income ($) - White
Median household income ($) - Black or African American
Median household income ($) - Asian
Median household income ($) - Hispanic or Latino
Median household income ($) - American Indian and Alaska Native
Median household income ($) - Multirace
Median household income ($) - Other Race
Median household income for houses/condos with a mortgage ($)
Median household income for apartments without a mortgage ($)
Races - White alone (%)
Races - White alone (% change since 2000)
Races - Black alone (%)
Races - Black alone (% change since 2000)
Races - American Indian alone (%)
Races - American Indian alone (% change since 2000)
Races - Asian alone (%)
Races - Asian alone (% change since 2000)
Races - Hispanic (%)
Races - Hispanic (% change since 2000)
Races - Native Hawaiian and Other Pacific Islander alone (%)
Races - Native Hawaiian and Other Pacific Islander alone (% change since 2000)
Races - Two or more races (%)
Races - Two or more races (% change since 2000)
Races - Other race alone (%)
Races - Other race alone (% change since 2000)
Racial diversity
Unemployment (%)
Unemployment (% change since 2000)
Unemployment (%) - White
Unemployment (%) - Black or African American
Unemployment (%) - Asian
Unemployment (%) - Hispanic or Latino
Unemployment (%) - American Indian and Alaska Native
Unemployment (%) - Multirace
Unemployment (%) - Other Race
Population density (people per square mile)
Population - Males (%)
Population - Females (%)
Population - Males (%) - White
Population - Males (%) - Black or African American
Population - Males (%) - Asian
Population - Males (%) - Hispanic or Latino
Population - Males (%) - American Indian and Alaska Native
Population - Males (%) - Multirace
Population - Males (%) - Other Race
Population - Females (%) - White
Population - Females (%) - Black or African American
Population - Females (%) - Asian
Population - Females (%) - Hispanic or Latino
Population - Females (%) - American Indian and Alaska Native
Population - Females (%) - Multirace
Population - Females (%) - Other Race
Coronavirus confirmed cases (Jun 07, 2024)
Deaths caused by coronavirus (Jun 07, 2024)
Coronavirus confirmed cases (per 100k population) (Jun 07, 2024)
Deaths caused by coronavirus (per 100k population) (Jun 07, 2024)
Daily increase in number of cases (Jun 07, 2024)
Weekly increase in number of cases (Jun 07, 2024)
Cases doubled (in days) (Jun 07, 2024)
Hospitalized patients (Apr 18, 2022)
Negative test results (Apr 18, 2022)
Total test results (Apr 18, 2022)
COVID Vaccine doses distributed (per 100k population) (Sep 19, 2023)
COVID Vaccine doses administered (per 100k population) (Sep 19, 2023)
COVID Vaccine doses distributed (Sep 19, 2023)
COVID Vaccine doses administered (Sep 19, 2023)
Likely homosexual households (%)
Likely homosexual households (% change since 2000)
Likely homosexual households - Lesbian couples (%)
Likely homosexual households - Lesbian couples (% change since 2000)
Likely homosexual households - Gay men (%)
Likely homosexual households - Gay men (% change since 2000)
Cost of living index
Median gross rent ($)
Median contract rent ($)
Median monthly housing costs ($)
Median house or condo value ($)
Median house or condo value ($ change since 2000)
Mean house or condo value by units in structure - 1, detached ($)
Mean house or condo value by units in structure - 1, attached ($)
Mean house or condo value by units in structure - 2 ($)
Mean house or condo value by units in structure by units in structure - 3 or 4 ($)
Mean house or condo value by units in structure - 5 or more ($)
Mean house or condo value by units in structure - Boat, RV, van, etc. ($)
Mean house or condo value by units in structure - Mobile home ($)
Median house or condo value ($) - White
Median house or condo value ($) - Black or African American
Median house or condo value ($) - Asian
Median house or condo value ($) - Hispanic or Latino
Median house or condo value ($) - American Indian and Alaska Native
Median house or condo value ($) - Multirace
Median house or condo value ($) - Other Race
Median resident age
Resident age diversity
Median resident age - Males
Median resident age - Females
Median resident age - White
Median resident age - Black or African American
Median resident age - Asian
Median resident age - Hispanic or Latino
Median resident age - American Indian and Alaska Native
Median resident age - Multirace
Median resident age - Other Race
Median resident age - Males - White
Median resident age - Males - Black or African American
Median resident age - Males - Asian
Median resident age - Males - Hispanic or Latino
Median resident age - Males - American Indian and Alaska Native
Median resident age - Males - Multirace
Median resident age - Males - Other Race
Median resident age - Females - White
Median resident age - Females - Black or African American
Median resident age - Females - Asian
Median resident age - Females - Hispanic or Latino
Median resident age - Females - American Indian and Alaska Native
Median resident age - Females - Multirace
Median resident age - Females - Other Race
Commute - mean travel time to work (minutes)
Travel time to work - Less than 5 minutes (%)
Travel time to work - Less than 5 minutes (% change since 2000)
Travel time to work - 5 to 9 minutes (%)
Travel time to work - 5 to 9 minutes (% change since 2000)
Travel time to work - 10 to 19 minutes (%)
Travel time to work - 10 to 19 minutes (% change since 2000)
Travel time to work - 20 to 29 minutes (%)
Travel time to work - 20 to 29 minutes (% change since 2000)
Travel time to work - 30 to 39 minutes (%)
Travel time to work - 30 to 39 minutes (% change since 2000)
Travel time to work - 40 to 59 minutes (%)
Travel time to work - 40 to 59 minutes (% change since 2000)
Travel time to work - 60 to 89 minutes (%)
Travel time to work - 60 to 89 minutes (% change since 2000)
Travel time to work - 90 or more minutes (%)
Travel time to work - 90 or more minutes (% change since 2000)
Marital status - Never married (%)
Marital status - Now married (%)
Marital status - Separated (%)
Marital status - Widowed (%)
Marital status - Divorced (%)
Median family income ($)
Median family income (% change since 2000)
Median non-family income ($)
Median non-family income (% change since 2000)
Median per capita income ($)
Median per capita income (% change since 2000)
Median family income ($) - White
Median family income ($) - Black or African American
Median family income ($) - Asian
Median family income ($) - Hispanic or Latino
Median family income ($) - American Indian and Alaska Native
Median family income ($) - Multirace
Median family income ($) - Other Race
Median year house/condo built
Median year apartment built
Year house built - Built 2005 or later (%)
Year house built - Built 2000 to 2004 (%)
Year house built - Built 1990 to 1999 (%)
Year house built - Built 1980 to 1989 (%)
Year house built - Built 1970 to 1979 (%)
Year house built - Built 1960 to 1969 (%)
Year house built - Built 1950 to 1959 (%)
Year house built - Built 1940 to 1949 (%)
Year house built - Built 1939 or earlier (%)
Average household size
Household density (households per square mile)
Average household size - White
Average household size - Black or African American
Average household size - Asian
Average household size - Hispanic or Latino
Average household size - American Indian and Alaska Native
Average household size - Multirace
Average household size - Other Race
Occupied housing units (%)
Vacant housing units (%)
Owner occupied housing units (%)
Renter occupied housing units (%)
Vacancy status - For rent (%)
Vacancy status - For sale only (%)
Vacancy status - Rented or sold, not occupied (%)
Vacancy status - For seasonal, recreational, or occasional use (%)
Vacancy status - For migrant workers (%)
Vacancy status - Other vacant (%)
Residents with income below the poverty level (%)
Residents with income below 50% of the poverty level (%)
Children below poverty level (%)
Poor families by family type - Married-couple family (%)
Poor families by family type - Male, no wife present (%)
Poor families by family type - Female, no husband present (%)
Poverty status for native-born residents (%)
Poverty status for foreign-born residents (%)
Poverty among high school graduates not in families (%)
Poverty among people who did not graduate high school not in families (%)
Residents with income below the poverty level (%) - White
Residents with income below the poverty level (%) - Black or African American
Residents with income below the poverty level (%) - Asian
Residents with income below the poverty level (%) - Hispanic or Latino
Residents with income below the poverty level (%) - American Indian and Alaska Native
Residents with income below the poverty level (%) - Multirace
Residents with income below the poverty level (%) - Other Race
Air pollution - Air Quality Index (AQI)
Air pollution - CO
Air pollution - NO2
Air pollution - SO2
Air pollution - Ozone
Air pollution - PM10
Air pollution - PM25
Air pollution - Pb
Crime - Murders per 100,000 population
Crime - Rapes per 100,000 population
Crime - Robberies per 100,000 population
Crime - Assaults per 100,000 population
Crime - Burglaries per 100,000 population
Crime - Thefts per 100,000 population
Crime - Auto thefts per 100,000 population
Crime - Arson per 100,000 population
Crime - City-data.com crime index
Crime - Violent crime index
Crime - Property crime index
Crime - Murders per 100,000 population (5 year average)
Crime - Rapes per 100,000 population (5 year average)
Crime - Robberies per 100,000 population (5 year average)
Crime - Assaults per 100,000 population (5 year average)
Crime - Burglaries per 100,000 population (5 year average)
Crime - Thefts per 100,000 population (5 year average)
Crime - Auto thefts per 100,000 population (5 year average)
Crime - Arson per 100,000 population (5 year average)
Crime - City-data.com crime index (5 year average)
Crime - Violent crime index (5 year average)
Crime - Property crime index (5 year average)
1996 Presidential Elections Results (%) - Democratic Party (Clinton)
1996 Presidential Elections Results (%) - Republican Party (Dole)
1996 Presidential Elections Results (%) - Other
2000 Presidential Elections Results (%) - Democratic Party (Gore)
2000 Presidential Elections Results (%) - Republican Party (Bush)
2000 Presidential Elections Results (%) - Other
2004 Presidential Elections Results (%) - Democratic Party (Kerry)
2004 Presidential Elections Results (%) - Republican Party (Bush)
2004 Presidential Elections Results (%) - Other
2008 Presidential Elections Results (%) - Democratic Party (Obama)
2008 Presidential Elections Results (%) - Republican Party (McCain)
2008 Presidential Elections Results (%) - Other
2012 Presidential Elections Results (%) - Democratic Party (Obama)
2012 Presidential Elections Results (%) - Republican Party (Romney)
2012 Presidential Elections Results (%) - Other
2016 Presidential Elections Results (%) - Democratic Party (Clinton)
2016 Presidential Elections Results (%) - Republican Party (Trump)
2016 Presidential Elections Results (%) - Other
2020 Presidential Elections Results (%) - Democratic Party (Biden)
2020 Presidential Elections Results (%) - Republican Party (Trump)
2020 Presidential Elections Results (%) - Other
Ancestries Reported - Arab (%)
Ancestries Reported - Czech (%)
Ancestries Reported - Danish (%)
Ancestries Reported - Dutch (%)
Ancestries Reported - English (%)
Ancestries Reported - French (%)
Ancestries Reported - French Canadian (%)
Ancestries Reported - German (%)
Ancestries Reported - Greek (%)
Ancestries Reported - Hungarian (%)
Ancestries Reported - Irish (%)
Ancestries Reported - Italian (%)
Ancestries Reported - Lithuanian (%)
Ancestries Reported - Norwegian (%)
Ancestries Reported - Polish (%)
Ancestries Reported - Portuguese (%)
Ancestries Reported - Russian (%)
Ancestries Reported - Scotch-Irish (%)
Ancestries Reported - Scottish (%)
Ancestries Reported - Slovak (%)
Ancestries Reported - Subsaharan African (%)
Ancestries Reported - Swedish (%)
Ancestries Reported - Swiss (%)
Ancestries Reported - Ukrainian (%)
Ancestries Reported - United States (%)
Ancestries Reported - Welsh (%)
Ancestries Reported - West Indian (%)
Ancestries Reported - Other (%)
Educational Attainment - No schooling completed (%)
Educational Attainment - Less than high school (%)
Educational Attainment - High school or equivalent (%)
Educational Attainment - Less than 1 year of college (%)
Educational Attainment - 1 or more years of college (%)
Educational Attainment - Associate degree (%)
Educational Attainment - Bachelor's degree (%)
Educational Attainment - Master's degree (%)
Educational Attainment - Professional school degree (%)
Educational Attainment - Doctorate degree (%)
School Enrollment - Nursery, preschool (%)
School Enrollment - Kindergarten (%)
School Enrollment - Grade 1 to 4 (%)
School Enrollment - Grade 5 to 8 (%)
School Enrollment - Grade 9 to 12 (%)
School Enrollment - College undergrad (%)
School Enrollment - Graduate or professional (%)
School Enrollment - Not enrolled in school (%)
School enrollment - Public schools (%)
School enrollment - Private schools (%)
School enrollment - Not enrolled (%)
Median number of rooms in houses and condos
Median number of rooms in apartments
Housing units lacking complete plumbing facilities (%)
Housing units lacking complete kitchen facilities (%)
Density of houses
Urban houses (%)
Rural houses (%)
Households with people 60 years and over (%)
Households with people 65 years and over (%)
Households with people 75 years and over (%)
Households with one or more nonrelatives (%)
Households with no nonrelatives (%)
Population in households (%)
Family households (%)
Nonfamily households (%)
Population in families (%)
Family households with own children (%)
Median number of bedrooms in owner occupied houses
Mean number of bedrooms in owner occupied houses
Median number of bedrooms in renter occupied houses
Mean number of bedrooms in renter occupied houses
Median number of vehichles in owner occupied houses
Mean number of vehichles in owner occupied houses
Median number of vehichles in renter occupied houses
Mean number of vehichles in renter occupied houses
Mortgage status - with mortgage (%)
Mortgage status - with second mortgage (%)
Mortgage status - with home equity loan (%)
Mortgage status - with both second mortgage and home equity loan (%)
Mortgage status - without a mortgage (%)
Average family size
Average family size - White
Average family size - Black or African American
Average family size - Asian
Average family size - Hispanic or Latino
Average family size - American Indian and Alaska Native
Average family size - Multirace
Average family size - Other Race
Geographical mobility - Same house 1 year ago (%)
Geographical mobility - Moved within same county (%)
Geographical mobility - Moved from different county within same state (%)
Geographical mobility - Moved from different state (%)
Geographical mobility - Moved from abroad (%)
Place of birth - Born in state of residence (%)
Place of birth - Born in other state (%)
Place of birth - Native, outside of US (%)
Place of birth - Foreign born (%)
Housing units in structures - 1, detached (%)
Housing units in structures - 1, attached (%)
Housing units in structures - 2 (%)
Housing units in structures - 3 or 4 (%)
Housing units in structures - 5 to 9 (%)
Housing units in structures - 10 to 19 (%)
Housing units in structures - 20 to 49 (%)
Housing units in structures - 50 or more (%)
Housing units in structures - Mobile home (%)
Housing units in structures - Boat, RV, van, etc. (%)
House/condo owner moved in on average (years ago)
Renter moved in on average (years ago)
Year householder moved into unit - Moved in 1999 to March 2000 (%)
Year householder moved into unit - Moved in 1995 to 1998 (%)
Year householder moved into unit - Moved in 1990 to 1994 (%)
Year householder moved into unit - Moved in 1980 to 1989 (%)
Year householder moved into unit - Moved in 1970 to 1979 (%)
Year householder moved into unit - Moved in 1969 or earlier (%)
Means of transportation to work - Drove car alone (%)
Means of transportation to work - Carpooled (%)
Means of transportation to work - Public transportation (%)
Means of transportation to work - Bus or trolley bus (%)
Means of transportation to work - Streetcar or trolley car (%)
Means of transportation to work - Subway or elevated (%)
Means of transportation to work - Railroad (%)
Means of transportation to work - Ferryboat (%)
Means of transportation to work - Taxicab (%)
Means of transportation to work - Motorcycle (%)
Means of transportation to work - Bicycle (%)
Means of transportation to work - Walked (%)
Means of transportation to work - Other means (%)
Working at home (%)
Industry diversity
Most Common Industries - Agriculture, forestry, fishing and hunting, and mining (%)
Most Common Industries - Agriculture, forestry, fishing and hunting (%)
Most Common Industries - Mining, quarrying, and oil and gas extraction (%)
Most Common Industries - Construction (%)
Most Common Industries - Manufacturing (%)
Most Common Industries - Wholesale trade (%)
Most Common Industries - Retail trade (%)
Most Common Industries - Transportation and warehousing, and utilities (%)
Most Common Industries - Transportation and warehousing (%)
Most Common Industries - Utilities (%)
Most Common Industries - Information (%)
Most Common Industries - Finance and insurance, and real estate and rental and leasing (%)
Most Common Industries - Finance and insurance (%)
Most Common Industries - Real estate and rental and leasing (%)
Most Common Industries - Professional, scientific, and management, and administrative and waste management services (%)
Most Common Industries - Professional, scientific, and technical services (%)
Most Common Industries - Management of companies and enterprises (%)
Most Common Industries - Administrative and support and waste management services (%)
Most Common Industries - Educational services, and health care and social assistance (%)
Most Common Industries - Educational services (%)
Most Common Industries - Health care and social assistance (%)
Most Common Industries - Arts, entertainment, and recreation, and accommodation and food services (%)
Most Common Industries - Arts, entertainment, and recreation (%)
Most Common Industries - Accommodation and food services (%)
Most Common Industries - Other services, except public administration (%)
Most Common Industries - Public administration (%)
Occupation diversity
Most Common Occupations - Management, business, science, and arts occupations (%)
Most Common Occupations - Management, business, and financial occupations (%)
Most Common Occupations - Management occupations (%)
Most Common Occupations - Business and financial operations occupations (%)
Most Common Occupations - Computer, engineering, and science occupations (%)
Most Common Occupations - Computer and mathematical occupations (%)
Most Common Occupations - Architecture and engineering occupations (%)
Most Common Occupations - Life, physical, and social science occupations (%)
Most Common Occupations - Education, legal, community service, arts, and media occupations (%)
Most Common Occupations - Community and social service occupations (%)
Most Common Occupations - Legal occupations (%)
Most Common Occupations - Education, training, and library occupations (%)
Most Common Occupations - Arts, design, entertainment, sports, and media occupations (%)
Most Common Occupations - Healthcare practitioners and technical occupations (%)
Most Common Occupations - Health diagnosing and treating practitioners and other technical occupations (%)
Most Common Occupations - Health technologists and technicians (%)
Most Common Occupations - Service occupations (%)
Most Common Occupations - Healthcare support occupations (%)
Most Common Occupations - Protective service occupations (%)
Most Common Occupations - Fire fighting and prevention, and other protective service workers including supervisors (%)
Most Common Occupations - Law enforcement workers including supervisors (%)
Most Common Occupations - Food preparation and serving related occupations (%)
Most Common Occupations - Building and grounds cleaning and maintenance occupations (%)
Most Common Occupations - Personal care and service occupations (%)
Most Common Occupations - Sales and office occupations (%)
Most Common Occupations - Sales and related occupations (%)
Most Common Occupations - Office and administrative support occupations (%)
Most Common Occupations - Natural resources, construction, and maintenance occupations (%)
Most Common Occupations - Farming, fishing, and forestry occupations (%)
Most Common Occupations - Construction and extraction occupations (%)
Most Common Occupations - Installation, maintenance, and repair occupations (%)
Most Common Occupations - Production, transportation, and material moving occupations (%)
Most Common Occupations - Production occupations (%)
Most Common Occupations - Transportation occupations (%)
Most Common Occupations - Material moving occupations (%)
People in Group quarters - Institutionalized population (%)
People in Group quarters - Correctional institutions (%)
People in Group quarters - Federal prisons and detention centers (%)
People in Group quarters - Halfway houses (%)
People in Group quarters - Local jails and other confinement facilities (including police lockups) (%)
People in Group quarters - Military disciplinary barracks (%)
People in Group quarters - State prisons (%)
People in Group quarters - Other types of correctional institutions (%)
People in Group quarters - Nursing homes (%)
People in Group quarters - Hospitals/wards, hospices, and schools for the handicapped (%)
People in Group quarters - Hospitals/wards and hospices for chronically ill (%)
People in Group quarters - Hospices or homes for chronically ill (%)
People in Group quarters - Military hospitals or wards for chronically ill (%)
People in Group quarters - Other hospitals or wards for chronically ill (%)
People in Group quarters - Hospitals or wards for drug/alcohol abuse (%)
People in Group quarters - Mental (Psychiatric) hospitals or wards (%)
People in Group quarters - Schools, hospitals, or wards for the mentally retarded (%)
People in Group quarters - Schools, hospitals, or wards for the physically handicapped (%)
People in Group quarters - Institutions for the deaf (%)
People in Group quarters - Institutions for the blind (%)
People in Group quarters - Orthopedic wards and institutions for the physically handicapped (%)
People in Group quarters - Wards in general hospitals for patients who have no usual home elsewhere (%)
People in Group quarters - Wards in military hospitals for patients who have no usual home elsewhere (%)
People in Group quarters - Juvenile institutions (%)
People in Group quarters - Long-term care (%)
People in Group quarters - Homes for abused, dependent, and neglected children (%)
People in Group quarters - Residential treatment centers for emotionally disturbed children (%)
People in Group quarters - Training schools for juvenile delinquents (%)
People in Group quarters - Short-term care, detention or diagnostic centers for delinquent children (%)
People in Group quarters - Type of juvenile institution unknown (%)
People in Group quarters - Noninstitutionalized population (%)
People in Group quarters - College dormitories (includes college quarters off campus) (%)
People in Group quarters - Military quarters (%)
People in Group quarters - On base (%)
People in Group quarters - Barracks, unaccompanied personnel housing (UPH), (Enlisted/Officer), ;and similar group living quarters for military personnel (%)
People in Group quarters - Transient quarters for temporary residents (%)
People in Group quarters - Military ships (%)
People in Group quarters - Group homes (%)
People in Group quarters - Homes or halfway houses for drug/alcohol abuse (%)
People in Group quarters - Homes for the mentally ill (%)
People in Group quarters - Homes for the mentally retarded (%)
People in Group quarters - Homes for the physically handicapped (%)
People in Group quarters - Other group homes (%)
People in Group quarters - Religious group quarters (%)
People in Group quarters - Dormitories (%)
People in Group quarters - Agriculture workers' dormitories on farms (%)
People in Group quarters - Job Corps and vocational training facilities (%)
People in Group quarters - Other workers' dormitories (%)
People in Group quarters - Crews of maritime vessels (%)
People in Group quarters - Other nonhousehold living situations (%)
People in Group quarters - Other noninstitutional group quarters (%)
Residents speaking English at home (%)
Residents speaking English at home - Born in the United States (%)
Residents speaking English at home - Native, born elsewhere (%)
Residents speaking English at home - Foreign born (%)
Residents speaking Spanish at home (%)
Residents speaking Spanish at home - Born in the United States (%)
Residents speaking Spanish at home - Native, born elsewhere (%)
Residents speaking Spanish at home - Foreign born (%)
Residents speaking other language at home (%)
Residents speaking other language at home - Born in the United States (%)
Residents speaking other language at home - Native, born elsewhere (%)
Residents speaking other language at home - Foreign born (%)
Class of Workers - Employee of private company (%)
Class of Workers - Self-employed in own incorporated business (%)
Class of Workers - Private not-for-profit wage and salary workers (%)
Class of Workers - Local government workers (%)
Class of Workers - State government workers (%)
Class of Workers - Federal government workers (%)
Class of Workers - Self-employed workers in own not incorporated business and Unpaid family workers (%)
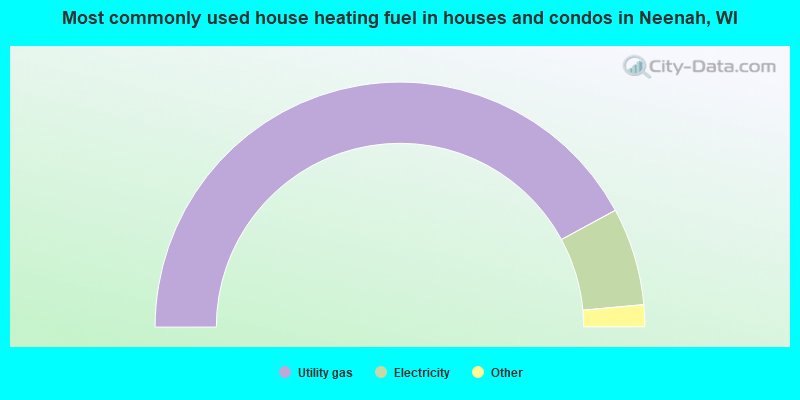
House heating fuel used in houses and condos - Utility gas (%)
House heating fuel used in houses and condos - Bottled, tank, or LP gas (%)
House heating fuel used in houses and condos - Electricity (%)
House heating fuel used in houses and condos - Fuel oil, kerosene, etc. (%)
House heating fuel used in houses and condos - Coal or coke (%)
House heating fuel used in houses and condos - Wood (%)
House heating fuel used in houses and condos - Solar energy (%)
House heating fuel used in houses and condos - Other fuel (%)
House heating fuel used in houses and condos - No fuel used (%)
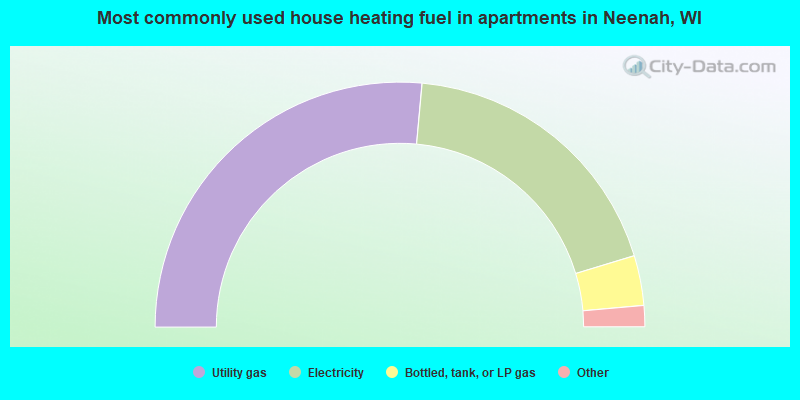
House heating fuel used in apartments - Utility gas (%)
House heating fuel used in apartments - Bottled, tank, or LP gas (%)
House heating fuel used in apartments - Electricity (%)
House heating fuel used in apartments - Fuel oil, kerosene, etc. (%)
House heating fuel used in apartments - Coal or coke (%)
House heating fuel used in apartments - Wood (%)
House heating fuel used in apartments - Solar energy (%)
House heating fuel used in apartments - Other fuel (%)
House heating fuel used in apartments - No fuel used (%)
Armed forces status - In Armed Forces (%)
Armed forces status - Civilian (%)
Armed forces status - Civilian - Veteran (%)
Armed forces status - Civilian - Nonveteran (%)
Fatal accidents locations in years 2005-2021
Fatal accidents locations in 2005
Fatal accidents locations in 2006
Fatal accidents locations in 2007
Fatal accidents locations in 2008
Fatal accidents locations in 2009
Fatal accidents locations in 2010
Fatal accidents locations in 2011
Fatal accidents locations in 2012
Fatal accidents locations in 2013
Fatal accidents locations in 2014
Fatal accidents locations in 2015
Fatal accidents locations in 2016
Fatal accidents locations in 2017
Fatal accidents locations in 2018
Fatal accidents locations in 2019
Fatal accidents locations in 2020
Fatal accidents locations in 2021
Alcohol use - People drinking some alcohol every month (%)
Alcohol use - People not drinking at all (%)
Alcohol use - Average days/month drinking alcohol
Alcohol use - Average drinks/week
Alcohol use - Average days/year people drink much
Audiometry - Average condition of hearing (%)
Audiometry - People that can hear a whisper from across a quiet room (%)
Audiometry - People that can hear normal voice from across a quiet room (%)
Audiometry - Ears ringing, roaring, buzzing (%)
Audiometry - Had a job exposure to loud noise (%)
Audiometry - Had off-work exposure to loud noise (%)
Blood Pressure & Cholesterol - Has high blood pressure (%)
Blood Pressure & Cholesterol - Checking blood pressure at home (%)
Blood Pressure & Cholesterol - Frequently checking blood cholesterol (%)
Blood Pressure & Cholesterol - Has high cholesterol level (%)
Consumer Behavior - Money monthly spent on food at supermarket/grocery store
Consumer Behavior - Money monthly spent on food at other stores
Consumer Behavior - Money monthly spent on eating out
Consumer Behavior - Money monthly spent on carryout/delivered foods
Consumer Behavior - Income spent on food at supermarket/grocery store (%)
Consumer Behavior - Income spent on food at other stores (%)
Consumer Behavior - Income spent on eating out (%)
Consumer Behavior - Income spent on carryout/delivered foods (%)
Current Health Status - General health condition (%)
Current Health Status - Blood donors (%)
Current Health Status - Has blood ever tested for HIV virus (%)
Current Health Status - Left-handed people (%)
Dermatology - People using sunscreen (%)
Diabetes - Diabetics (%)
Diabetes - Had a blood test for high blood sugar (%)
Diabetes - People taking insulin (%)
Diet Behavior & Nutrition - Diet health (%)
Diet Behavior & Nutrition - Milk product consumption (# of products/month)
Diet Behavior & Nutrition - Meals not home prepared (#/week)
Diet Behavior & Nutrition - Meals from fast food or pizza place (#/week)
Diet Behavior & Nutrition - Ready-to-eat foods (#/month)
Diet Behavior & Nutrition - Frozen meals/pizza (#/month)
Drug Use - People that ever used marijuana or hashish (%)
Drug Use - Ever used hard drugs (%)
Drug Use - Ever used any form of cocaine (%)
Drug Use - Ever used heroin (%)
Drug Use - Ever used methamphetamine (%)
Health Insurance - People covered by health insurance (%)
Kidney Conditions-Urology - Avg. # of times urinating at night
Medical Conditions - People with asthma (%)
Medical Conditions - People with anemia (%)
Medical Conditions - People with psoriasis (%)
Medical Conditions - People with overweight (%)
Medical Conditions - Elderly people having difficulties in thinking or remembering (%)
Medical Conditions - People who ever received blood transfusion (%)
Medical Conditions - People having trouble seeing even with glass/contacts (%)
Medical Conditions - People with arthritis (%)
Medical Conditions - People with gout (%)
Medical Conditions - People with congestive heart failure (%)
Medical Conditions - People with coronary heart disease (%)
Medical Conditions - People with angina pectoris (%)
Medical Conditions - People who ever had heart attack (%)
Medical Conditions - People who ever had stroke (%)
Medical Conditions - People with emphysema (%)
Medical Conditions - People with thyroid problem (%)
Medical Conditions - People with chronic bronchitis (%)
Medical Conditions - People with any liver condition (%)
Medical Conditions - People who ever had cancer or malignancy (%)
Mental Health - People who have little interest in doing things (%)
Mental Health - People feeling down, depressed, or hopeless (%)
Mental Health - People who have trouble sleeping or sleeping too much (%)
Mental Health - People feeling tired or having little energy (%)
Mental Health - People with poor appetite or overeating (%)
Mental Health - People feeling bad about themself (%)
Mental Health - People who have trouble concentrating on things (%)
Mental Health - People moving or speaking slowly or too fast (%)
Mental Health - People having thoughts they would be better off dead (%)
Oral Health - Average years since last visit a dentist
Oral Health - People embarrassed because of mouth (%)
Oral Health - People with gum disease (%)
Oral Health - General health of teeth and gums (%)
Oral Health - Average days a week using dental floss/device
Oral Health - Average days a week using mouthwash for dental problem
Oral Health - Average number of teeth
Pesticide Use - Households using pesticides to control insects (%)
Pesticide Use - Households using pesticides to kill weeds (%)
Physical Activity - People doing vigorous-intensity work activities (%)
Physical Activity - People doing moderate-intensity work activities (%)
Physical Activity - People walking or bicycling (%)
Physical Activity - People doing vigorous-intensity recreational activities (%)
Physical Activity - People doing moderate-intensity recreational activities (%)
Physical Activity - Average hours a day doing sedentary activities
Physical Activity - Average hours a day watching TV or videos
Physical Activity - Average hours a day using computer
Physical Functioning - People having limitations keeping them from working (%)
Physical Functioning - People limited in amount of work they can do (%)
Physical Functioning - People that need special equipment to walk (%)
Physical Functioning - People experiencing confusion/memory problems (%)
Physical Functioning - People requiring special healthcare equipment (%)
Prescription Medications - Average number of prescription medicines taking
Preventive Aspirin Use - Adults 40+ taking low-dose aspirin (%)
Reproductive Health - Vaginal deliveries (%)
Reproductive Health - Cesarean deliveries (%)
Reproductive Health - Deliveries resulted in a live birth (%)
Reproductive Health - Pregnancies resulted in a delivery (%)
Reproductive Health - Women breastfeeding newborns (%)
Reproductive Health - Women that had a hysterectomy (%)
Reproductive Health - Women that had both ovaries removed (%)
Reproductive Health - Women that have ever taken birth control pills (%)
Reproductive Health - Women taking birth control pills (%)
Reproductive Health - Women that have ever used Depo-Provera or injectables (%)
Reproductive Health - Women that have ever used female hormones (%)
Sexual Behavior - People 18+ that ever had sex (vaginal, anal, or oral) (%)
Sexual Behavior - Males 18+ that ever had vaginal sex with a woman (%)
Sexual Behavior - Males 18+ that ever performed oral sex on a woman (%)
Sexual Behavior - Males 18+ that ever had anal sex with a woman (%)
Sexual Behavior - Males 18+ that ever had any sex with a man (%)
Sexual Behavior - Females 18+ that ever had vaginal sex with a man (%)
Sexual Behavior - Females 18+ that ever performed oral sex on a man (%)
Sexual Behavior - Females 18+ that ever had anal sex with a man (%)
Sexual Behavior - Females 18+ that ever had any kind of sex with a woman (%)
Sexual Behavior - Average age people first had sex
Sexual Behavior - Average number of female sex partners in lifetime (males 18+)
Sexual Behavior - Average number of female vaginal sex partners in lifetime (males 18+)
Sexual Behavior - Average age people first performed oral sex on a woman (18+)
Sexual Behavior - Average number of woman performed oral sex on in lifetime (18+)
Sexual Behavior - Average number of male sex partners in lifetime (males 18+)
Sexual Behavior - Average number of male anal sex partners in lifetime (males 18+)
Sexual Behavior - Average age people first performed oral sex on a man (18+)
Sexual Behavior - Average number of male oral sex partners in lifetime (18+)
Sexual Behavior - People using protection when performing oral sex (%)
Sexual Behavior - Average number of times people have vaginal or anal sex a year
Sexual Behavior - People having sex without condom (%)
Sexual Behavior - Average number of male sex partners in lifetime (females 18+)
Sexual Behavior - Average number of male vaginal sex partners in lifetime (females 18+)
Sexual Behavior - Average number of female sex partners in lifetime (females 18+)
Sexual Behavior - Circumcised males 18+ (%)
Sleep Disorders - Average hours sleeping at night
Sleep Disorders - People that has trouble sleeping (%)
Smoking-Cigarette Use - People smoking cigarettes (%)
Taste & Smell - People 40+ having problems with smell (%)
Taste & Smell - People 40+ having problems with taste (%)
Taste & Smell - People 40+ that ever had wisdom teeth removed (%)
Taste & Smell - People 40+ that ever had tonsils teeth removed (%)
Taste & Smell - People 40+ that ever had a loss of consciousness because of a head injury (%)
Taste & Smell - People 40+ that ever had a broken nose or other serious injury to face or skull (%)
Taste & Smell - People 40+ that ever had two or more sinus infections (%)
Weight - Average height (inches)
Weight - Average weight (pounds)
Weight - Average BMI
Weight - People that are obese (%)
Weight - People that ever were obese (%)
Weight - People trying to lose weight (%)
Officers per 1,000 residents here:
1.51Wisconsin average:
2.07
Latest news from Neenah, WI collected exclusively by city-data.com from local newspapers, TV, and radio stations
Ancestries: German (39.0%), American (7.3%), Irish (4.3%), English (4.1%), Polish (3.7%), Norwegian (2.9%).
Current Local Time:
Land area: 8.25 square miles.
Population density: 3,318 people per square mile (average).
854 residents are foreign born (1.3% Asia , 0.8% Latin America , 0.7% Europe ).
This city:
3.1%Wisconsin:
5.0%
Median real estate property taxes paid for housing units with mortgages in 2022: $2,996 (1.6%)Median real estate property taxes paid for housing units with no mortgage in 2022: $3,498 (1.6%)
Nearest city with pop. 50,000+: Appleton, WI
Nearest city with pop. 200,000+: Milwaukee, WI
Nearest city with pop. 1,000,000+: Chicago, IL
Nearest cities:
Latitude: 44.17 N, Longitude: 88.47 W
Daytime population change due to commuting: +5,384 (+19.8%)Workers who live and work in this city: 5,538 (39.1%)
Single-family new house construction building permits:
2022: 37 buildings , average cost: $370,6002021: 38 buildings , average cost: $249,6002020: 36 buildings , average cost: $310,5002019: 30 buildings , average cost: $269,1002018: 28 buildings , average cost: $253,3002017: 44 buildings , average cost: $237,1002016: 46 buildings , average cost: $194,6002015: 59 buildings , average cost: $193,1002014: 52 buildings , average cost: $202,1002013: 36 buildings , average cost: $169,9002012: 44 buildings , average cost: $158,0002011: 54 buildings , average cost: $169,3002010: 46 buildings , average cost: $170,9002009: 34 buildings , average cost: $148,3002008: 99 buildings , average cost: $165,9002007: 31 buildings , average cost: $198,6002006: 44 buildings , average cost: $204,0002005: 73 buildings , average cost: $175,2002004: 98 buildings , average cost: $178,4002003: 120 buildings , average cost: $154,8002002: 37 buildings , average cost: $177,4002001: 56 buildings , average cost: $167,0002000: 61 buildings , average cost: $159,7001999: 83 buildings , average cost: $165,1001998: 79 buildings , average cost: $153,7001997: 68 buildings , average cost: $163,100Unemployment in December 2023:
Population change in the 1990s: +990 (+4.2%).
Most common occupations in Neenah, WI (%)
Both Males Females
Other production occupations, including supervisors (9.7%)
Material recording, scheduling, dispatching, and distributing workers (3.8%)
Other office and administrative support workers, including supervisors (3.3%)
Preschool, kindergarten, elementary, and middle school teachers (2.9%)
Other sales and related occupations, including supervisors (2.9%)
Metal workers and plastic workers (2.7%)
Electrical equipment mechanics and other installation, maintenance, and repair workers, including supervisors (2.6%)
Other production occupations, including supervisors (11.5%)
Metal workers and plastic workers (4.4%)
Electrical equipment mechanics and other installation, maintenance, and repair workers, including supervisors (4.3%)
Driver/sales workers and truck drivers (4.1%)
Material recording, scheduling, dispatching, and distributing workers (4.1%)
Other management occupations, except farmers and farm managers (3.2%)
Sales representatives, services, wholesale and manufacturing (3.2%)
Other production occupations, including supervisors (7.7%)
Preschool, kindergarten, elementary, and middle school teachers (5.8%)
Other office and administrative support workers, including supervisors (5.3%)
Secretaries and administrative assistants (4.5%)
Information and record clerks, except customer service representatives (4.1%)
Material recording, scheduling, dispatching, and distributing workers (3.5%)
Customer service representatives (3.5%)
Air pollution and air quality trends(lower is better)
AQI Ozone PM2.5
Tornado activity:
Neenah-area historical tornado activity is slightly above Wisconsin state average. It is 31% greater than the overall U.S. average.
On 4/21/1974, a category F4 (max. wind speeds 207-260 mph) tornado 7.8 miles away from the Neenah city center injured 35 people and caused between $500,000 and $5,000,000 in damages.
On 7/18/1996, a category F5 (max. wind speeds 261-318 mph) tornado 31.7 miles away from the city center injured 12 people and caused $40 million in damages.
Earthquake activity:
Neenah-area historical earthquake activity is significantly above Wisconsin state average. It is 10% smaller than the overall U.S. average. On 4/18/2008 at 09:36:59, a magnitude 5.4 (5.1 MB, 4.8 MS, 5.4 MW, 5.2 MW, Class: Moderate, Intensity: VI - VII) earthquake occurred 396.9 miles away from the city center On 6/28/2004 at 06:10:52, a magnitude 4.2 (4.2 MW, Depth: 6.2 mi, Class: Light, Intensity: IV - V) earthquake occurred 189.0 miles away from the city center On 5/2/2015 at 16:23:07, a magnitude 4.2 (4.2 MW, Depth: 2.8 mi) earthquake occurred 203.6 miles away from the city center On 6/10/1987 at 23:48:54, a magnitude 5.1 (4.9 MB, 4.4 MS, 4.6 MS, 5.1 LG) earthquake occurred 371.5 miles away from Neenah center On 4/18/2008 at 09:36:59, a magnitude 5.2 (5.2 MW, Depth: 8.9 mi) earthquake occurred 397.0 miles away from Neenah center On 2/10/2010 at 09:59:35, a magnitude 3.8 (3.8 MW, Depth: 6.2 mi, Class: Light, Intensity: II - III) earthquake occurred 152.5 miles away from Neenah center Magnitude types: regional Lg-wave magnitude (LG), body-wave magnitude (MB), surface-wave magnitude (MS), moment magnitude (MW) Natural disasters: The number of natural disasters in Winnebago County (9) is smaller than the US average (15).Major Disasters (Presidential) Declared: 7Emergencies Declared: 2Floods: 5, Storms: 4, Tornadoes: 4, Drought: 1, Hurricane: 1, Other: 1 (Note: some incidents may be assigned to more than one category). Main business address for: PLEXUS CORP PRINTED CIRCUIT BOARDS ), NEENAH FOUNDRY CO GLASS, GLASSWARE, PRESSED OR BLOWN ), OUTLOOK GROUP CORP COMMERCIAL PRINTING ).
Hospitals and medical centers in Neenah: CHILDRENS HSPTL OF WI FOX VALLEY (provides emergency services, 130 SECOND ST) THEDA CLARK MED CTR (Voluntary non-profit - Private, 130 2ND ST) VNA HOME CARE AND HOSPICE (201 E BELL STREET) KINDRED TRANSITIONAL CARE AND REHAB-VALLHAVEN (125 BYRD AVE)
VALLHAVEN CARE CENTER (125 BYRD AVE)
FMC - NEENAH (300 N COMMERCIAL ST, STE 100)
AFFINITY VISITING NURSES (816 WEST WINNECONNE AVE)
Amtrak stations near Neenah: 8 miles: APPLETON (500 N. ONEIDA ST.) - Bus Station Services: enclosed waiting area, intercity bus service.
12 miles: OSHKOSH (124 N. MAIN ST.) - Bus Station Colleges/universities with over 2000 students nearest to Neenah:
Lawrence University (about 7 miles; Appleton, WI ; Full-time enrollment: 2,821)
Fox Valley Technical College (about 8 miles; Appleton, WI ; FT enrollment: 5,682)
University of Wisconsin-Oshkosh (about 12 miles; Oshkosh, WI ; FT enrollment: 10,637)
Moraine Park Technical College (about 28 miles; Fond du Lac, WI ; FT enrollment: 3,079)
Saint Norbert College (about 28 miles; De Pere, WI ; FT enrollment: 2,324)
Marian University (about 28 miles; Fond Du Lac, WI ; FT enrollment: 2,045)
Northeast Wisconsin Technical College (about 31 miles; Green Bay, WI ; FT enrollment: 6,069)
Public high school in Neenah: NEENAH HIGH Students: 2,068, Location: 1275 TULLAR RD, Grades: 9-12)Private high school in Neenah: ST MARY CENTRAL HIGH SCHOOL Students: 239, Location: 1050 ZEPHYR DR, Grades: 9-12)
Biggest public elementary/middle schools in Neenah: SHATTUCK MIDDLE Students: 927, Location: 600 ELM ST, Grades: 7-8)HORACE MANN MIDDLE Students: 444, Location: 1021 OAK ST, Grades: 6)SPRING ROAD ELEMENTARY Students: 423, Location: 1191 COUNTY ROAD II, Grades: PK-5)TULLAR ELEMENTARY Students: 393, Location: 925 TULLAR RD, Grades: PK-5)COOLIDGE ELEMENTARY Students: 367, Location: 321 ALCOTT DR, Grades: PK-5)ACE CHARTER SCHOOL Students: 111, Location: 215 E FOREST AVE, Grades: KG-5, Charter school )TAFT ELEMENTARY Students: 43, Location: 133 S WESTERN AVE, Grades: KG-5)ROOSEVELT ELEMENTARY Location: 215 E FOREST AVE, Grades: PK-5)
WILSON ELEMENTARY Location: 920 HIGGINS AVE, Grades: PK-5)
LAKEVIEW ELEMENTARY Location: 1645 S COMMERCIAL ST, Grades: PK-5)
Private elementary/middle schools in Neenah: NEW HOPE CHRISTIAN SCHOOL Students: 262, Location: 1850 AMERICAN DR, Grades: PK-8)
TCCES - ST MARGARET MARY SCHOOL Students: 255, Location: 610 DIVISION ST, Grades: PK-5)
FOX VALLEY CHRISTIAN ACADEMY Students: 180, Location: 1450 OAKRIDGE RD, Grades: PK-8)
ST GABRIEL ELEMENTARY SCHOOL Students: 180, Location: 900 GEIGER ST, Grades: PK-5)
TRINITY LUTHERAN SCHOOL Students: 126, Location: 410 OAK ST, Grades: PK-8)
MARTIN LUTHER LUTHERAN SCHOOL Students: 121, Location: 807 ADAMS ST, Grades: PK-8)
See full list of schools located in Neenah Library in Neenah: NEENAH PUBLIC LIBRARY Operating income: $1,937,303; Location: 240 E. WISCONSIN AVE.; 167,418 books ; 11,266 e-books ; 22,027 audio materials ; 22,804 video materials ; 3 local licensed databases ; 28 state licensed databases ; 11 other licensed databases ; 349 print serial subscriptions ; 3 electronic serial subscriptions )
Notable locations in Neenah: (A) , Neenah City Hall (B) , Doty Museum (C) , Gold Cross Ambulance Service Neenah (D) , Neenah - Menasha Fire Rescue Station 31 (E) , Neenah - Menasha Fire Rescue Station 32 (F) , Fox Valley Technical College Regional Fire Training Center (G) . Display/hide their locations on the map
Shopping Center: (1) . Display/hide its location on the map
Main business address in Neenah include: (A) , NEENAH FOUNDRY CO (B) . Display/hide their locations on the map
Churches in Neenah include: (A) , First Church of Christ Scientist (B) , First Presbyterian Church (C) , First United Methodist Church (D) , Immanuel Evangelical Lutheran Church (E) , Our Saviors Lutheran Church (F) , Saint Margaret Mary Roman Catholic Church (G) , Saint Paul English Evangelical Lutheran Church (H) , Trinity Evangelical Lutheran Church (I) . Display/hide their locations on the map
Cemetery: (1) . Display/hide its location on the map
Reservoir: (A) . Display/hide its location on the map
Parks in Neenah include: (1) , Kimberly Park (2) , Riverside Park (3) , Washington Park (4) , Arrow Head Park (5) , Columbia Park (6) , Shattuck Park (7) . Display/hide their locations on the map
Tourist attractions:
Hotels:
Court:
Birthplace of: Dan Schutte - Musician, Kenneth E. Stumpf - Army Medal of Honor recipient, Kris Kelderman - Soccer player-coach, Peter Konz - Football player, Reid Ribble - Politician, Donna J. Seidel - Politician, Elmer J. Burr - Army Medal of Honor recipient, Dan Meyer (Wisconsin politician) - Politician, John Whitlinger - Tennis player, John Wroblewski - Ice hockey player and coach.
Winnebago County has a predicted average indoor radon screening level between 2 and 4 pCi/L (pico curies per liter) - Moderate Potential Drinking water stations with addresses in Neenah and their reported violations in the past:
OINKS (Population served: 110, Groundwater):
Past monitoring violations:
One routine major monitoring violation
One regular monitoring violation
Population served: 110, Groundwater):
Past health violations:
MCL, Monthly (TCR) - In JUL-2013, Contaminant: Coliform. Follow-up actions: St Boil Water Order (JUL-09-2013), St Violation/Reminder Notice (JUL-09-2013), St Public Notif requested (JUL-09-2013), St Compliance achieved (JUL-18-2013), St Other (JUL-22-2013), St Public Notif received (NOV-11-2013)
Population served: 50, Groundwater):
Past health violations:
MCL, Monthly (TCR) - In AUG-2008, Contaminant: Coliform. Follow-up actions: St Boil Water Order (AUG-07-2008), St Violation/Reminder Notice (AUG-07-2008), St Public Notif requested (AUG-07-2008), St Public Notif received (SEP-26-2008), St Compliance achieved (OCT-15-2008)
Population served: 50, Groundwater):
Past health violations:
MCL, Acute (TCR) - In JUN-2013, Contaminant: Coliform. Follow-up actions: St Public Notif requested (JUN-21-2013), St Public Notif received (JUN-21-2013), St Violation/Reminder Notice (JUN-21-2013), St Boil Water Order (JUN-21-2013), St Compliance achieved (JUL-17-2013), St Other (JUL-18-2013)
Population served: 25, Groundwater):
Past health violations:
MCL, Average - Between JAN-2008 and DEC-2008, Contaminant: Nitrate. Follow-up actions: St Violation/Reminder Notice (JUN-02-2008), St Public Notif requested (JUN-02-2008), St Public Notif received (JUL-02-2008), St Violation/Reminder Notice (MAR-10-2009), St Public Notif received (JUN-05-2009), St Compliance achieved (MAR-17-2011), St Other (APR-23-2012)
Past monitoring violations:
One routine major monitoring violation
2 regular monitoring violations
Population served: 25, Groundwater):
Past monitoring violations:
One routine major monitoring violation
One regular monitoring violation
Population served: 25, Groundwater):
Past monitoring violations:
Monitoring, Repeat Major (TCR) - Between JAN-2008 and SEP-2008, Contaminant: Coliform (TCR). Follow-up actions: St Public Notif requested (JUL-01-2008), St Violation/Reminder Notice (JUL-01-2008), St Compliance achieved (JAN-28-2009)
4 routine major monitoring violations
3 regular monitoring violations
Population served: 25, Groundwater):
Past monitoring violations:
One routine major monitoring violation
One regular monitoring violation
Drinking water stations with addresses in Neenah that have no violations reported:
RIDGEWAY COUNTRY CLUB CLUBHOUSE (Population served: 50, Primary Water Source Type: Groundwater)
WOODSHED BAR & RESTR (Population served: 25, Primary Water Source Type: Groundwater)
PAYNES POINT BAR (Population served: 25, Primary Water Source Type: Groundwater)
Average household size: This city:
2.4 peopleWisconsin:
2.4 people
Percentage of family households: This city:
62.7%Whole state:
64.4%
Percentage of households with unmarried partners: This city:
7.4%Whole state:
7.3%
Likely homosexual households (counted as self-reported same-sex unmarried-partner households)
Lesbian couples: 0.3% of all households Gay men: 0.2% of all households
People in group quarters in Neenah in 2010:
211 people in nursing facilities/skilled-nursing facilities
37 people in group homes intended for adults
14 people in correctional facilities intended for juveniles
8 people in group homes for juveniles (non-correctional)
5 people in workers' group living quarters and job corps centers
2 people in other noninstitutional facilities
People in group quarters in Neenah in 2000:
133 people in other group homes
60 people in other noninstitutional group quarters
31 people in homes for the mentally retarded
10 people in homes for the mentally ill
9 people in hospitals/wards and hospices for chronically ill
9 people in other hospitals or wards for chronically ill
8 people in homes or halfway houses for drug/alcohol abuse
7 people in mental (psychiatric) hospitals or wards
5 people in wards in general hospitals for patients who have no usual home elsewhere
Banks with branches in Neenah (2011 data):
Associated Bank, National Association: Neenah Main Branch, Neenah West Branch, Neenah Auto Branch, Neenah Pick N Save Branch. Info updated 2008/09/12: Bank assets: $21,715.0 mil, Deposits: $15,244.4 mil, headquarters in Green Bay, WI, positive income , Commercial Lending Specialization, 282 total offices , Holding Company: Associated Banc-Corp
AnchorBank, fsb: 1065 S Lake Street Branch at 1065 S Lake Street, branch established on 1893/01/01. Info updated 2011/07/21: Bank assets: $3,067.4 mil, Deposits: $2,481.9 mil, headquarters in Madison, WI, negative income in the last year , Commercial Lending Specialization, 56 total offices
Citizens Community Federal: Neenah at 1155 Winneconne Ave, branch established on 2009/04/22. Info updated 2011/07/21: Bank assets: $530.8 mil, Deposits: $444.7 mil, headquarters in Eau Claire, WI, positive income , Mortgage Lending Specialization, 28 total offices
Bank Mutual: 101 W Wisconsin Avenue Branch at 101 W Wisconsin Avenue, branch established on 1940/08/14. Info updated 2011/07/21: Bank assets: $2,497.0 mil, Deposits: $2,046.0 mil, headquarters in Brown Deer, WI, negative income in the last year , Mortgage Lending Specialization, 79 total offices
BMO Harris Bank National Association: Neenah Branch at 643 South Green Bay Road, branch established on 1990/08/15. Info updated 2011/07/14: Bank assets: $97,264.0 mil, Deposits: $75,624.6 mil, headquarters in Chicago, IL, positive income , 717 total offices , Holding Company: Bank Of Montreal
JPMorgan Chase Bank, National Association: Neenah Branch at 111 East Wisconsin Avenue, branch established on 1881/11/01. Info updated 2011/11/10: Bank assets: $1,811,678.0 mil, Deposits: $1,190,738.0 mil, headquarters in Columbus, OH, positive income , International Specialization, 5577 total offices , Holding Company: Jpmorgan Chase & Co.
Wells Fargo Bank, National Association: Neenah Branch at 931 South Green Bay Road, branch established on 1997/11/03. Info updated 2011/04/05: Bank assets: $1,161,490.0 mil, Deposits: $905,653.0 mil, headquarters in Sioux Falls, SD, positive income , 6395 total offices , Holding Company: Wells Fargo & Company
The First National Bank - Fox Valley: at 550 South Green Bay Road, branch established on 1887/01/01. Info updated 2006/11/03: Bank assets: $317.7 mil, Deposits: $273.8 mil, local headquarters , positive income , Commercial Lending Specialization, 4 total offices , Holding Company: First Menasha Bancshares, Inc.
For population 15 years and over in Neenah:
Never married: 35.2%Now married: 47.0%Separated: 0.7%Widowed: 4.5%Divorced: 12.5% For population 25 years and over in Neenah:
High school or higher: 95.1%Bachelor's degree or higher: 33.0%Graduate or professional degree: 10.6%Unemployed: 3.5%Mean travel time to work (commute): 14.7 minutes
Education Gini index (Inequality in education) Here:
9.6Wisconsin average:
10.4
Religion statistics for Neenah, WI (based on Winnebago County data)
Religion Adherents Congregations Catholic 36,514 11 Evangelical Protestant 23,938 66 Mainline Protestant 21,022 43 Other 1,359 10 None 84,161 -
Source: Clifford Grammich, Kirk Hadaway, Richard Houseal, Dale E.Jones, Alexei Krindatch, Richie Stanley and Richard H.Taylor. 2012. 2010 U.S.Religion Census: Religious Congregations & Membership Study. Association of Statisticians of American Religious Bodies. Jones, Dale E., et al. 2002. Congregations and Membership in the United States 2000. Nashville, TN: Glenmary Research Center. Graphs represent county-level data
Food Environment Statistics: Number of grocery stores : 12This county :
0.74 / 10,000 pop.Wisconsin :
1.86 / 10,000 pop.
Number of supercenters and club stores : 1This county :
0.06 / 10,000 pop.State :
0.11 / 10,000 pop.
Number of convenience stores (no gas) : 3This county :
0.19 / 10,000 pop.Wisconsin :
0.38 / 10,000 pop.
Number of convenience stores (with gas) : 56This county :
3.47 / 10,000 pop.Wisconsin :
4.12 / 10,000 pop.
Number of full-service restaurants : 121Winnebago County :
7.50 / 10,000 pop.Wisconsin :
8.64 / 10,000 pop.
Adult diabetes rate : Winnebago County :
7.4%Wisconsin :
7.6%
Adult obesity rate : Winnebago County :
26.3%Wisconsin :
27.5%
Low-income preschool obesity rate : This county :
13.4%Wisconsin :
13.0%
Health and Nutrition: Healthy diet rate : Neenah:
49.6%Wisconsin:
49.5%
Average overall health of teeth and gums : People feeling badly about themselves : Neenah:
21.9%Wisconsin:
21.4%
People not drinking alcohol at all : Neenah:
9.7%Wisconsin:
10.2%
Average hours sleeping at night : General health condition : Average condition of hearing : Neenah:
78.8%Wisconsin:
78.5%
More about Health and Nutrition of Neenah, WI Residents
Local government employment and payroll (March 2022)
Function
Full-time employees
Monthly full-time payroll
Average yearly full-time wage
Part-time employees
Monthly part-time payroll
Firefighters
70 $456,260 $78,216 0 $0 Police Protection - Officers
40 $315,888 $94,766 0 $0 Streets and Highways
32 $251,894 $94,460 1 $2,024 Water Supply
17 $112,790 $79,616 1 $1,388 Financial Administration
15 $86,630 $69,304 0 $0 Parks and Recreation
15 $83,373 $66,698 10 $5,812 Local Libraries
11 $60,648 $66,161 32 $36,218 Solid Waste Management
10 $50,757 $60,908 0 $0 Police - Other
9 $40,503 $54,004 24 $22,740 Housing and Community Development (Local)
8 $47,025 $70,538 1 $968 Other Government Administration
5 $28,762 $69,029 1 $321 Judicial and Legal
2 $13,770 $82,620 0 $0 Welfare
1 $6,197 $74,364 0 $0 Fire - Other
1 $4,298 $51,576 0 $0
Totals for Government
236 $1,558,795 $79,261 70 $69,471
Neenah government finances - Expenditure in 2021 (per resident):
Construction - Regular Highways: $3,141,000 ($114.80)
Parks and Recreation: $804,000 ($29.38)Police Protection: $618,000 ($22.59)General - Other: $243,000 ($8.88)Libraries: $104,000 ($3.80)Local Fire Protection: $99,000 ($3.62)General Public Buildings: $12,000 ($0.44)Current Operations - Police Protection: $6,691,000 ($244.55)
Local Fire Protection: $5,152,000 ($188.30)Water Utilities: $4,785,000 ($174.88)Regular Highways: $4,418,000 ($161.47)Sewerage: $4,102,000 ($149.92)Libraries: $2,284,000 ($83.48)Parks and Recreation: $2,143,000 ($78.32)General - Other: $1,683,000 ($61.51)Solid Waste Management: $1,312,000 ($47.95)Financial Administration: $1,198,000 ($43.78)Central Staff Services: $895,000 ($32.71)Transit Utilities: $474,000 ($17.32)Housing and Community Development: $381,000 ($13.92)Protective Inspection and Regulation - Other: $375,000 ($13.71)General Public Buildings: $348,000 ($12.72)Judicial and Legal Services: $307,000 ($11.22)Miscellaneous Commercial Activities - Other: $259,000 ($9.47)Parking Facilities: $236,000 ($8.63)Natural Resources - Other: $202,000 ($7.38)Correctional Institutions: $5,000 ($0.18)General - Interest on Debt: $2,348,000 ($85.82)
Other Capital Outlay - General - Other: $1,090,000 ($39.84)
Regular Highways: $511,000 ($18.68)
Neenah government finances - Revenue in 2021 (per resident):
Charges - Sewerage: $4,664,000 ($170.46)
Regular Highways: $1,874,000 ($68.49)Solid Waste Management: $421,000 ($15.39)Parks and Recreation: $295,000 ($10.78)Parking Facilities: $257,000 ($9.39)Miscellaneous Commercial Activities: $112,000 ($4.09)Other: $25,000 ($0.91)Natural Resources - Other: $8,000 ($0.29)Federal Intergovernmental - General Local Government Support: $493,000 ($18.02)
Housing and Community Development: $239,000 ($8.74)Highways: $93,000 ($3.40)Local Intergovernmental - Other: $1,547,000 ($56.54)
Transit Utilities: $1,000 ($0.04)Miscellaneous - General Revenue - Other: $1,847,000 ($67.50)
Interest Earnings: $753,000 ($27.52)Special Assessments: $402,000 ($14.69)Rents: $212,000 ($7.75)Donations From Private Sources: $188,000 ($6.87)Sale of Property: $103,000 ($3.76)Fines and Forfeits: $68,000 ($2.49)Revenue - Water Utilities: $8,146,000 ($297.72)
State Intergovernmental - General Local Government Support: $3,025,000 ($110.56)
Highways: $1,119,000 ($40.90)Education: $685,000 ($25.04)Other: $311,000 ($11.37)Transit Utilities: $275,000 ($10.05)Tax - Property: $21,184,000 ($774.24)
Other License: $379,000 ($13.85)Occupation and Business License - Other: $330,000 ($12.06)Other Selective Sales: $35,000 ($1.28)
Neenah government finances - Debt in 2021 (per resident):
Long Term Debt - Outstanding Unspecified Public Purpose: $79,750,000 ($2914.73)
Beginning Outstanding - Unspecified Public Purpose: $74,341,000 ($2717.04)Issue, Unspecified Public Purpose: $20,595,000 ($752.71)Retired Unspecified Public Purpose: $15,187,000 ($555.06)Short Term Debt Outstanding - Beginning: $10,402,000 ($380.18)
End of Fiscal Year: $8,204,000 ($299.84)
Businesses in Neenah, WI
Name Count Name Count
Ace Hardware 1 KFC 1 Advance Auto Parts 1 Kohl's 1 Applebee's 1 Little Caesars Pizza 1 Arby's 1 McDonald's 2 AutoZone 1 Nike 3 Best Western 1 Papa John's Pizza 1 Blockbuster 1 Penske 1 Burger King 1 Pizza Hut 1 Chevrolet 1 RadioShack 1 Curves 1 Ryder Rental & Truck Leasing 1 Dairy Queen 2 Sprint Nextel 1 Days Inn 1 Starbucks 1 Domino's Pizza 1 Subway 4 FedEx 1 Taco Bell 1 Ford 1 True Value 1 GNC 1 U-Haul 1 H&R Block 1 UPS 3 Hardee's 1 Walgreens 2 Holiday Inn 1 Walmart 1 Jimmy John's 1 YMCA 1
Strongest AM radio stations in Neenah:
WNAM (1280 AM; 50 kW; NEENAH-MENASHA, WI; Owner: CUMULUS LICENSING CORP.)
WHBY (1150 AM; 25 kW; KIMBERLY, WI; Owner: WOODWARD COMMUNICATIONS, INC.)
WSCO (1570 AM; 1 kW; APPLETON, WI; Owner: WOODWARD COMMUNICATIONS, INC.)
WSPT (1010 AM; 50 kW; STEVENS POINT, WI)
WTAQ (1360 AM; 10 kW; GREEN BAY, WI; Owner: MIDWEST COMMUNICATIONS, INC.)
WJOK (1050 AM; 1 kW; KAUKAUNA, WI; Owner: STARBOARD BROADCASTING, INC.)
WOSH (1490 AM; 1 kW; OSHKOSH, WI; Owner: CUMULUS LICENSING CORP.)
WTMJ (620 AM; 50 kW; MILWAUKEE, WI; Owner: JOURNAL BROADCAST CORPORATION)
WSAU (550 AM; 20 kW; WAUSAU, WI; Owner: WRIG, INC.)
WDUX (800 AM; 5 kW; WAUPACA, WI; Owner: LAIRD BROADCASTING COMPANY, INC.)
WVCY (690 AM; 0 kW; OSHKOSH, WI; Owner: VCY/AMERICA, INC.)
WISN (1130 AM; 50 kW; MILWAUKEE, WI; Owner: CAPSTAR TX LIMITED PARTNERSHIP)
WNFL (1440 AM; 5 kW; GREEN BAY, WI; Owner: MIDWEST COMMUNICATIONS, INC.)
Strongest FM radio stations in Neenah:
WROE (94.3 FM; NEENAH-MENASHA, WI; Owner: MIDWEST COMMUNICATIONS, INC.)
WAPL-FM (105.7 FM; APPLETON, WI; Owner: WOODWARD COMMUNICATIONS, INC.)
WNCY-FM (100.3 FM; NEENAH-MENASHA, WI; Owner: MIDWEST COMMUNICATIONS, INC.)
WEMI (91.9 FM; APPLETON, WI; Owner: EVANGEL MINISTRIES, INC.)
WWWX (96.9 FM; OSHKOSH, WI; Owner: CUMULUS LICENSING CORP.)
WLFM (91.1 FM; APPLETON, WI; Owner: LAWRENCE UNIVERSITY OF WISCONSIN)
W271AC (102.1 FM; APPLETON, WI; Owner: FAMILY EDUC. BROADCASTING CORP.)
WVBO (103.9 FM; WINNECONNE, WI; Owner: CUMULUS LICENSING CORP.)
W203AV (88.5 FM; OSHKOSH, WI; Owner: WRVM, INC.)
WPCK (104.9 FM; KAUKAUNA, WI; Owner: MIDWEST DIMENSIONS, INC.)
WHID (88.1 FM; GREEN BAY, WI; Owner: BD OF REGENTS OF THE UNIV OF WI SYS)
WIXX (101.1 FM; GREEN BAY, WI; Owner: MIDWEST COMMUNICATIONS, INC.)
WOGB (103.1 FM; KAUKAUNA, WI; Owner: CUMULUS LICENSING CORP.)
WPNE-FM (89.3 FM; GREEN BAY, WI; Owner: WISCONSIN EDUCATIONAL COMMUNICATIONS BOARD)
WXWX (107.5 FM; BRILLION, WI; Owner: CUMULUS LICENSING CORP.)
WKSZ (95.9 FM; DE PERE, WI; Owner: WOODWARD COMMUNICATIONS INC)
WORQ (90.1 FM; GREEN BAY, WI; Owner: LAKESHORE COMMUNICATIONS, INC.)
WOZZ (93.5 FM; NEW LONDON, WI; Owner: MIDWEST COMMUNICATIONS, INC)
WEMY (91.5 FM; GREEN BAY, WI; Owner: EVANGEL MINISTRIES, INC)
WECB (104.3 FM; SEYMOUR, WI; Owner: WOODWARD COMMUNICATIONS, INC.)
TV broadcast stations around Neenah:
W17CF (Channel 17; RIPON, WI; Owner: TRINITY BROADCASTING NETWORK)
W23BL (Channel 23; TRAVERSE CITY, MI; Owner: MS COMMUNICATIONS, LLC)
WMMF-TV (Channel 68; FOND DU LAC, WI; Owner: PAPPAS TELECASTING OF WISCONSIN, A CALIFORNIA LTD PARTNRSHP)
WLUK-TV (Channel 11; GREEN BAY, WI; Owner: EMMIS TELEVISION LICENSE CORPORATION)
WFRV-TV (Channel 5; GREEN BAY, WI; Owner: CBS BROADCASTING INC.)
WBAY-TV (Channel 2; GREEN BAY, WI; Owner: YOUNG BROADCASTING OF GREEN BAY, INC.)
WPNE (Channel 38; GREEN BAY, WI; Owner: WISCONSIN EDUCATIONAL COMMUNICATIONS BOARD)
WGBA (Channel 26; GREEN BAY, WI; Owner: ARIES TELECOMMUNICATION CORPORATION)
WACY (Channel 32; APPLETON, WI; Owner: ACE TV, INC.)
WIWB (Channel 14; SURING, WI; Owner: ACME TV LICENSES OF WISCONSIN, LLC)
W49CB (Channel 49; GREEN BAY, WI; Owner: TRINITY BROADCASTING NETWORK)
W30BU (Channel 30; GREEN BAY, WI; Owner: THREE ANGELS BROADCASTING NETWORK)
W66DC (Channel 66; WAUPACA, WI; Owner: TRINITY BROADCASTING NETWORK)
Medal of Honor Recipients
Medal of Honor Recipients born in Neenah: Elmer J. Burr, Kenneth E. Stumpf.
National Bridge Inventory (NBI) Statistics 64 Number of bridges712ft / 217m Total length $1,840,000 Total costs1,091,314 Total average daily traffic73,266 Total average daily truck traffic
New bridges - historical statistics
2 1920-1929 5 1960-1969 8 1970-1979 2 1980-1989 34 1990-1999 8 2000-2009 5 2010-2019
See full National Bridge Inventory statistics for Neenah, WI
Home Mortgage Disclosure Act Aggregated Statistics For Year 2009(Based on 2 full and 6 partial tracts) A) FHA, FSA/RHS & VA B) Conventional C) Refinancings D) Home Improvement Loans E) Loans on Dwellings For 5+ Families F) Non-occupant Loans on Number Average Value Number Average Value Number Average Value Number Average Value Number Average Value Number Average Value
LOANS ORIGINATED 70 $103,777 99 $106,678 467 $113,733 63 $38,040 5 $306,498 54 $94,598 APPLICATIONS APPROVED, NOT ACCEPTED 2 $123,095 4 $109,420 34 $107,875 4 $20,872 1 $64,380 1 $33,590 APPLICATIONS DENIED 7 $88,223 12 $88,300 91 $116,319 17 $11,334 1 $49,190 6 $89,673 APPLICATIONS WITHDRAWN 3 $95,080 8 $149,518 86 $120,392 6 $32,965 0 $0 3 $87,320 FILES CLOSED FOR INCOMPLETENESS 1 $137,950 3 $92,803 13 $131,774 1 $51,610 0 $0 1 $96,000
Aggregated Statistics For Year 2008(Based on 2 full and 6 partial tracts) A) FHA, FSA/RHS & VA B) Conventional C) Refinancings D) Home Improvement Loans E) Loans on Dwellings For 5+ Families F) Non-occupant Loans on G) Loans On Manufactured Number Average Value Number Average Value Number Average Value Number Average Value Number Average Value Number Average Value Number Average Value
LOANS ORIGINATED 47 $102,187 108 $111,106 327 $104,612 56 $37,785 4 $529,472 47 $80,389 0 $0 APPLICATIONS APPROVED, NOT ACCEPTED 5 $85,378 8 $106,862 37 $107,685 3 $60,627 0 $0 3 $87,297 0 $0 APPLICATIONS DENIED 4 $90,458 14 $70,066 134 $104,065 14 $46,204 0 $0 3 $50,903 1 $47,000 APPLICATIONS WITHDRAWN 5 $97,390 13 $119,805 70 $112,526 8 $53,360 0 $0 2 $83,015 1 $12,000 FILES CLOSED FOR INCOMPLETENESS 1 $123,280 4 $69,392 6 $116,345 0 $0 0 $0 0 $0 1 $29,000
Aggregated Statistics For Year 2007(Based on 2 full and 6 partial tracts) A) FHA, FSA/RHS & VA B) Conventional C) Refinancings D) Home Improvement Loans E) Loans on Dwellings For 5+ Families F) Non-occupant Loans on G) Loans On Manufactured Number Average Value Number Average Value Number Average Value Number Average Value Number Average Value Number Average Value Number Average Value
LOANS ORIGINATED 26 $118,883 202 $106,389 294 $93,862 80 $34,904 6 $842,000 83 $95,975 0 $0 APPLICATIONS APPROVED, NOT ACCEPTED 2 $66,970 9 $79,841 44 $98,010 6 $44,143 0 $0 3 $99,137 1 $11,510 APPLICATIONS DENIED 1 $120,680 33 $75,548 159 $99,914 41 $35,762 0 $0 12 $91,524 2 $14,720 APPLICATIONS WITHDRAWN 0 $0 11 $88,867 73 $105,092 10 $49,196 2 $892,500 4 $99,692 0 $0 FILES CLOSED FOR INCOMPLETENESS 1 $69,620 5 $70,764 24 $96,145 1 $110,430 0 $0 2 $67,000 0 $0
Aggregated Statistics For Year 2006(Based on 2 full and 6 partial tracts) A) FHA, FSA/RHS & VA B) Conventional C) Refinancings D) Home Improvement Loans E) Loans on Dwellings For 5+ Families F) Non-occupant Loans on G) Loans On Manufactured Number Average Value Number Average Value Number Average Value Number Average Value Number Average Value Number Average Value Number Average Value
LOANS ORIGINATED 35 $109,664 242 $94,981 346 $83,204 96 $24,899 2 $455,065 66 $88,748 1 $7,000 APPLICATIONS APPROVED, NOT ACCEPTED 3 $103,310 16 $86,386 50 $96,607 8 $11,906 0 $0 6 $95,473 0 $0 APPLICATIONS DENIED 4 $87,892 30 $95,904 212 $96,144 26 $22,158 0 $0 20 $107,879 2 $42,075 APPLICATIONS WITHDRAWN 1 $60,540 16 $93,338 111 $96,310 8 $36,778 2 $316,000 6 $76,328 0 $0 FILES CLOSED FOR INCOMPLETENESS 1 $79,000 3 $90,837 39 $112,139 0 $0 0 $0 1 $138,000 0 $0
Aggregated Statistics For Year 2005(Based on 2 full and 6 partial tracts) A) FHA, FSA/RHS & VA B) Conventional C) Refinancings D) Home Improvement Loans E) Loans on Dwellings For 5+ Families F) Non-occupant Loans on G) Loans On Manufactured Number Average Value Number Average Value Number Average Value Number Average Value Number Average Value Number Average Value Number Average Value
LOANS ORIGINATED 52 $109,846 280 $98,320 440 $85,032 103 $29,946 9 $543,116 76 $82,296 0 $0 APPLICATIONS APPROVED, NOT ACCEPTED 0 $0 45 $85,072 49 $94,208 9 $25,717 0 $0 5 $98,734 2 $28,375 APPLICATIONS DENIED 1 $68,000 41 $99,626 179 $96,024 37 $33,306 0 $0 11 $83,534 0 $0 APPLICATIONS WITHDRAWN 4 $92,970 30 $91,050 127 $104,653 14 $57,201 1 $2,480,000 3 $121,877 0 $0 FILES CLOSED FOR INCOMPLETENESS 1 $102,000 10 $96,926 52 $108,437 1 $9,510 0 $0 2 $151,365 0 $0
Aggregated Statistics For Year 2004(Based on 2 full and 6 partial tracts) A) FHA, FSA/RHS & VA B) Conventional C) Refinancings D) Home Improvement Loans E) Loans on Dwellings For 5+ Families F) Non-occupant Loans on G) Loans On Manufactured Number Average Value Number Average Value Number Average Value Number Average Value Number Average Value Number Average Value Number Average Value
LOANS ORIGINATED 54 $97,635 270 $100,508 502 $88,650 97 $35,194 9 $554,021 66 $92,066 1 $34,050 APPLICATIONS APPROVED, NOT ACCEPTED 1 $96,000 28 $96,403 49 $93,946 9 $33,808 0 $0 9 $67,738 0 $0 APPLICATIONS DENIED 1 $40,030 40 $80,258 195 $86,997 32 $41,238 0 $0 10 $79,156 3 $20,520 APPLICATIONS WITHDRAWN 3 $100,070 21 $112,520 94 $91,084 5 $13,552 1 $227,170 5 $85,166 0 $0 FILES CLOSED FOR INCOMPLETENESS 1 $52,210 5 $108,656 61 $101,956 1 $21,920 0 $0 0 $0 0 $0
Aggregated Statistics For Year 2003(Based on 2 full and 6 partial tracts) A) FHA, FSA/RHS & VA B) Conventional C) Refinancings D) Home Improvement Loans E) Loans on Dwellings For 5+ Families F) Non-occupant Loans on Number Average Value Number Average Value Number Average Value Number Average Value Number Average Value Number Average Value
LOANS ORIGINATED 52 $98,707 260 $94,087 1,042 $88,078 90 $19,190 6 $1,568,042 95 $80,539 APPLICATIONS APPROVED, NOT ACCEPTED 1 $110,480 13 $90,732 62 $89,232 4 $13,968 0 $0 2 $89,155 APPLICATIONS DENIED 1 $93,540 20 $83,991 238 $81,507 17 $16,681 0 $0 6 $56,042 APPLICATIONS WITHDRAWN 2 $118,730 19 $102,962 128 $80,084 5 $15,022 1 $132,110 2 $97,310 FILES CLOSED FOR INCOMPLETENESS 0 $0 3 $82,167 16 $99,872 1 $9,010 0 $0 0 $0
Aggregated Statistics For Year 2002(Based on 2 full and 5 partial tracts) A) FHA, FSA/RHS & VA B) Conventional C) Refinancings D) Home Improvement Loans E) Loans on Dwellings For 5+ Families F) Non-occupant Loans on Number Average Value Number Average Value Number Average Value Number Average Value Number Average Value Number Average Value
LOANS ORIGINATED 69 $89,554 202 $89,657 793 $83,645 62 $16,048 5 $567,030 64 $92,847 APPLICATIONS APPROVED, NOT ACCEPTED 3 $104,937 21 $64,739 56 $82,057 3 $32,560 0 $0 3 $72,827 APPLICATIONS DENIED 5 $77,564 22 $66,392 143 $80,805 30 $17,733 0 $0 7 $60,920 APPLICATIONS WITHDRAWN 7 $104,439 26 $80,751 70 $74,246 6 $5,292 0 $0 2 $106,265 FILES CLOSED FOR INCOMPLETENESS 1 $114,040 3 $94,863 11 $85,788 0 $0 0 $0 1 $121,070
Aggregated Statistics For Year 2001(Based on 2 full and 5 partial tracts) A) FHA, FSA/RHS & VA B) Conventional C) Refinancings D) Home Improvement Loans E) Loans on Dwellings For 5+ Families F) Non-occupant Loans on Number Average Value Number Average Value Number Average Value Number Average Value Number Average Value Number Average Value
LOANS ORIGINATED 55 $86,029 218 $84,523 585 $76,420 89 $14,910 6 $1,357,013 67 $83,946 APPLICATIONS APPROVED, NOT ACCEPTED 1 $82,130 18 $73,451 42 $67,705 4 $19,360 0 $0 2 $91,975 APPLICATIONS DENIED 3 $90,627 31 $61,265 112 $71,269 31 $14,712 1 $504,000 9 $68,261 APPLICATIONS WITHDRAWN 0 $0 11 $112,402 88 $72,272 8 $22,629 0 $0 3 $51,900 FILES CLOSED FOR INCOMPLETENESS 0 $0 3 $72,760 12 $72,186 1 $6,000 0 $0 2 $45,920
Aggregated Statistics For Year 2000(Based on 2 full and 5 partial tracts) A) FHA, FSA/RHS & VA B) Conventional C) Refinancings D) Home Improvement Loans E) Loans on Dwellings For 5+ Families F) Non-occupant Loans on Number Average Value Number Average Value Number Average Value Number Average Value Number Average Value Number Average Value
LOANS ORIGINATED 48 $87,308 207 $79,944 186 $49,157 84 $16,125 3 $217,407 29 $76,346 APPLICATIONS APPROVED, NOT ACCEPTED 0 $0 19 $68,567 21 $55,459 6 $27,030 0 $0 0 $0 APPLICATIONS DENIED 5 $92,678 33 $46,729 98 $48,610 26 $23,932 0 $0 2 $28,820 APPLICATIONS WITHDRAWN 5 $74,600 28 $59,985 44 $64,342 10 $12,250 0 $0 3 $33,450 FILES CLOSED FOR INCOMPLETENESS 0 $0 4 $73,405 10 $64,923 0 $0 0 $0 0 $0
Aggregated Statistics For Year 1999(Based on 2 full and 5 partial tracts) A) FHA, FSA/RHS & VA B) Conventional C) Refinancings D) Home Improvement Loans E) Loans on Dwellings For 5+ Families F) Non-occupant Loans on Number Average Value Number Average Value Number Average Value Number Average Value Number Average Value Number Average Value
LOANS ORIGINATED 46 $76,809 237 $77,355 375 $60,520 89 $15,708 2 $693,110 29 $66,201 APPLICATIONS APPROVED, NOT ACCEPTED 2 $77,520 13 $65,863 39 $59,458 8 $36,630 0 $0 2 $104,485 APPLICATIONS DENIED 5 $78,310 47 $61,254 99 $55,829 29 $18,422 0 $0 4 $34,650 APPLICATIONS WITHDRAWN 2 $58,500 20 $71,860 50 $52,173 14 $25,439 0 $0 3 $100,843 FILES CLOSED FOR INCOMPLETENESS 2 $94,290 5 $54,076 11 $86,391 1 $30,720 0 $0 0 $0
Detailed HMDA statistics for the following Tracts:
0031.00
, 0032.00 , 0033.00 , 0034.00 , 0035.00 , 0036.00 , 0037.01
Private Mortgage Insurance Companies Aggregated Statistics For Year 2009(Based on 2 full and 6 partial tracts) A) Conventional B) Refinancings C) Non-occupant Loans on Number Average Value Number Average Value Number Average Value
LOANS ORIGINATED 32 $106,299 28 $131,488 0 $0 APPLICATIONS APPROVED, NOT ACCEPTED 1 $153,400 5 $127,176 1 $44,040 APPLICATIONS DENIED 5 $98,314 3 $133,530 0 $0 APPLICATIONS WITHDRAWN 1 $122,770 1 $132,440 0 $0 FILES CLOSED FOR INCOMPLETENESS 1 $74,500 0 $0 0 $0
Aggregated Statistics For Year 2008(Based on 2 full and 6 partial tracts) A) Conventional B) Refinancings C) Non-occupant Loans on Number Average Value Number Average Value Number Average Value
LOANS ORIGINATED 56 $113,241 34 $120,172 3 $86,643 APPLICATIONS APPROVED, NOT ACCEPTED 5 $84,596 7 $115,571 0 $0 APPLICATIONS DENIED 1 $128,600 2 $125,880 2 $96,110 APPLICATIONS WITHDRAWN 1 $62,000 2 $130,275 0 $0 FILES CLOSED FOR INCOMPLETENESS 1 $164,320 0 $0 0 $0
Aggregated Statistics For Year 2007(Based on 2 full and 6 partial tracts) A) Conventional B) Refinancings C) Non-occupant Loans on Number Average Value Number Average Value Number Average Value
LOANS ORIGINATED 102 $99,889 30 $121,045 7 $67,339 APPLICATIONS APPROVED, NOT ACCEPTED 9 $110,321 8 $108,891 0 $0 APPLICATIONS DENIED 2 $94,865 3 $90,490 0 $0 APPLICATIONS WITHDRAWN 4 $103,838 2 $89,670 0 $0 FILES CLOSED FOR INCOMPLETENESS 0 $0 0 $0 0 $0
Aggregated Statistics For Year 2006(Based on 2 full and 6 partial tracts) A) Conventional B) Refinancings C) Non-occupant Loans on Number Average Value Number Average Value Number Average Value
LOANS ORIGINATED 70 $101,705 24 $113,345 6 $92,548 APPLICATIONS APPROVED, NOT ACCEPTED 4 $105,412 5 $132,066 1 $33,000 APPLICATIONS DENIED 1 $33,000 1 $110,360 1 $33,000 APPLICATIONS WITHDRAWN 3 $99,520 1 $77,180 0 $0 FILES CLOSED FOR INCOMPLETENESS 0 $0 0 $0 0 $0
Aggregated Statistics For Year 2005(Based on 2 full and 6 partial tracts) A) Conventional B) Refinancings C) Non-occupant Loans on Number Average Value Number Average Value Number Average Value
LOANS ORIGINATED 77 $99,719 34 $106,238 7 $75,270 APPLICATIONS APPROVED, NOT ACCEPTED 8 $102,779 6 $110,030 2 $110,500 APPLICATIONS DENIED 0 $0 1 $116,000 0 $0 APPLICATIONS WITHDRAWN 4 $110,015 0 $0 0 $0 FILES CLOSED FOR INCOMPLETENESS 0 $0 0 $0 0 $0
Aggregated Statistics For Year 2004(Based on 2 full and 6 partial tracts) A) Conventional B) Refinancings C) Non-occupant Loans on Number Average Value Number Average Value Number Average Value
LOANS ORIGINATED 66 $95,525 44 $100,599 6 $58,497 APPLICATIONS APPROVED, NOT ACCEPTED 6 $105,942 4 $100,570 0 $0 APPLICATIONS DENIED 0 $0 1 $117,000 0 $0 APPLICATIONS WITHDRAWN 2 $174,575 1 $87,000 0 $0 FILES CLOSED FOR INCOMPLETENESS 0 $0 3 $74,060 0 $0
Aggregated Statistics For Year 2003(Based on 2 full and 6 partial tracts) A) Conventional B) Refinancings C) Non-occupant Loans on Number Average Value Number Average Value Number Average Value
LOANS ORIGINATED 87 $90,025 134 $93,192 8 $58,766 APPLICATIONS APPROVED, NOT ACCEPTED 9 $93,510 30 $95,767 2 $42,375 APPLICATIONS DENIED 0 $0 1 $65,830 1 $65,830 APPLICATIONS WITHDRAWN 2 $86,835 10 $101,229 1 $128,010 FILES CLOSED FOR INCOMPLETENESS 0 $0 0 $0 0 $0
Aggregated Statistics For Year 2002(Based on 2 full and 5 partial tracts) A) Conventional B) Refinancings C) Non-occupant Loans on Number Average Value Number Average Value Number Average Value
LOANS ORIGINATED 58 $91,656 75 $96,768 5 $77,286 APPLICATIONS APPROVED, NOT ACCEPTED 6 $88,242 9 $104,084 0 $0 APPLICATIONS DENIED 0 $0 2 $82,995 2 $82,995 APPLICATIONS WITHDRAWN 1 $38,000 2 $104,545 1 $77,250 FILES CLOSED FOR INCOMPLETENESS 0 $0 2 $86,835 0 $0
Aggregated Statistics For Year 2001(Based on 2 full and 5 partial tracts) A) Conventional B) Refinancings C) Non-occupant Loans on Number Average Value Number Average Value Number Average Value
LOANS ORIGINATED 66 $87,913 79 $93,224 3 $65,017 APPLICATIONS APPROVED, NOT ACCEPTED 6 $164,517 8 $97,849 1 $137,040 APPLICATIONS DENIED 2 $85,565 1 $101,170 2 $114,960 APPLICATIONS WITHDRAWN 2 $77,170 2 $115,420 0 $0 FILES CLOSED FOR INCOMPLETENESS 0 $0 0 $0 0 $0
Aggregated Statistics For Year 2000(Based on 2 full and 5 partial tracts) A) Conventional B) Refinancings C) Non-occupant Loans on Number Average Value Number Average Value Number Average Value
LOANS ORIGINATED 65 $83,724 11 $82,902 2 $54,595 APPLICATIONS APPROVED, NOT ACCEPTED 5 $76,598 2 $126,980 0 $0 APPLICATIONS DENIED 2 $98,450 0 $0 0 $0 APPLICATIONS WITHDRAWN 2 $64,920 1 $180,470 0 $0 FILES CLOSED FOR INCOMPLETENESS 0 $0 1 $64,000 0 $0
Aggregated Statistics For Year 1999(Based on 2 full and 5 partial tracts) A) Conventional B) Refinancings C) Non-occupant Loans on Number Average Value Number Average Value Number Average Value
LOANS ORIGINATED 115 $76,881 36 $75,890 1 $43,000 APPLICATIONS APPROVED, NOT ACCEPTED 4 $55,698 6 $87,443 0 $0 APPLICATIONS DENIED 3 $95,740 2 $67,030 0 $0 APPLICATIONS WITHDRAWN 1 $27,000 4 $93,388 0 $0 FILES CLOSED FOR INCOMPLETENESS 0 $0 0 $0 0 $0
Detailed PMIC statistics for the following Tracts:
0031.00
, 0032.00 , 0033.00 , 0034.00 , 0035.00 , 0036.00 , 0037.01 Fire-safe hotels and motels in Neenah, Wisconsin:
Days Inn, 495 S Grn Bay Rd, Neenah, Wisconsin 54956 Phone: (920) 720-9020
Best Western Bridgewood Hotel & Conference Center, 1000 Cameron Way, Neenah, Wisconsin 54956 Phone: (920) 720-8000, Fax: (920) 967-0052
DoubleTree by Hilton Neenah, 123 E Wisconsin Ave, Neenah, Wisconsin 54956 Phone: (920) 725-8441, Fax: (920) 725-8441
Cobblestone Hotel and Suites -Appleton International Airport, 1465 Bryce Dr, Neenah, Wisconsin 54956 Phone: (888) 693-8262
All 4 fire-safe hotels and motels in Neenah, Wisconsin
Most common first names in Neenah, WI among deceased individuals Name Count Lived (average)
John 188 76.8 years William 146 76.5 years Robert 142 70.2 years Mary 124 78.5 years Margaret 109 81.5 years Helen 99 81.5 years George 98 77.8 years Dorothy 98 80.9 years Edward 94 78.2 years Richard 82 68.7 years
Most common last names in Neenah, WI among deceased individuals Last name Count Lived (average)
Johnson 76 78.8 years Miller 62 78.3 years Anderson 55 78.4 years Smith 50 78.9 years Schultz 47 80.9 years Olson 37 76.3 years Meyer 35 75.1 years Nelson 34 74.8 years Blank 32 77.9 years Williams 32 82.4 years
Neenah compared to Wisconsin state average:
Unemployed percentage significantly below state average. Black race population percentage below state average. Median age below state average. Length of stay since moving in above state average.
#63 on the list of "Top 101 cities with the most local government spending on highway construction per resident (population 10,000+)"
#76 on the list of "Top 101 cities with the most local government spending on current operations of libraries per resident (population 10,000+)"
#11 on the list of "Top 101 counties with the lowest percentage of residents relocating from foreign countries between 2010 and 2011"
#75 on the list of "Top 101 counties with the largest increase in the number of births per 1000 residents 2000-2006 to 2007-2013 (pop 50,000+)"
Top Patent Applicants
Scott W. Wenzel (64)
Peter F. Ullrich, Jr. (41)
Joseph H. Miller (40)
Bruce Patrick Albrecht (38)
Neil T. Scholl (36)
Kimberly-Clark Worldwide, Inc. (33)
Adrienne Rae Loyd (27)
Michael Alan Hermans (26)
Bo Shi (26)
Thomas Gerard Shannon (25)
Total of 1344 patent applications in 2008-2024.
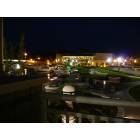

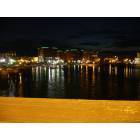
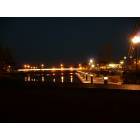
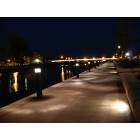
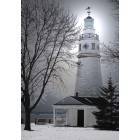
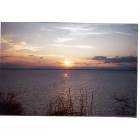
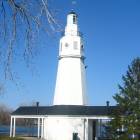
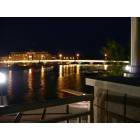
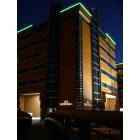
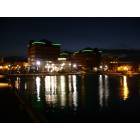
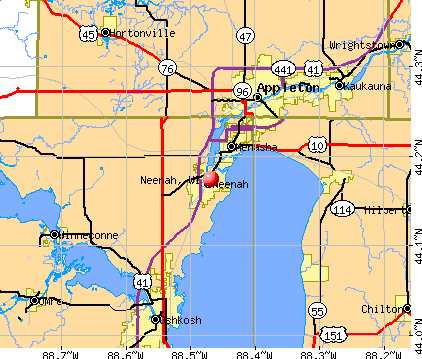


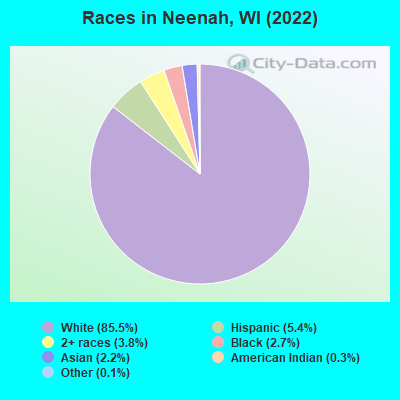
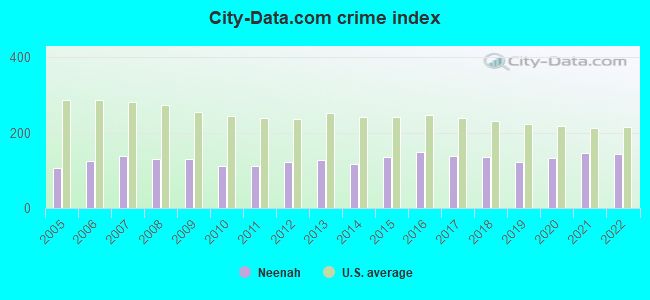
 Recent articles from our blog. Our writers, many of them Ph.D. graduates or candidates, create easy-to-read articles on a wide variety of topics.

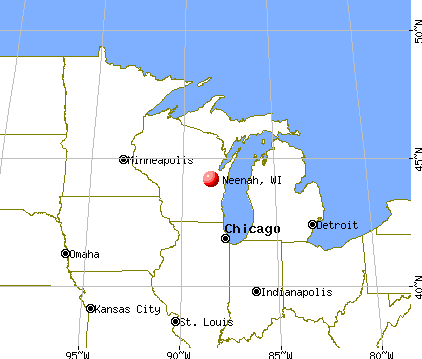
 (7.1 miles
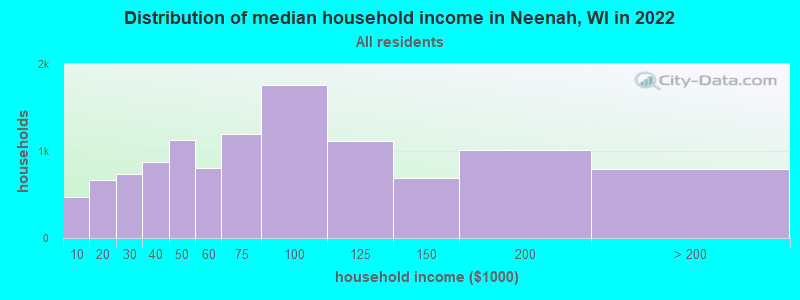
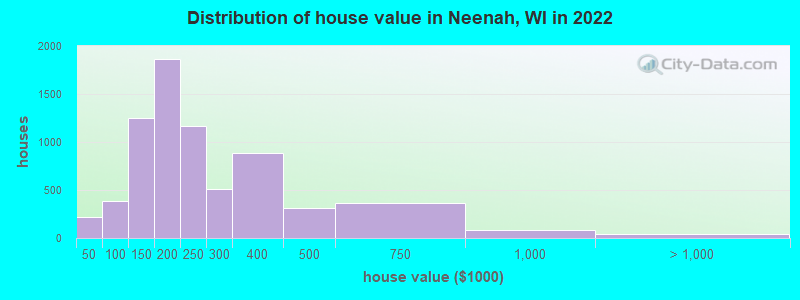

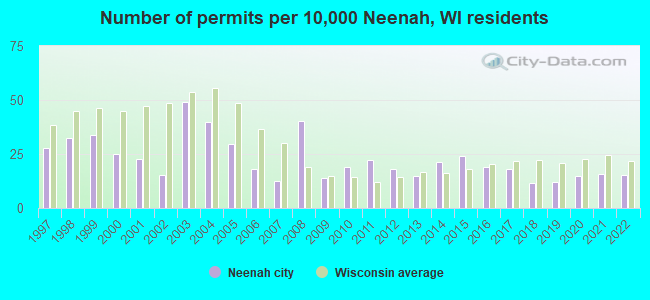
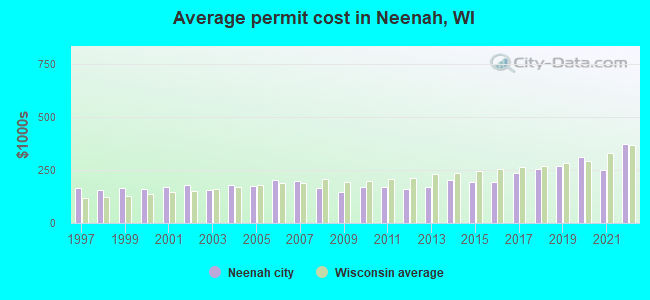
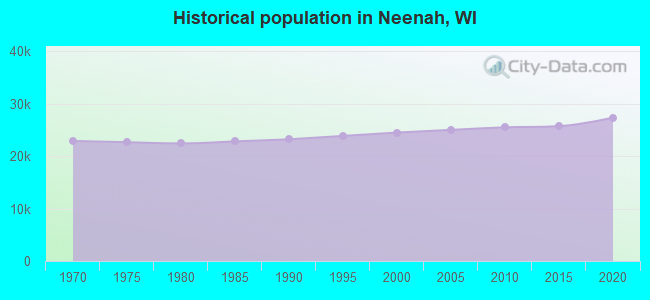
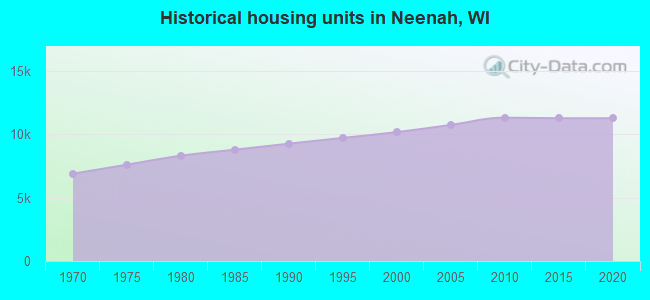
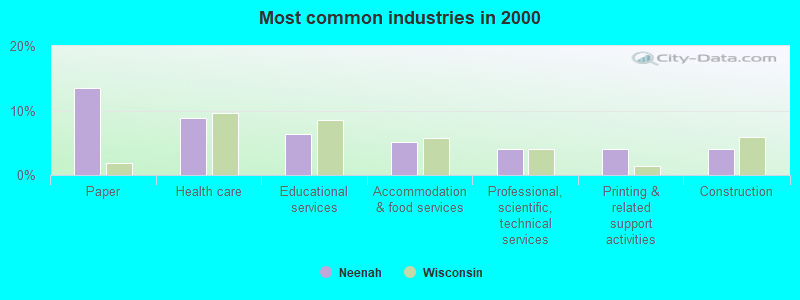
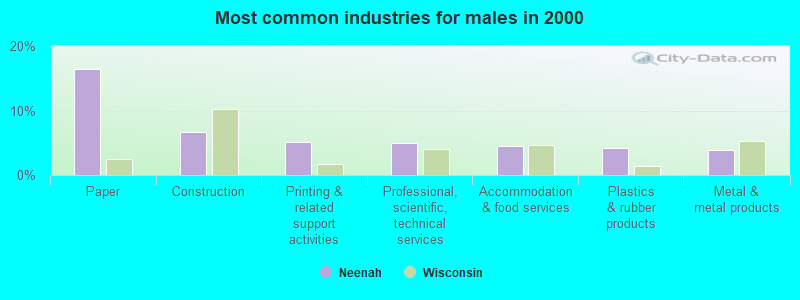
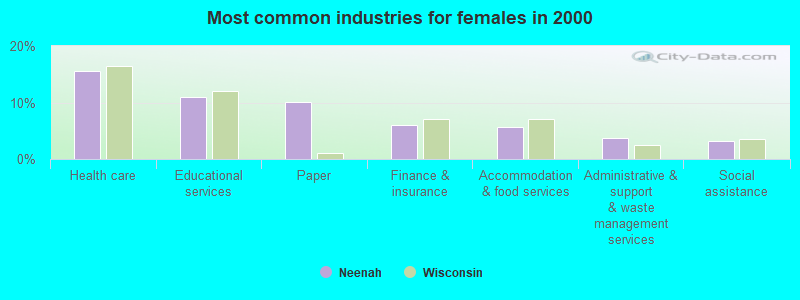
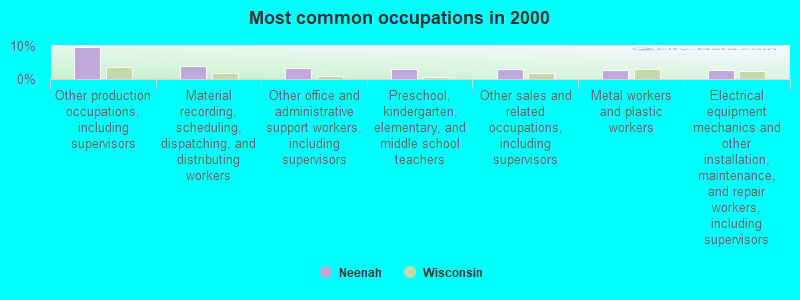
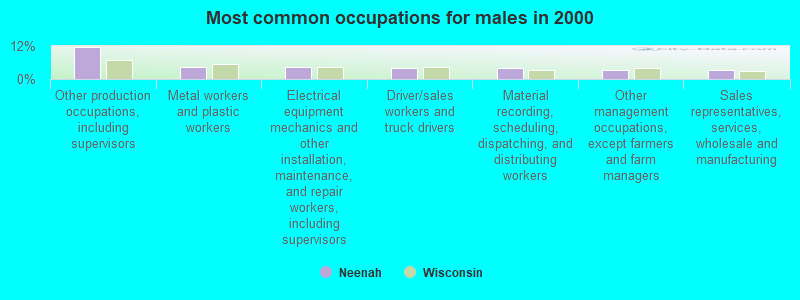
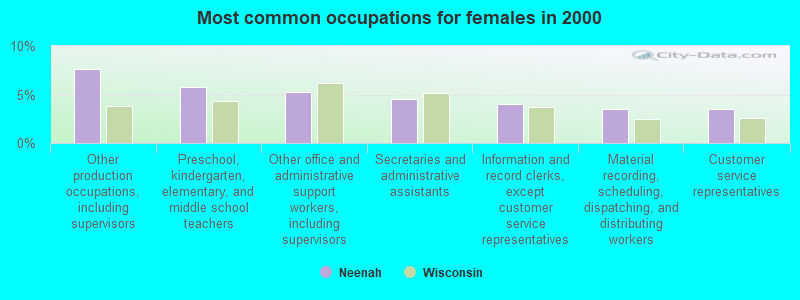


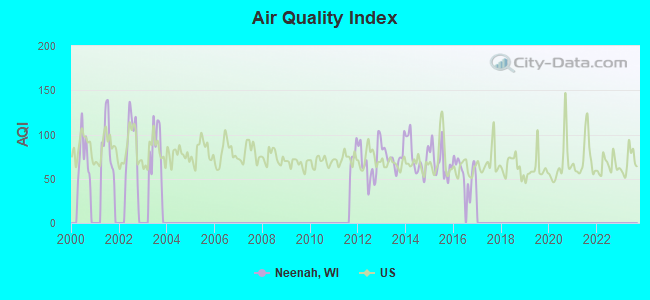
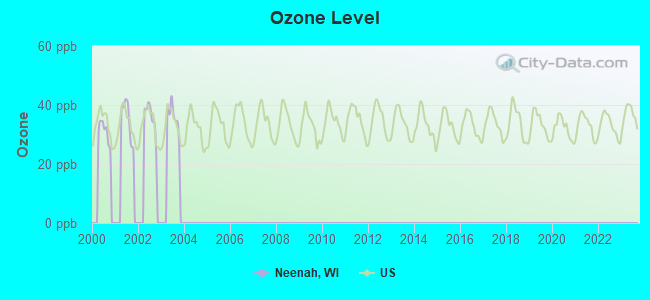
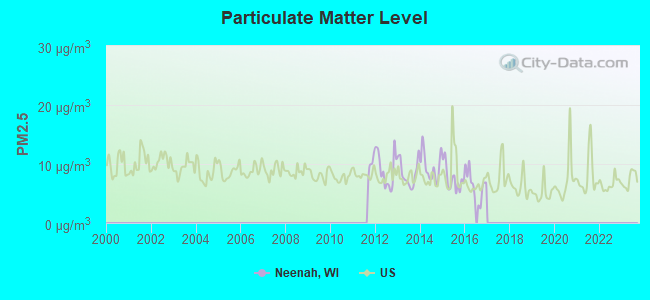
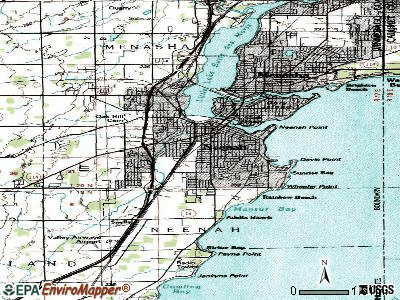
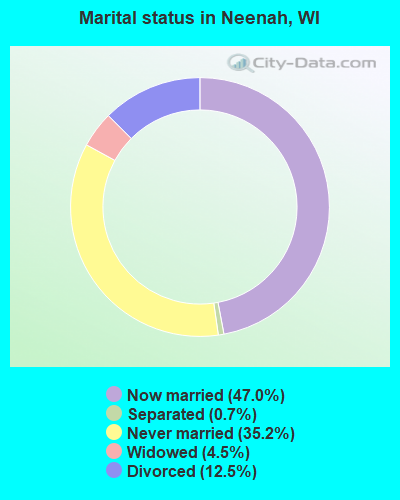
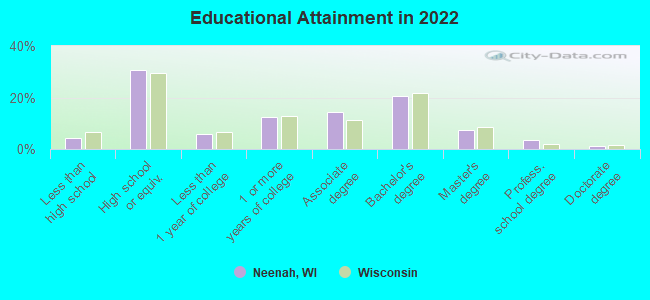
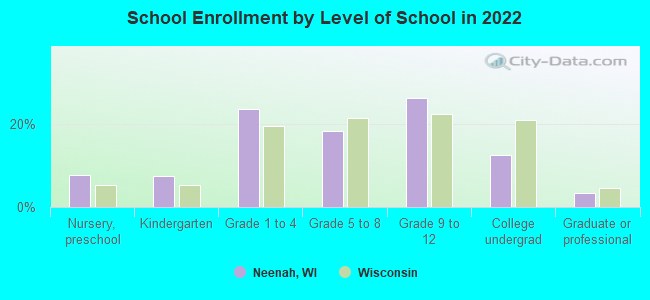
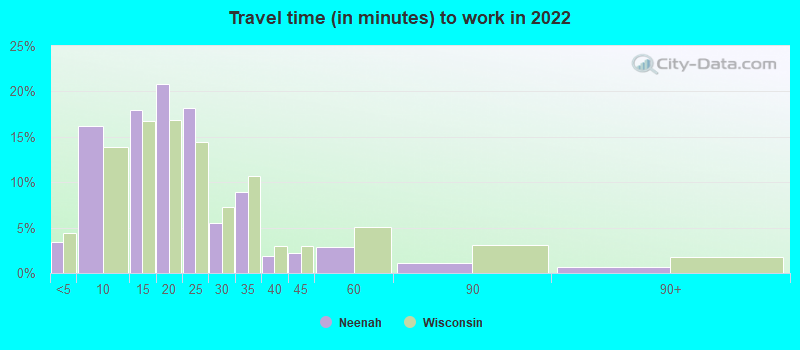
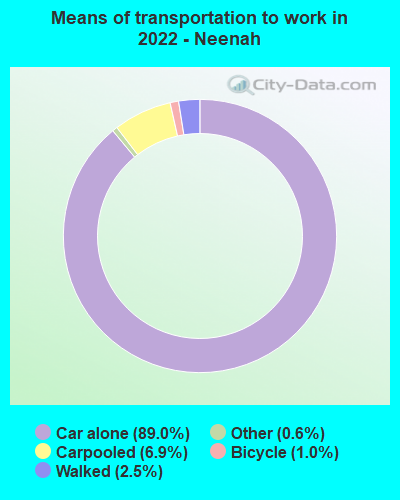
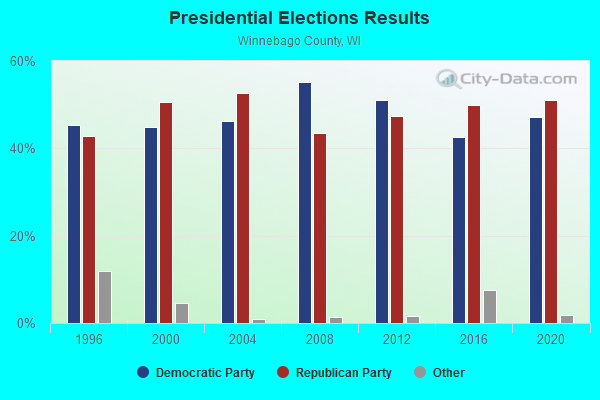
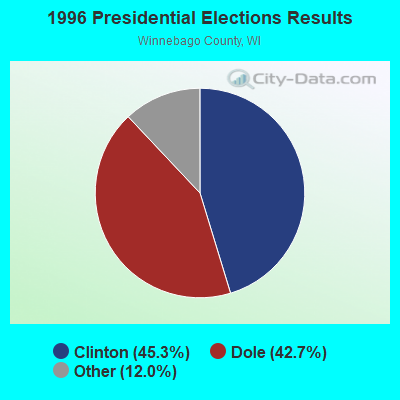
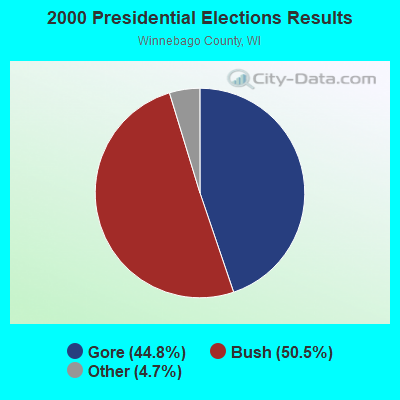
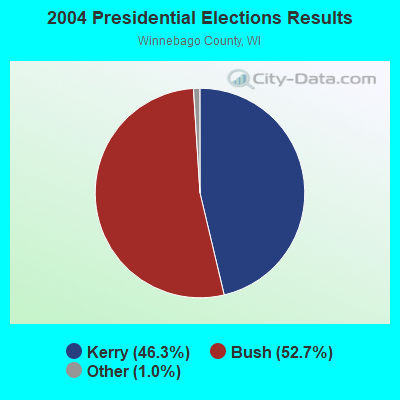
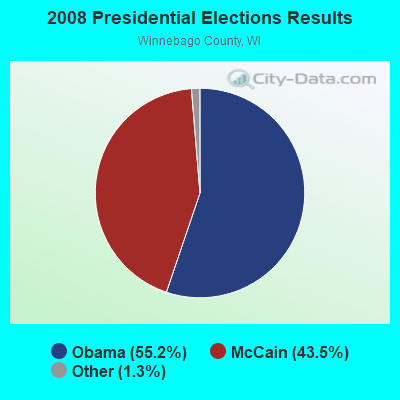
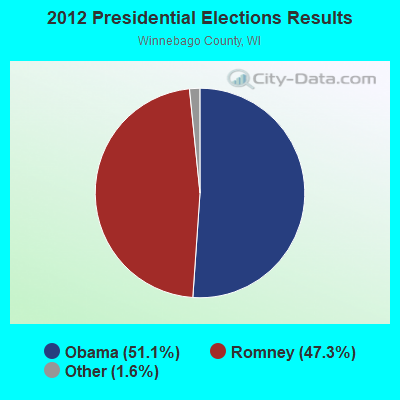
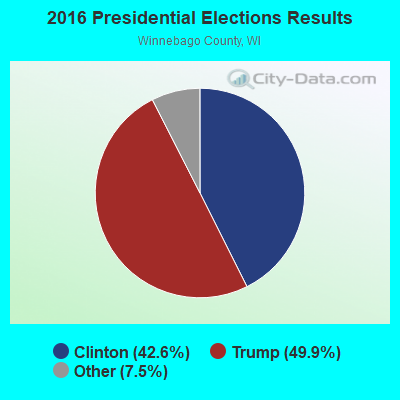
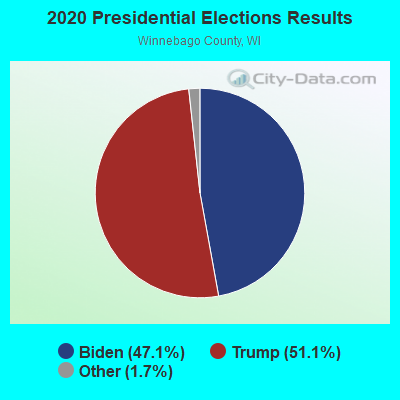
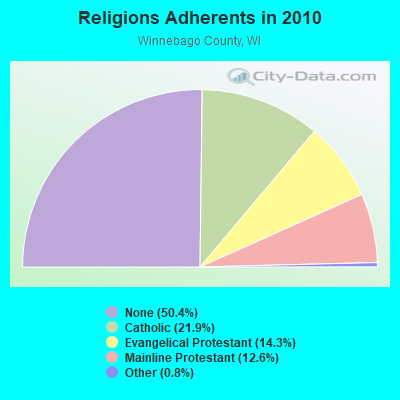
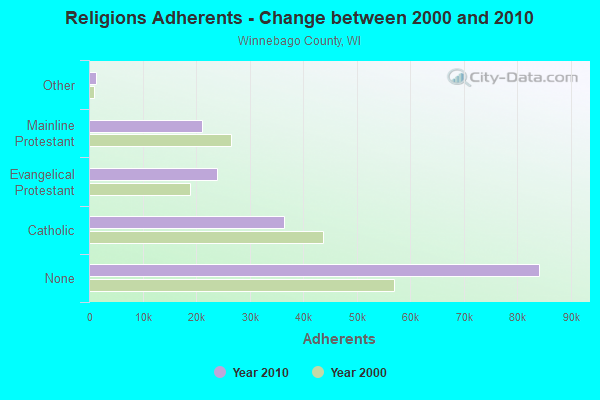
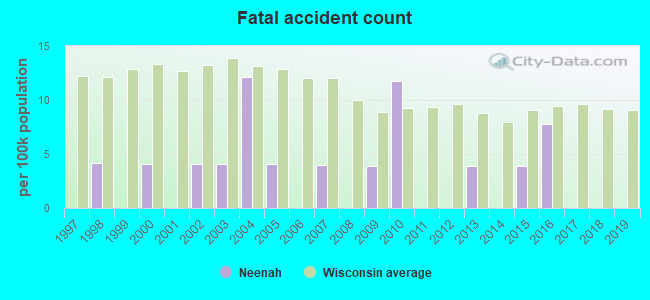
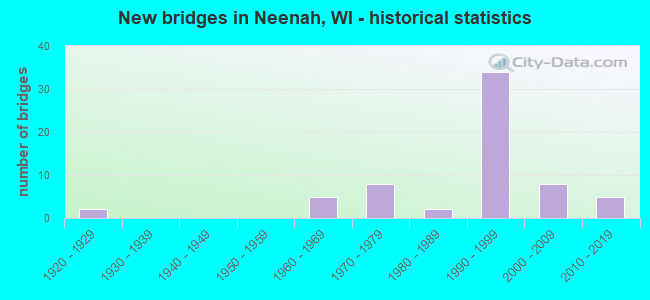
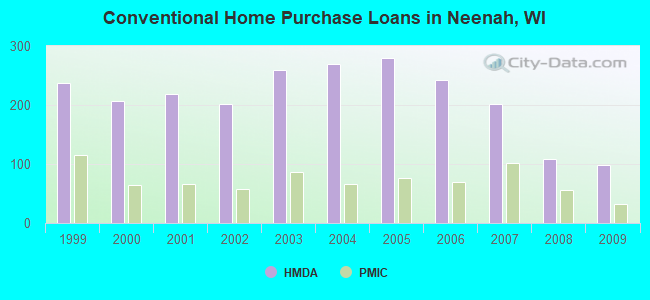
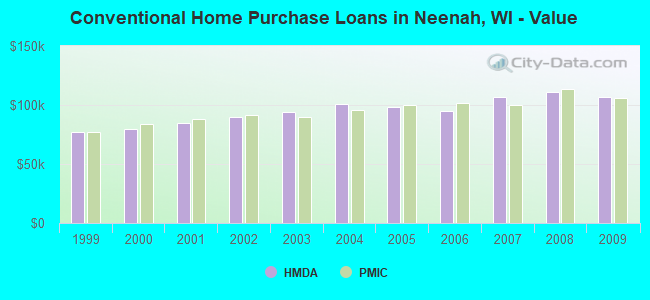
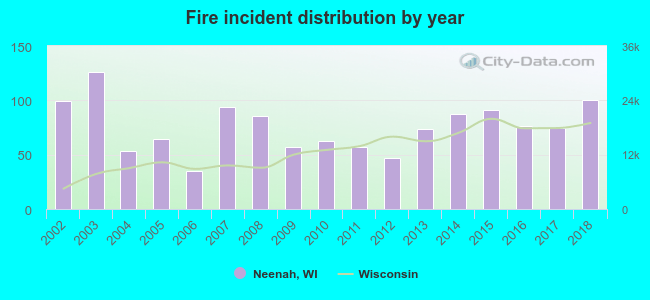 Based on the data from the years 2002 - 2018 the average number of fires per year is 76. The highest number of fires - 126 took place in 2003, and the least - 35 in 2006. The data has an increasing trend.
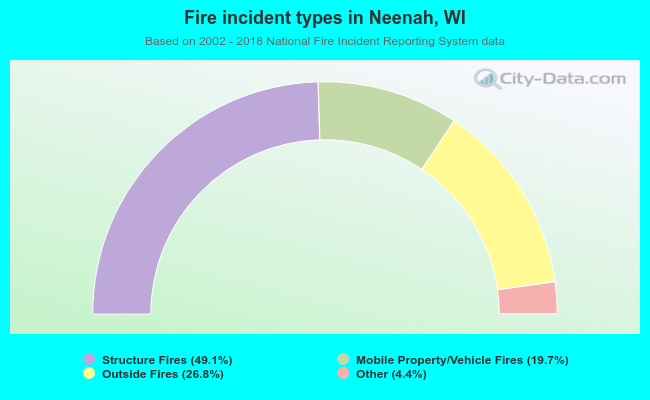 When looking into fire subcategories, the most incidents belonged to: Structure Fires (49.1%), and Outside Fires (26.8%).