Spring Valley, New York
Submit your own pictures of this village and show them to the world
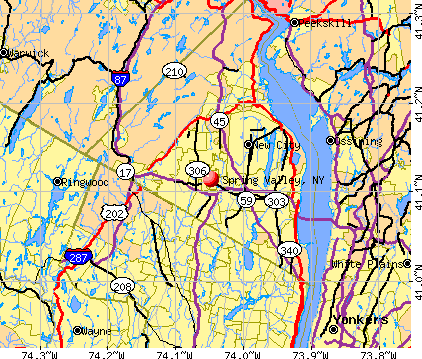
- OSM Map
- General Map
- Google Map
- MSN Map
Population change since 2000: +29.1%
| Males: 16,527 | |
| Females: 16,357 |
| Median resident age: | 27.2 years |
| New York median age: | 40.0 years |
Zip codes: 10977.
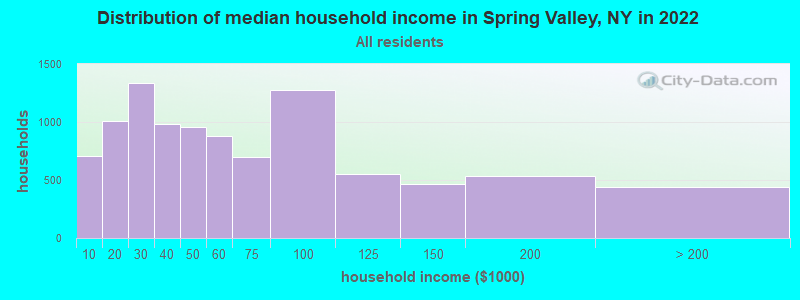
| Spring Valley: | $47,988 |
| NY: | $79,557 |
Estimated per capita income in 2022: $21,454 (it was $14,861 in 2000)
Spring Valley village income, earnings, and wages data
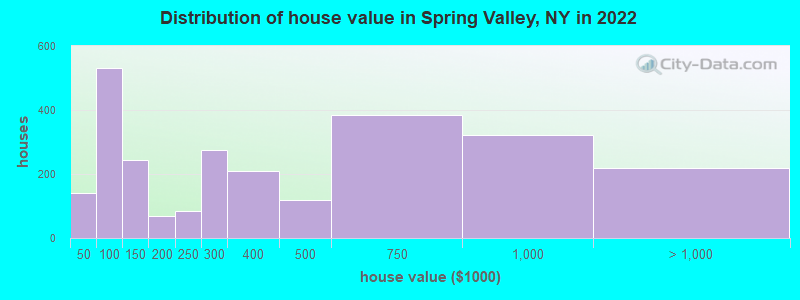
Estimated median house or condo value in 2022: $315,580 (it was $132,700 in 2000)
| Spring Valley: | $315,580 |
| NY: | $400,400 |
Mean prices in 2022: all housing units: $454,382; detached houses: $710,331; townhouses or other attached units: $469,494; in 2-unit structures: $685,420; in 3-to-4-unit structures: $155,826; in 5-or-more-unit structures: $213,363
Median gross rent in 2022: $1,563.
(31.1% for White Non-Hispanic residents, 16.9% for Black residents, 29.9% for Hispanic or Latino residents, 39.6% for other race residents, 9.5% for two or more races residents)
Detailed information about poverty and poor residents in Spring Valley, NY


Compare current foreclosures in Spring Valley, NY:
| Photo | Address | Area | Beds / Baths | Price | Details |
|---|---|---|---|---|---|

|
#1
N Main St Apt C-15
Spring Valley, NY 10977
|
800 sq. feet
|
1 baths 1 beds |
$85,000
|
show details |

|
#2
Clinton Ln
Spring Valley, NY 10977
|
3,137 sq. feet
|
3 baths 6 beds |
show details | |

|
#3
Jennifer Ct
Spring Valley, NY 10977
|
2,144 sq. feet
|
3 baths 5 beds |
show details | |

|
#4
Linden Ave
Spring Valley, NY 10977
|
1,377 sq. feet
|
1 baths 3 beds |
show details | |

|
#5
Carlisle Rd
Spring Valley, NY 10977
|
2,016 sq. feet
|
2 baths 4 beds |
show details | |

|
#6
Ferruzza Dr
Spring Valley, NY 10977
|
2,700 sq. feet
|
3 baths 4 beds |
show details | |

|
#7
Dorset Rd
Spring Valley, NY 10977
|
1,960 sq. feet
|
1 baths 4 beds |
show details | |

|
#8
Fessler Dr
Spring Valley, NY 10977
|
1,940 sq. feet
|
3 baths 4 beds |
show details | |

|
#9
Balmoral Dr
Spring Valley, NY 10977
|
2,856 sq. feet
|
2 baths 5 beds |
show details | |

|
#10
N Pascack Rd
Spring Valley, NY 10977
|
1,498 sq. feet
|
1 baths 3 beds |
show details |
| Photo | Address | Area | Beds / Baths | Price | Details |
|---|---|---|---|---|---|

|
#11
Washington Ave # 2
Spring Valley, NY 10977
|
2,265 sq. feet
|
2 baths 4 beds |
show details | |

|
#12
Washington Ave
Spring Valley, NY 10977
|
5,090 sq. feet
|
4 baths 10 beds |
show details | |

|
#13
Chelsea Ln
Spring Valley, NY 10977
|
1,933 sq. feet
|
3 baths 3 beds |
show details | |

|
#14
Gladys Dr
Spring Valley, NY 10977
|
1,112 sq. feet
|
1 baths 1 beds |
show details | |

|
#15
N Hillside Ave
Spring Valley, NY 10977
|
2,084 sq. feet
|
2 baths 4 beds |
show details | |

|
#16
Ward Ln
Spring Valley, NY 10977
|
1,271 sq. feet
|
2 baths 3 beds |
show details | |

|
#17
Crystal St
Spring Valley, NY 10977
|
1,974 sq. feet
|
2 baths 3 beds |
show details | |

|
#18
Stysly Ln # 102
Spring Valley, NY 10977
|
1,182 sq. feet
|
1 baths 3 beds |
show details | |

|
#19
Slinn Ave
Spring Valley, NY 10977
|
1,602 sq. feet
|
2 baths 4 beds |
show details | |

|
#20
Gerow Ave
Spring Valley, NY 10977
|
2,036 sq. feet
|
3 baths 5 beds |
show details |
| Photo | Address | Area | Beds / Baths | Price | Details |
|---|---|---|---|---|---|

|
#21
Hoyt 101
Spring Valley, NY 10977
|
1,886 sq. feet
|
2 baths 4 beds |
show details | |

|
#22
Merrick Ln
Spring Valley, NY 10977
|
1,613 sq. feet
|
2 baths 3 beds |
show details | |

|
#23
Buena Vista Ave
Spring Valley, NY 10977
|
2,336 sq. feet
|
2 baths 4 beds |
show details | |

|
#24
Dwight Ave
Spring Valley, NY 10977
|
2,281 sq. feet
|
2 baths 4 beds |
show details | |

|
#25
Pleasant Ridge Rd
Spring Valley, NY 10977
|
2,471 sq. feet
|
3 baths 4 beds |
show details | |

|
#26
Gilda Ct
Spring Valley, NY 10977
|
2,323 sq. feet
|
2 baths 4 beds |
show details | |

|
#27
Bedford Ct
Spring Valley, NY 10977
|
2,379 sq. feet
|
2 baths 4 beds |
show details | |

|
#28
Madeline Ter
Spring Valley, NY 10977
|
1,620 sq. feet
|
1 baths 3 beds |
show details | |

|
#29
Creekside Cir
Spring Valley, NY 10977
|
1,380 sq. feet
|
1 baths 3 beds |
show details | |

|
#30
Woodwind Ln
Spring Valley, NY 10977
|
2,497 sq. feet
|
2 baths 4 beds |
show details |
| Photo | Address | Area | Beds / Baths | Price | Details |
|---|---|---|---|---|---|

|
#31
Ross Ave
Spring Valley, NY 10977
|
2,126 sq. feet
|
3 baths 4 beds |
show details | |

|
#32
Rockland Ln
Spring Valley, NY 10977
|
1,902 sq. feet
|
2 baths 4 beds |
show details | |

|
#33
Cheryl St
Spring Valley, NY 10977
|
1,040 sq. feet
|
1 baths 2 beds |
show details | |

|
#34
Mcnamara Rd
Spring Valley, NY 10977
|
1,936 sq. feet
|
2 baths 3 beds |
show details | |

|
#35
N Rigaud Rd
Spring Valley, NY 10977
|
1,600 sq. feet
|
1 baths 4 beds |
show details | |

|
#36
Jacaruso Dr
Spring Valley, NY 10977
|
1,600 sq. feet
|
1 baths 4 beds |
show details | |

|
#37
Sydell Ln
Spring Valley, NY 10977
|
2,211 sq. feet
|
2 baths 3 beds |
show details | |

|
#38
East Ln
Spring Valley, NY 10977
|
1,796 sq. feet
|
2 baths 3 beds |
show details | |

|
#39
Gerow Ave
Spring Valley, NY 10977
|
2,276 sq. feet
|
2 baths 5 beds |
show details | |

|
#40
N Rigaud 101
Spring Valley, NY 10977
|
1,894 sq. feet
|
2 baths 3 beds |
show details |
| Photo | Address | Area | Beds / Baths | Price | Details |
|---|---|---|---|---|---|

|
#41
Stysly 102
Spring Valley, NY 10977
|
1,182 sq. feet
|
1 baths 3 beds |
show details | |

|
#42
Dorothy Dr
Spring Valley, NY 10977
|
1,834 sq. feet
|
1 baths 4 beds |
show details | |

|
#43
Danville Rd
Spring Valley, NY 10977
|
2,050 sq. feet
|
1 baths 5 beds |
show details | |

|
#44
Manchester Dr
Spring Valley, NY 10977
|
3,594 sq. feet
|
4 baths 4 beds |
show details | |

|
#45
Westview Rd
Spring Valley, NY 10977
|
2,160 sq. feet
|
2 baths 3 beds |
show details | |

|
#46
Pennington Way
Spring Valley, NY 10977
|
2,040 sq. feet
|
2 baths 4 beds |
show details | |

|
#47
N Rigaud Rd # 101
Spring Valley, NY 10977
|
1,894 sq. feet
|
2 baths 3 beds |
show details | |

|
#48
Mallory Rd
Spring Valley, NY 10977
|
1,628 sq. feet
|
1 baths 3 beds |
show details | |

|
#49
Widman Ct Unit 3
Spring Valley, NY 10977
|
2,433 sq. feet
|
3 baths 5 beds |
show details | |

|
Check over 1 million property listings on Foreclosure.com!
|
browse all offers | |||


- 11,33334.2%White alone
- 10,12130.6%Black alone
- 10,12130.6%Hispanic
- 8922.7%Asian alone
- 3261.0%Two or more races
- 2910.9%Other race alone
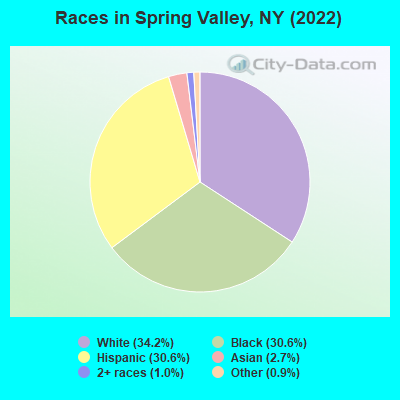
Races in Spring Valley detailed stats: ancestries, foreign born residents, place of birth
According to our research of New York and other state lists, there were 11 registered sex offenders living in Spring Valley, New York as of May 21, 2024.
The ratio of all residents to sex offenders in Spring Valley is 2,985 to 1.
The ratio of registered sex offenders to all residents in this city is much lower than the state average.
Type |
2009 |
2010 |
2011 |
2012 |
2013 |
2014 |
2015 |
2016 |
2017 |
2018 |
2019 |
2020 |
2021 |
2022 |
|---|---|---|---|---|---|---|---|---|---|---|---|---|---|---|
| Murders (per 100,000) | 0 (0.0) | 1 (3.2) | 0 (0.0) | 0 (0.0) | 2 (6.2) | 0 (0.0) | 1 (3.0) | 1 (3.0) | 0 (0.0) | 0 (0.0) | 1 (3.1) | 2 (6.2) | 3 (9.3) | 2 (6.1) |
| Rapes (per 100,000) | 5 (19.0) | 4 (12.8) | 10 (31.8) | 7 (22.0) | 9 (27.9) | 10 (30.7) | 17 (51.8) | 14 (42.6) | 28 (85.4) | 24 (72.9) | 15 (46.3) | 11 (34.0) | 8 (24.7) | 9 (27.2) |
| Robberies (per 100,000) | 56 (212.6) | 43 (137.2) | 59 (187.4) | 65 (203.9) | 34 (105.3) | 38 (116.6) | 45 (137.2) | 39 (118.7) | 30 (91.5) | 36 (109.4) | 38 (117.4) | 25 (77.3) | 13 (40.2) | 37 (112.0) |
| Assaults (per 100,000) | 107 (406.2) | 91 (290.3) | 91 (289.0) | 137 (429.8) | 87 (269.4) | 85 (260.8) | 93 (283.6) | 71 (216.2) | 75 (228.7) | 60 (182.3) | 61 (188.5) | 64 (197.8) | 74 (228.8) | 63 (190.7) |
| Burglaries (per 100,000) | 80 (303.7) | 106 (338.2) | 80 (254.1) | 91 (285.5) | 53 (164.1) | 77 (236.3) | 32 (97.6) | 37 (112.7) | 35 (106.7) | 29 (88.1) | 40 (123.6) | 41 (126.7) | 24 (74.2) | 33 (99.9) |
| Thefts (per 100,000) | 361 (1,371) | 491 (1,566) | 375 (1,191) | 376 (1,180) | 335 (1,038) | 303 (929.8) | 325 (991.0) | 336 (1,023) | 340 (1,037) | 364 (1,106) | 380 (1,174) | 294 (908.6) | 228 (705.0) | 503 (1,522) |
| Auto thefts (per 100,000) | 22 (83.5) | 26 (82.9) | 22 (69.9) | 30 (94.1) | 16 (49.6) | 11 (33.8) | 11 (33.5) | 13 (39.6) | 15 (45.7) | 10 (30.4) | 5 (15.4) | 13 (40.2) | 12 (37.1) | 9 (27.2) |
| Arson (per 100,000) | 4 (15.2) | 0 (0.0) | 1 (3.2) | 2 (6.3) | 1 (3.1) | 4 (12.3) | 1 (3.0) | 1 (3.0) | 2 (6.1) | 1 (3.0) | 2 (6.2) | 2 (6.2) | 3 (9.3) | 5 (15.1) |
| City-Data.com crime index | 243.0 | 208.8 | 210.4 | 239.4 | 177.1 | 168.1 | 194.6 | 171.0 | 194.1 | 180.5 | 173.0 | 150.7 | 132.5 | 175.7 |
The City-Data.com crime index weighs serious crimes and violent crimes more heavily. Higher means more crime, U.S. average is 246.1. It adjusts for the number of visitors and daily workers commuting into cities.
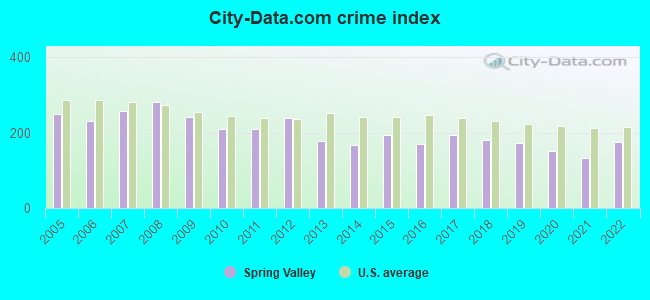
Crime rate in Spring Valley detailed stats: murders, rapes, robberies, assaults, burglaries, thefts, arson
Full-time law enforcement employees in 2021, including police officers: 65 (57 officers - 51 male; 6 female).
| Officers per 1,000 residents here: | 1.76 |
| New York average: | 3.28 |
 Recent articles from our blog. Our writers, many of them Ph.D. graduates or candidates, create easy-to-read articles on a wide variety of topics.


Latest news from Spring Valley, NY collected exclusively by city-data.com from local newspapers, TV, and radio stations
Ancestries: Haitian (26.2%), American (12.2%), Hungarian (8.3%), Polish (4.0%), European (3.0%), Jamaican (1.7%).
Current Local Time: EST time zone
Land area: 2.10 square miles.
Population density: 15,655 people per square mile (very high).
11,768 residents are foreign born (28.5% Latin America, 3.8% Europe).
| This village: | 35.5% |
| New York: | 22.6% |
Median real estate property taxes paid for housing units with mortgages in 2022: $8,797 (2.2%)
Median real estate property taxes paid for housing units with no mortgage in 2022: $7,319 (2.7%)
Nearest city with pop. 50,000+: Ramapo, NY  (1.9 miles , pop. 108,905).
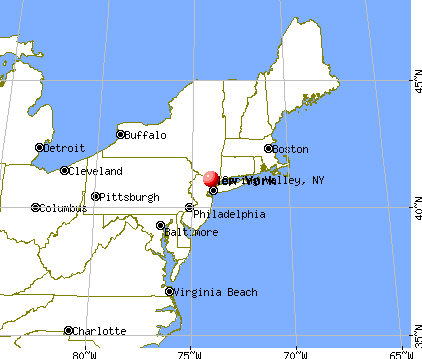
Nearest city with pop. 200,000+: Bronx, NY (20.6 miles , pop. 1,332,650).
Nearest cities:
), ), ), ), )Latitude: 41.11 N, Longitude: 74.05 W
Daytime population change due to commuting: -3,667 (-11.1%)
Workers who live and work in this village: 3,236 (23.9%)
Area codes: 845, 914
Spring Valley, New York accommodation & food services, waste management - Economy and Business Data
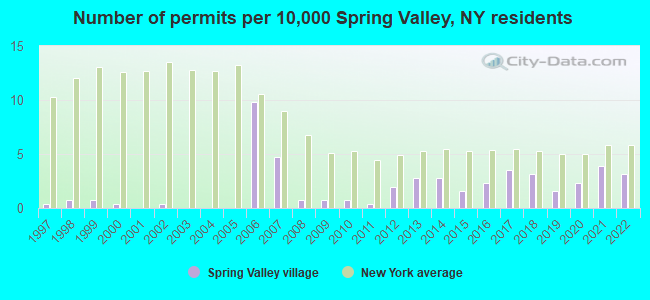
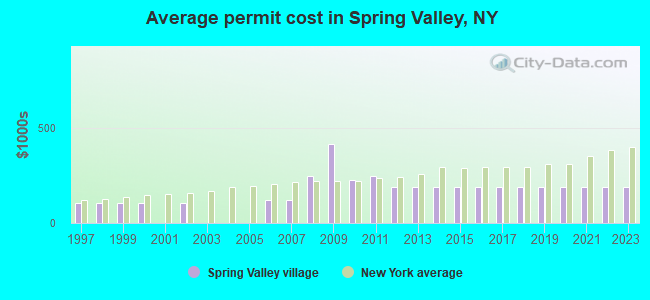
Single-family new house construction building permits:
- 2022: 8 buildings, average cost: $192,200
- 2021: 10 buildings, average cost: $192,200
- 2020: 6 buildings, average cost: $192,200
- 2019: 4 buildings, average cost: $192,200
- 2018: 8 buildings, average cost: $192,200
- 2017: 9 buildings, average cost: $192,200
- 2016: 6 buildings, average cost: $192,200
- 2015: 4 buildings, average cost: $192,200
- 2014: 7 buildings, average cost: $192,200
- 2013: 7 buildings, average cost: $192,200
- 2012: 5 buildings, average cost: $192,200
- 2011: 1 building, cost: $250,000
- 2010: 2 buildings, average cost: $225,000
- 2009: 2 buildings, average cost: $415,500
- 2008: 2 buildings, average cost: $250,000
- 2007: 12 buildings, average cost: $118,800
- 2006: 25 buildings, average cost: $118,800
- 2002: 1 building, cost: $107,200
- 2000: 1 building, cost: $107,200
- 1999: 2 buildings, average cost: $107,200
- 1998: 2 buildings, average cost: $107,200
- 1997: 1 building, cost: $107,200
| Here: | 3.1% |
| New York: | 4.4% |
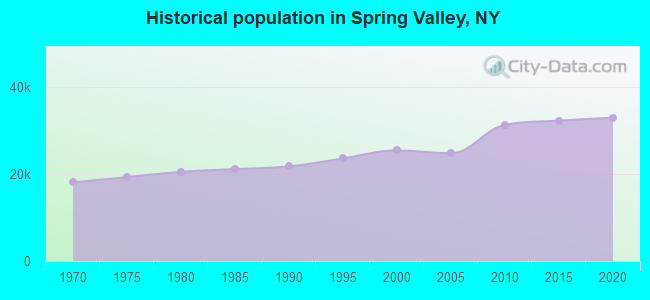
Population change in the 1990s: +3,918 (+18.2%).
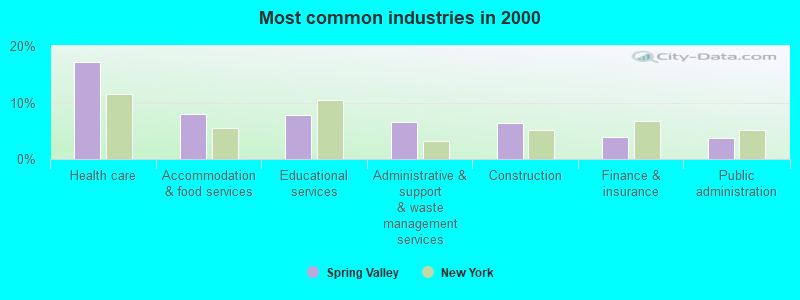
- Health care (17.2%)
- Accommodation & food services (7.9%)
- Educational services (7.7%)
- Administrative & support & waste management services (6.6%)
- Construction (6.4%)
- Finance & insurance (3.9%)
- Public administration (3.8%)
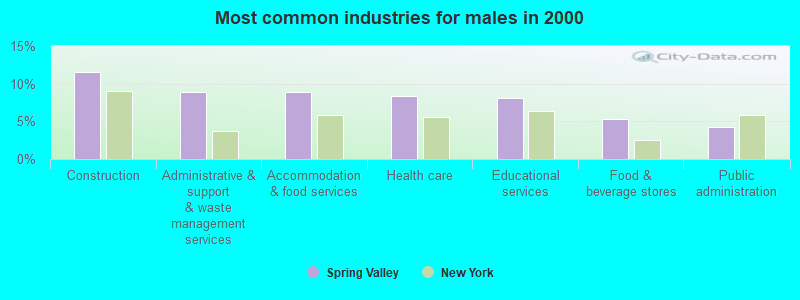
- Construction (11.6%)
- Administrative & support & waste management services (9.0%)
- Accommodation & food services (8.9%)
- Health care (8.3%)
- Educational services (8.1%)
- Food & beverage stores (5.3%)
- Public administration (4.2%)
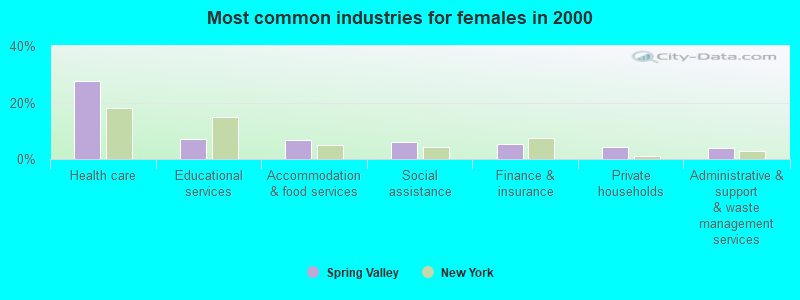
- Health care (27.4%)
- Educational services (7.2%)
- Accommodation & food services (6.8%)
- Social assistance (5.9%)
- Finance & insurance (5.2%)
- Private households (4.2%)
- Administrative & support & waste management services (3.9%)
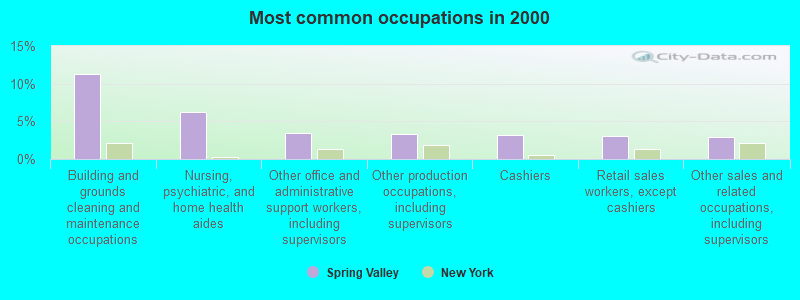
- Building and grounds cleaning and maintenance occupations (11.3%)
- Nursing, psychiatric, and home health aides (6.2%)
- Other office and administrative support workers, including supervisors (3.5%)
- Other production occupations, including supervisors (3.3%)
- Cashiers (3.1%)
- Retail sales workers, except cashiers (3.1%)
- Other sales and related occupations, including supervisors (3.0%)
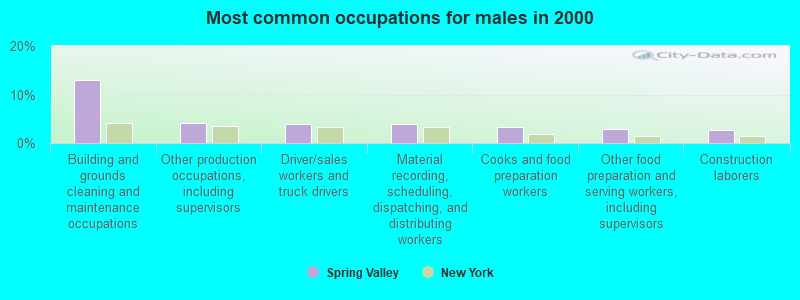
- Building and grounds cleaning and maintenance occupations (13.0%)
- Other production occupations, including supervisors (4.2%)
- Driver/sales workers and truck drivers (3.9%)
- Material recording, scheduling, dispatching, and distributing workers (3.8%)
- Cooks and food preparation workers (3.4%)
- Other food preparation and serving workers, including supervisors (2.8%)
- Construction laborers (2.6%)
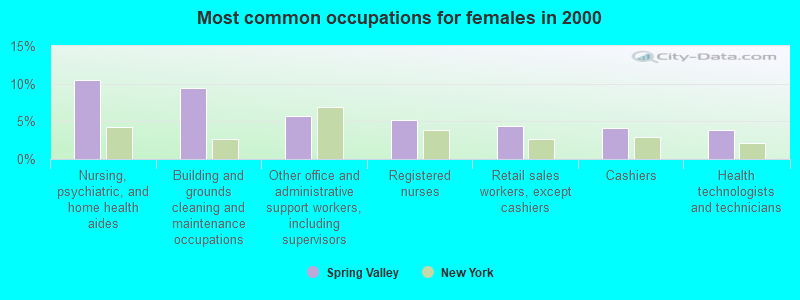
- Nursing, psychiatric, and home health aides (10.5%)
- Building and grounds cleaning and maintenance occupations (9.5%)
- Other office and administrative support workers, including supervisors (5.7%)
- Registered nurses (5.1%)
- Retail sales workers, except cashiers (4.3%)
- Cashiers (4.2%)
- Health technologists and technicians (3.8%)
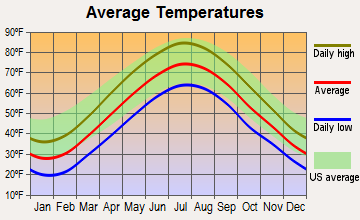
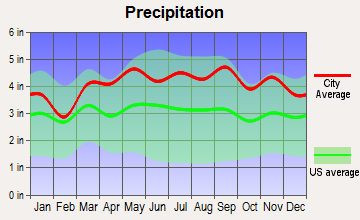
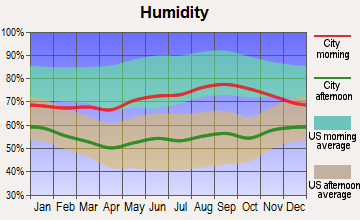
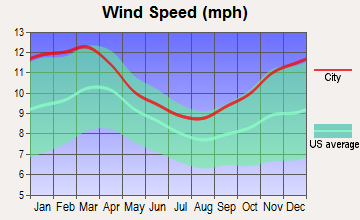
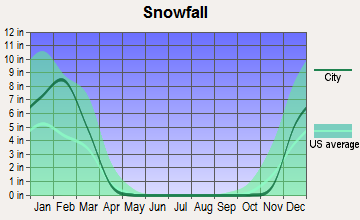
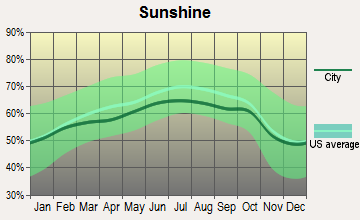
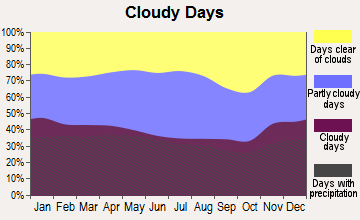
Average climate in Spring Valley, New York
Based on data reported by over 4,000 weather stations
|
|

(lower is better)
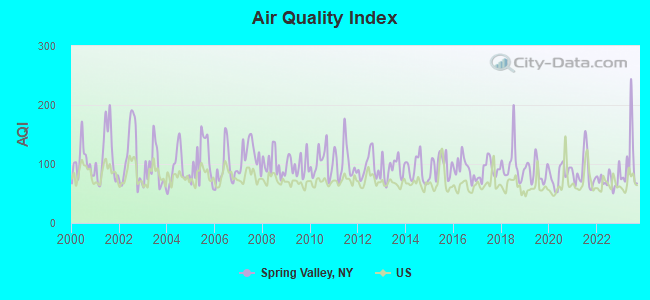
Air Quality Index (AQI) level in 2023 was 103. This is significantly worse than average.
| City: | 103 |
| U.S.: | 73 |
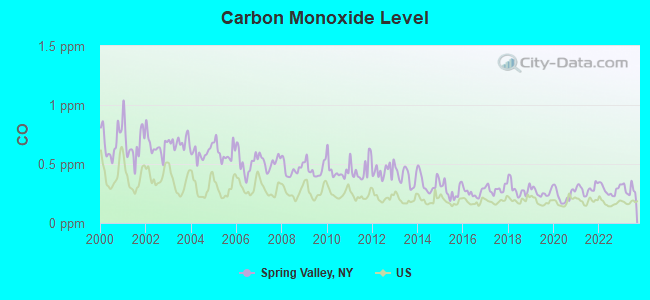
Carbon Monoxide (CO) [ppm] level in 2023 was 0.287. This is about average. Closest monitor was 14.0 miles away from the city center.
| City: | 0.287 |
| U.S.: | 0.251 |
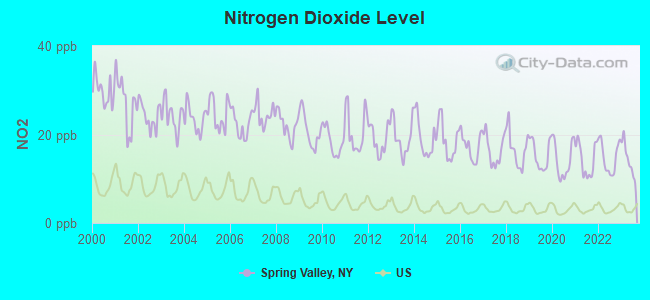
Nitrogen Dioxide (NO2) [ppb] level in 2023 was 14.4. This is significantly worse than average. Closest monitor was 12.5 miles away from the city center.
| City: | 14.4 |
| U.S.: | 5.1 |
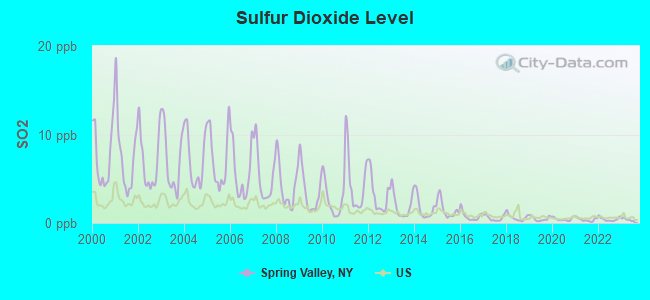
Sulfur Dioxide (SO2) [ppb] level in 2023 was 0.395. This is significantly better than average. Closest monitor was 3.8 miles away from the city center.
| City: | 0.395 |
| U.S.: | 1.515 |
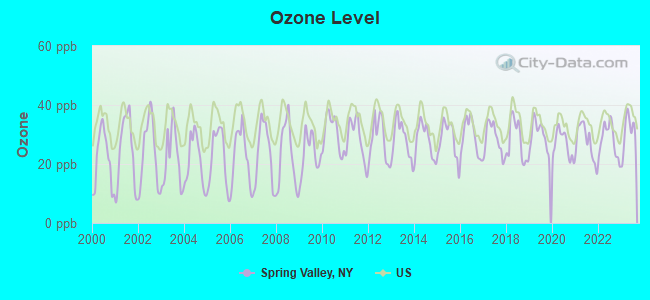
Ozone [ppb] level in 2023 was 30.8. This is about average. Closest monitor was 4.8 miles away from the city center.
| City: | 30.8 |
| U.S.: | 33.3 |
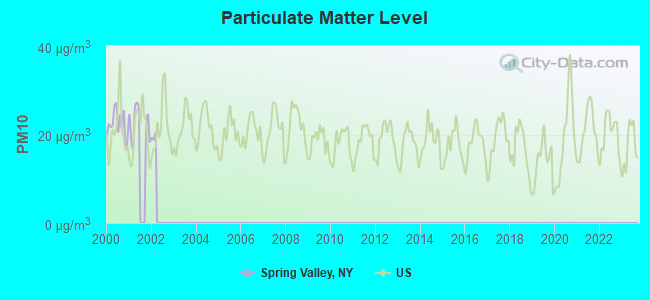
Particulate Matter (PM10) [µg/m3] level in 2001 was 22.6. This is about average. Closest monitor was 5.7 miles away from the city center.
| City: | 22.6 |
| U.S.: | 19.2 |
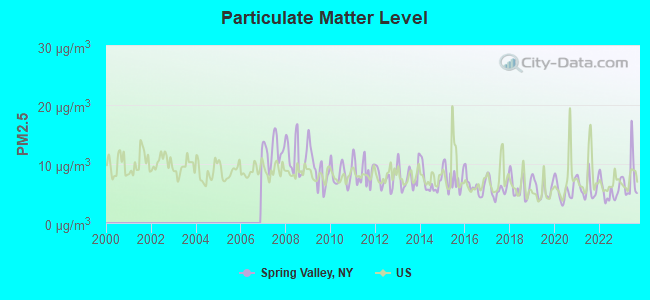
Particulate Matter (PM2.5) [µg/m3] level in 2023 was 7.52. This is about average. Closest monitor was 14.9 miles away from the city center.
| City: | 7.52 |
| U.S.: | 8.11 |
Tornado activity:
Spring Valley-area historical tornado activity is above New York state average. It is 35% smaller than the overall U.S. average.
On 7/14/1988, a category F3 (max. wind speeds 158-206 mph) tornado 26.5 miles away from the Spring Valley village center injured one person and caused between $500,000 and $5,000,000 in damages.
On 5/28/1973, a category F3 tornado 32.1 miles away from the village center caused between $50,000 and $500,000 in damages.
Earthquake activity:
Spring Valley-area historical earthquake activity is significantly above New York state average. It is 68% smaller than the overall U.S. average.On 10/7/1983 at 10:18:46, a magnitude 5.3 (5.1 MB, 5.3 LG, 5.1 ML, Class: Moderate, Intensity: VI - VII) earthquake occurred 196.9 miles away from Spring Valley center
On 8/23/2011 at 17:51:04, a magnitude 5.8 (5.8 MW, Depth: 3.7 mi) earthquake occurred 303.6 miles away from the city center
On 4/20/2002 at 10:50:47, a magnitude 5.3 (5.3 ML, Depth: 3.0 mi) earthquake occurred 235.7 miles away from the city center
On 4/20/2002 at 10:50:47, a magnitude 5.2 (5.2 MB, 4.2 MS, 5.2 MW, 5.0 MW) earthquake occurred 233.9 miles away from Spring Valley center
On 1/16/1994 at 01:49:16, a magnitude 4.6 (4.6 MB, 4.6 LG, Depth: 3.1 mi, Class: Light, Intensity: IV - V) earthquake occurred 117.5 miles away from the city center
On 1/19/1982 at 00:14:42, a magnitude 4.7 (4.5 MB, 4.7 MD, 4.5 LG) earthquake occurred 207.1 miles away from Spring Valley center
Magnitude types: regional Lg-wave magnitude (LG), body-wave magnitude (MB), duration magnitude (MD), local magnitude (ML), surface-wave magnitude (MS), moment magnitude (MW)
Natural disasters:
The number of natural disasters in Rockland County (23) is greater than the US average (15).Major Disasters (Presidential) Declared: 14
Emergencies Declared: 8
Causes of natural disasters: Hurricanes: 7, Floods: 6, Storms: 6, Blizzards: 2, Heavy Rains: 2, Tropical Storms: 2, Landslide: 1, Power Outage: 1, Snowstorm: 1, Water Shortage: 1, Other: 3 (Note: some incidents may be assigned to more than one category).
Hospitals and medical centers in Spring Valley:
- REVIVAL HOME HEALTH CLOSED (235 NORTH MAIN STRRET)
- PINE VALLEY CENTER FOR REHAB AND NURSING (661 N MAIN ST)
Other hospitals and medical centers near Spring Valley:
- JAWONIO, INC. (Hospital, about 2 miles away; WESLEY HILLS, NY)
- JAWONIO, INC. (Hospital, about 2 miles away; MONSEY, NY)
- NORTHERN MANOR GERIATRIC CTR INC (Nursing Home, about 2 miles away; NANUET, NY)
- CAMP VENTURE, INC (Hospital, about 3 miles away; MONSEY, NY)
- CAMP VENTURE, INC (Hospital, about 3 miles away; NANUET, NY)
- NORTHERN METROPOLITAN R H C F INC (Nursing Home, about 3 miles away; MONSEY, NY)
- FRIEDWALD CENTER FOR REHAB AND NURSING L L C (Nursing Home, about 3 miles away; NEW CITY, NY)
Amtrak stations near Spring Valley:
- 11 miles: CROTON-HARMON (CROTON-ON-HUDSON, CROTON POINT AVE.) . Services: partially wheelchair accessible, enclosed waiting area, public restrooms, public payphones, snack bar, paid short-term parking, paid long-term parking, call for car rental service, call for taxi service, public transit connection.
- 15 miles: YONKERS (FOOT OF DOCK ST. & WELLS AVE.) . Services: fully wheelchair accessible, enclosed waiting area, public restrooms, public payphones, snack bar, paid short-term parking, paid long-term parking, call for car rental service, taxi stand, public transit connection.
- 20 miles: NEW ROCHELLE (DEPOT PLAZA NORTH) . Services: enclosed waiting area, public restrooms, public payphones, paid short-term parking, paid long-term parking, call for car rental service, taxi stand, public transit connection.
Operable nuclear power plants near Spring Valley:
- 12 miles: Indian Point 2 and 3 in Buchanan, NY.
College/University in Spring Valley:
Colleges/universities with over 2000 students nearest to Spring Valley:
- Rockland Community College (about 3 miles; Suffern, NY; Full-time enrollment: 6,026)
- Nyack College (about 7 miles; Nyack, NY; FT enrollment: 2,590)
- Ramapo College of New Jersey (about 9 miles; Mahwah, NJ; FT enrollment: 5,864)
- Mercy College (about 12 miles; Dobbs Ferry, NY; FT enrollment: 8,602)
- Bergen Community College (about 12 miles; Paramus, NJ; FT enrollment: 11,826)
- SUNY Westchester Community College (about 14 miles; Valhalla, NY; FT enrollment: 10,278)
- William Paterson University of New Jersey (about 15 miles; Wayne, NJ; FT enrollment: 10,198)
Public high schools in Spring Valley:
- RAMAPO HIGH SCHOOL (Students: 1,478, Location: 400 VIOLA RD, Grades: 9-12)
- SPRING VALLEY HIGH SCHOOL (Students: 1,110, Location: 361 RT 59, Grades: 9-12)
Private high schools in Spring Valley:
- UNITED TALMUDICAL ACADEMY (Students: 1,699, Location: 89 S MAIN ST, Grades: KG-12)
- CONGREGATION BAIS MALKA (Students: 486, Location: 40 GRANDVIEW AVE, Grades: KG-12, Girls only)
- BNOS ESTHER PUPA (Students: 379, Location: 246 N MAIN ST, Grades: PK-12, Girls only)
- YESHIVA DEGAL HATORAH (Students: 272, Location: 111 MAPLE AVE, Grades: PK-12, Boys only)
- BAIS YAAKOV D'RAV HIRSCH (Students: 165, Location: 235 N MAIN ST STE 5, Grades: 9-12, Girls only)
- SHAAREI ARAZIM OF MONSEY (Students: 76, Location: 52 S MAIN ST, Grades: 9-12, Boys only)
- YESHIVA ZICHRON YAAKOV (Students: 40, Location: 720 UNION RD, Grades: 9-12, Boys only)
Public elementary/middle schools in Spring Valley:
- HEMPSTEAD ELEMENTARY SCHOOL (Students: 444, Location: 80 BRICK CHURCH RD, Grades: KG-6)
- KAKIAT ELEMENTARY SCHOOL (Students: 354, Location: 465 VIOLA RD, Grades: 4-6)
Private elementary/middle schools in Spring Valley:
- BAS MIKROH GIRLS SCHOOL (Students: 354, Location: 381 VIOLA RD, Grades: PK-8, Girls only)
- CHEDER CHABAD OF MONSEY (Students: 300, Location: 246 N MAIN ST, Grades: PK-8)
- TALMUD TORAH OF BOBOV (Students: 298, Location: 49 S MAIN ST, Grades: PK-8, Boys only)
- TALMUD TORAH KHAL ADAS YEREIM (Students: 260, Location: 33 UNION RD, Grades: PK-8, Boys only)
- BNEI YAKOV YOSEF OF MONSEY (Students: 142, Location: 23 UNION RD, Grades: PK-4, Boys only)
- TORAS EMACHU (Students: 118, Location: 246 N MAIN ST, Grades: PK-4, Girls only)
- THE SKILL BUILDING CENTER (Students: 30, Location: 15 WIDMAN CT, Grades: KG-6)
- YESHIVA TZOIN YOSEF (Students: 13, Location: 4 WIDMAN CT, Grades: PK-3, Boys only)
- HOME ROOM LEARNING CENTER (Students: 9, Location: 27 FLINT DR, Grades: PK-5)
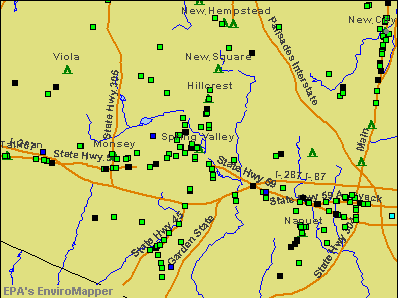
Points of interest:
Notable locations in Spring Valley: Spring Valley Fire Department Columbian Engine Company 1 (A), Finkelstein Memorial Library (B), Rockland Hook and Ladder Company (C), Cullens Hotel (D), Spring Valley Hook and Ladder Company (E), Senate Hotel (F), Spring Valley Municipal Building (G), The Holocaust Museum and Study Center (H), Evergreen Court Home for Adults Assisted Living Center (I), Golden Acres Home for Adults Assisted Living Center (J). Display/hide their locations on the map
Shopping Center: Spring Valley Marketplace Shopping Center (1). Display/hide its location on the map
Churches in Spring Valley include: New Life Pentecostal Church (A), Sons of Israel Synagogue (B), Saint Paul's African Methodist Episcopal Church (C), Saint James Greek Orthodox Church (D), First Baptist Church (E), Church of the Nazarene (F), Saint Joseph's Church (G), United Church of Spring Valley (H), First Congregational Church (I). Display/hide their locations on the map
Hotel: Fairfield Inn & Suites Spring Valley (100 Spring Valley Marketplace).
Birthplace of: Phil Bogle - 2005 NFL player (Tampa Bay Buccaneers, born: Sep 27, 1979), Zac Moncrief - Animator, Julianna Margulies, Emmanuel Marc - Player of and football, John Harvey (American football) - Football player, Kelvin Smith - Football player, Murray Olderman - Cartoonist, Seth Joyner - Football player.
Drinking water stations with addresses in Spring Valley and their reported violations in the past:
RIO RECREATION AREA (Address: 390 W. Route 59 , Population served: 500, Groundwater):Past monitoring violations:O & R UTILITIES (Population served: 35, Groundwater):
- One routine major monitoring violation
Past health violations:Past monitoring violations:
- MCL, Monthly (TCR) - In MAY-2011, Contaminant: Coliform. Follow-up actions: St Boil Water Order (MAY-06-2011), St Compliance achieved (AUG-17-2011)
- 2 routine major monitoring violations
| This village: | 3.6 people |
| New York: | 2.6 people |
| This village: | 73.3% |
| Whole state: | 63.5% |
| This village: | 5.7% |
| Whole state: | 6.8% |
Likely homosexual households (counted as self-reported same-sex unmarried-partner households)
- Lesbian couples: 0.4% of all households
- Gay men: 0.4% of all households
People in group quarters in Spring Valley in 2010:
- 171 people in other noninstitutional facilities
- 29 people in group homes intended for adults
- 14 people in emergency and transitional shelters (with sleeping facilities) for people experiencing homelessness
- 2 people in residential treatment centers for adults
People in group quarters in Spring Valley in 2000:
- 83 people in other noninstitutional group quarters
- 77 people in nursing homes
- 77 people in homes for the mentally ill
- 27 people in homes for the mentally retarded
- 11 people in other group homes
- 9 people in training schools for juvenile delinquents
- 7 people in other nonhousehold living situations
- 5 people in religious group quarters
Banks with branches in Spring Valley (2011 data):
- JPMorgan Chase Bank, National Association: Chestnut Ridge Branch at 501 South Main Street, branch established on 1973/10/20; Hillcrest North Main Branch at 269 North Main Street, branch established on 1965/10/02. Info updated 2011/11/10: Bank assets: $1,811,678.0 mil, Deposits: $1,190,738.0 mil, headquarters in Columbus, OH, positive income, International Specialization, 5577 total offices, Holding Company: Jpmorgan Chase & Co.
- Wells Fargo Bank, National Association: Spring Valley Branch at 154 Spring Valley Marketplace, branch established on 1990/03/01. Info updated 2011/04/05: Bank assets: $1,161,490.0 mil, Deposits: $905,653.0 mil, headquarters in Sioux Falls, SD, positive income, 6395 total offices, Holding Company: Wells Fargo & Company
- Provident Bank: Hillcrest Branch (Spring Valley) at 72 West Eckerson Road, branch established on 1996/03/22. Info updated 2011/07/21: Bank assets: $3,075.6 mil, Deposits: $2,161.0 mil, headquarters in Montebello, NY, positive income, Commercial Lending Specialization, 36 total offices
- KeyBank National Association: Main Street - Spring Valley Branch at 4 North Main Street, branch established on 2000/05/01. Info updated 2008/03/03: Bank assets: $86,198.8 mil, Deposits: $64,214.8 mil, headquarters in Cleveland, OH, positive income, Commercial Lending Specialization, 1067 total offices, Holding Company: Keycorp
- HSBC Bank USA, National Association: Spring Valley Branch at 193 Route 59, branch established on 1966/11/05. Info updated 2010/11/30: Bank assets: $206,009.7 mil, Deposits: $149,026.8 mil, headquarters in Mc Lean, VA, positive income, 474 total offices, Holding Company: Hsbc Holdings Plc
- RBS Citizens, National Association: Spring Valley Branch at 253 North Main Street, branch established on 1972/12/15. Info updated 2007/09/19: Bank assets: $106,940.6 mil, Deposits: $75,690.2 mil, headquarters in Providence, RI, positive income, 1135 total offices, Holding Company: Uk Financial Investments Limited
- TD Bank, National Association: Spring Valley Branch at 12 Spring Valley Market Place, branch established on 1996/06/30. Info updated 2010/10/04: Bank assets: $188,912.6 mil, Deposits: $153,149.8 mil, headquarters in Wilmington, DE, positive income, 1314 total offices, Holding Company: Toronto-Dominion Bank, The
For population 15 years and over in Spring Valley:
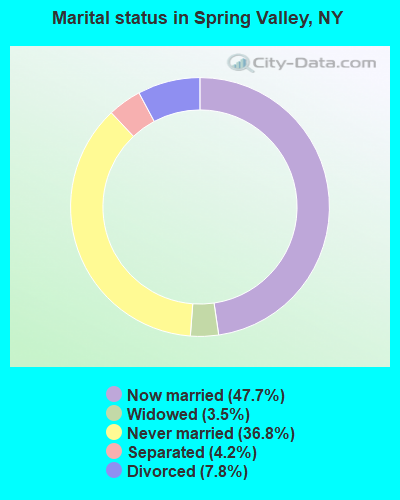
- Never married: 36.8%
- Now married: 47.7%
- Separated: 4.2%
- Widowed: 3.5%
- Divorced: 7.8%
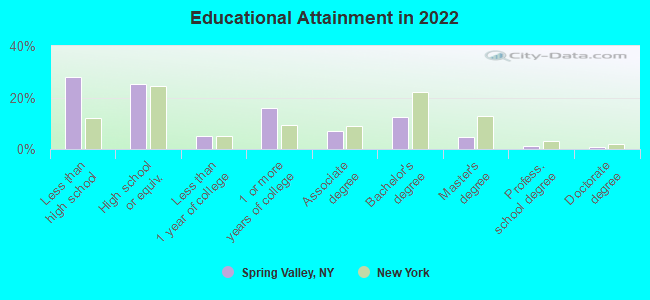
For population 25 years and over in Spring Valley:
- High school or higher: 77.0%
- Bachelor's degree or higher: 18.5%
- Graduate or professional degree: 6.2%
- Unemployed: 7.1%
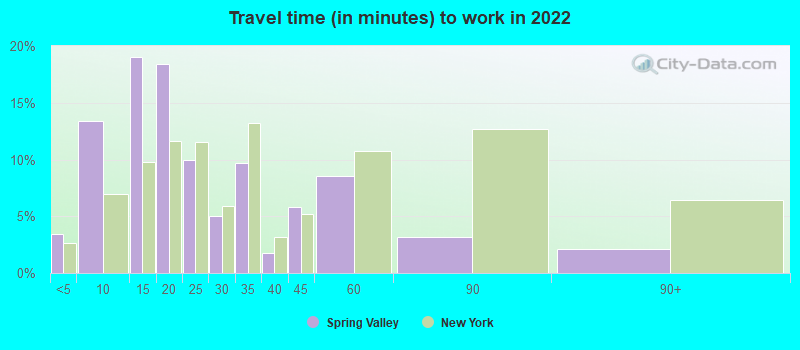
- Mean travel time to work (commute): 23.6 minutes
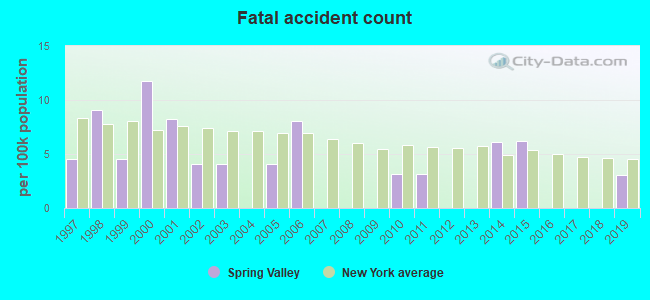
| Here: | 20.9 |
| New York average: | 13.9 |
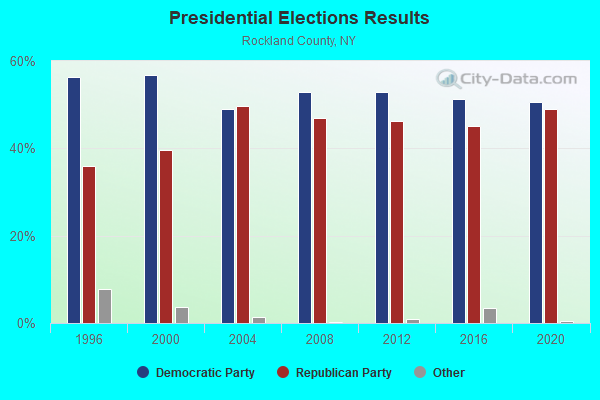
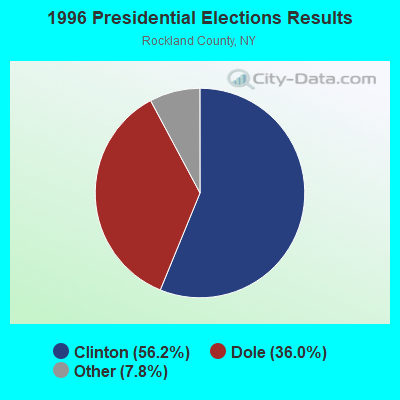
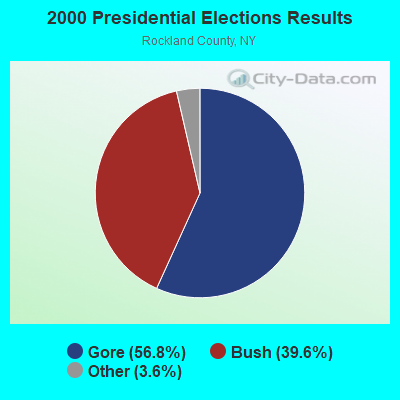
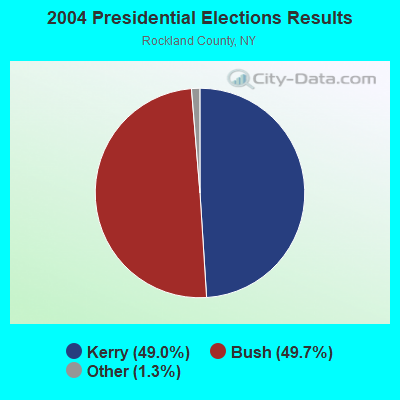
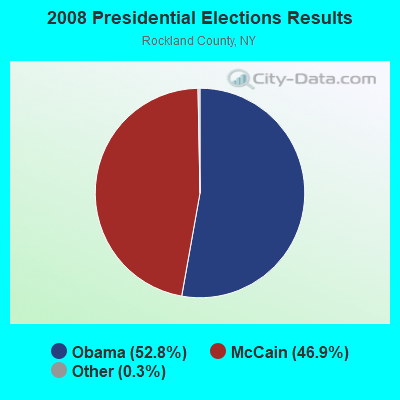
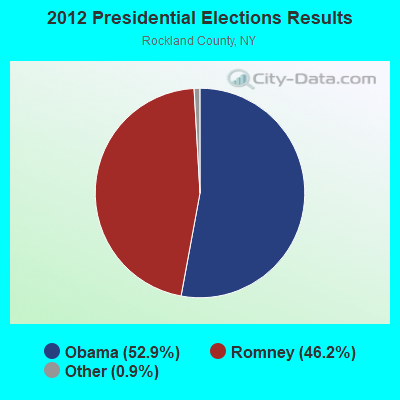
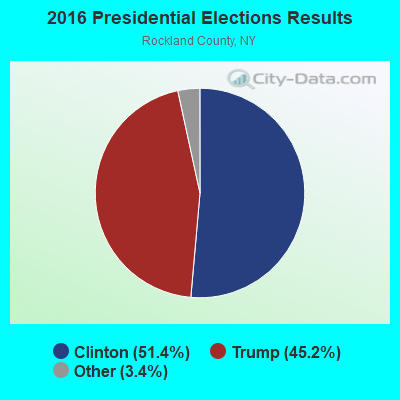
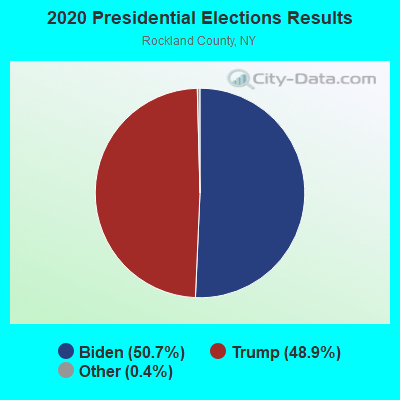
Graphs represent county-level data. Detailed 2008 Election Results
Religion statistics for Spring Valley, NY (based on Rockland County data)
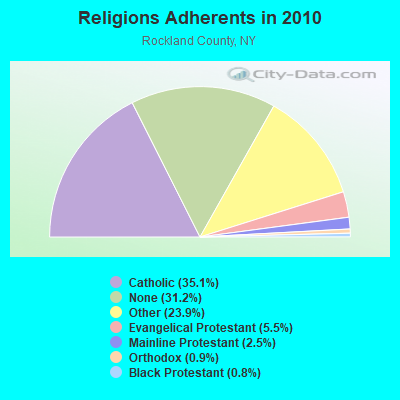
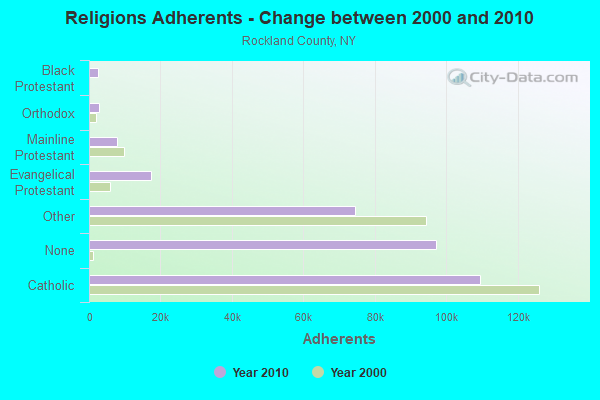
| Religion | Adherents | Congregations |
|---|---|---|
| Catholic | 109,386 | 21 |
| Other | 74,477 | 136 |
| Evangelical Protestant | 17,221 | 84 |
| Mainline Protestant | 7,852 | 48 |
| Orthodox | 2,909 | 14 |
| Black Protestant | 2,640 | 8 |
| None | 97,202 | - |
Food Environment Statistics:
| Rockland County: | 3.20 / 10,000 pop. |
| New York: | 4.13 / 10,000 pop. |
| This county: | 0.07 / 10,000 pop. |
| New York: | 0.06 / 10,000 pop. |
| Rockland County: | 1.21 / 10,000 pop. |
| New York: | 0.92 / 10,000 pop. |
| Rockland County: | 0.98 / 10,000 pop. |
| New York: | 1.68 / 10,000 pop. |
| This county: | 9.70 / 10,000 pop. |
| New York: | 8.82 / 10,000 pop. |
| This county: | 8.7% |
| New York: | 8.2% |
| Rockland County: | 24.1% |
| New York: | 23.8% |
| Rockland County: | 11.0% |
| New York: | 15.6% |
Health and Nutrition:
| Spring Valley: | 46.9% |
| New York: | 50.1% |
| This city: | 44.7% |
| New York: | 48.1% |
| This city: | 29.0 |
| New York: | 28.5 |
| This city: | 20.7% |
| New York: | 20.3% |
| This city: | 11.9% |
| State: | 11.1% |
| Spring Valley: | 6.7 |
| New York: | 6.8 |
| Here: | 32.2% |
| State: | 33.4% |
| Spring Valley: | 54.5% |
| New York: | 56.5% |
| Here: | 82.3% |
| New York: | 80.2% |
More about Health and Nutrition of Spring Valley, NY Residents
| Local government employment and payroll (March 2022) | |||||
| Function | Full-time employees | Monthly full-time payroll | Average yearly full-time wage | Part-time employees | Monthly part-time payroll |
|---|---|---|---|---|---|
| Police Protection - Officers | 54 | $747,618 | $166,137 | 3 | $13,607 |
| Streets and Highways | 35 | $201,011 | $68,918 | 0 | $0 |
| Other Government Administration | 11 | $45,165 | $49,271 | 1 | $2,496 |
| Judicial and Legal | 9 | $43,234 | $57,645 | 3 | $4,464 |
| Financial Administration | 4 | $26,111 | $78,333 | 0 | $0 |
| Welfare | 3 | $15,108 | $60,432 | 0 | $0 |
| Firefighters | 1 | $6,483 | $77,796 | 1 | $2,255 |
| Housing and Community Development (Local) | 1 | $5,206 | $62,472 | 0 | $0 |
| Totals for Government | 118 | $1,089,936 | $110,841 | 8 | $22,821 |
Spring Valley government finances - Expenditure in 2017 (per resident):
- Assistance and Subsidies - Public Welfare, Cash Assistance Programs - Other: $8,562,000 ($260.37)
- Construction - General - Other: $225,000 ($6.84)
- Current Operations - General - Other: $11,124,000 ($338.28)
Housing and Community Development: $8,557,000 ($260.22)
Police Protection: $8,302,000 ($252.46)
Regular Highways: $1,735,000 ($52.76)
Judicial and Legal Services: $919,000 ($27.95)
Protective Inspection and Regulation - Other: $714,000 ($21.71)
Central Staff Services: $580,000 ($17.64)
Local Fire Protection: $469,000 ($14.26)
Financial Administration: $468,000 ($14.23)
General Public Buildings: $427,000 ($12.99)
Parks and Recreation: $276,000 ($8.39)
Transit Utilities: $217,000 ($6.60)
Libraries: $142,000 ($4.32)
Parking Facilities: $64,000 ($1.95)
Solid Waste Management: $35,000 ($1.06)
Health - Other: $11,000 ($0.33)
- General - Interest on Debt: $1,006,000 ($30.59)
- Intergovernmental to Local - Other - Financial Administration: $53,000 ($1.61)
- Other Capital Outlay - Police Protection: $70,000 ($2.13)
Local Fire Protection: $37,000 ($1.13)
Regular Highways: $10,000 ($0.30)
General - Other: $10,000 ($0.30)
Financial Administration: $9,000 ($0.27)
Parks and Recreation: $6,000 ($0.18)
General Public Building: $4,000 ($0.12)
Judicial and Legal Services: $1,000 ($0.03)
- Total Salaries and Wages: $12,274,000 ($373.25)
Spring Valley government finances - Revenue in 2017 (per resident):
- Charges - Other: $89,000 ($2.71)
Housing and Community Development: $17,000 ($0.52)
Parks and Recreation: $2,000 ($0.06)
Parking Facilities: $1,000 ($0.03)
- Federal Intergovernmental - Housing and Community Development: $8,501,000 ($258.51)
Other: $306,000 ($9.31)
- Local Intergovernmental - General Local Government Support: $1,256,000 ($38.19)
Other: $415,000 ($12.62)
- Miscellaneous - Fines and Forfeits: $496,000 ($15.08)
General Revenue - Other: $391,000 ($11.89)
Interest Earnings: $94,000 ($2.86)
Rents: $79,000 ($2.40)
Donations From Private Sources: $12,000 ($0.36)
- Revenue - Transit Utilities: $2,000 ($0.06)
- State Intergovernmental - Other: $467,000 ($14.20)
General Local Government Support: $449,000 ($13.65)
- Tax - Property: $22,843,000 ($694.65)
Other License: $1,059,000 ($32.20)
Public Utilities Sales: $556,000 ($16.91)
Spring Valley government finances - Debt in 2017 (per resident):
- Long Term Debt - Beginning Outstanding - Unspecified Public Purpose: $12,575,000 ($382.40)
Outstanding Unspecified Public Purpose: $11,080,000 ($336.94)
Retired Unspecified Public Purpose: $1,495,000 ($45.46)
Spring Valley government finances - Cash and Securities in 2017 (per resident):
- Bond Funds - Cash and Securities: $202,000 ($6.14)
- Other Funds - Cash and Securities: $8,771,000 ($266.73)
5.89% of this county's 2020 resident taxpayers moved to other counties in 2021 ($101,456 average adjusted gross income)
| Here: | 5.89% |
| New York average: | 6.93% |
0.02% of residents moved to foreign countries ($114 average AGI)
Rockland County: 0.02% New York average: 0.02%
Top counties to which taxpayers relocated from this county between 2020 and 2021:
| to Bergen County, NJ | |
| to Orange County, NY | |
| to Westchester County, NY |
| Businesses in Spring Valley, NY | ||||
| Name | Count | Name | Count | |
|---|---|---|---|---|
| 7-Eleven | 1 | Justice | 1 | |
| AutoZone | 1 | Marriott | 1 | |
| BMW | 1 | MasterBrand Cabinets | 3 | |
| Bed Bath & Beyond | 1 | McDonald's | 1 | |
| Burger King | 1 | Pier 1 Imports | 1 | |
| CVS | 1 | RadioShack | 1 | |
| Decora Cabinetry | 2 | Sprint Nextel | 1 | |
| Domino's Pizza | 1 | T-Mobile | 3 | |
| Dunkin Donuts | 1 | T.J.Maxx | 1 | |
| FedEx | 5 | Target | 1 | |
| GameStop | 1 | U-Haul | 1 | |
| IHOP | 1 | UPS | 4 | |
Strongest AM radio stations in Spring Valley:
- WABC (770 AM; 50 kW; NEW YORK, NY; Owner: WABC-AM RADIO, INC.)
- WFAN (660 AM; 50 kW; NEW YORK, NY; Owner: INFINITY BROADCASTING OPERATIONS, INC.)
- WVNJ (1160 AM; 20 kW; OAKLAND, NJ; Owner: UNIVERSAL B/CASTING OF NEW YORK,INC.)
- WOR (710 AM; 50 kW; NEW YORK, NY; Owner: BUCKLEY BROADCASTING CORPORATION)
- WMCA (570 AM; 50 kW; NEW YORK, NY; Owner: SALEM MEDIA OF NEW YORK, LLC)
- WCBS (880 AM; 50 kW; NEW YORK, NY; Owner: INFINITY BROADCASTING OPERATIONS, INC.)
- WEPN (1050 AM; 50 kW; NEW YORK, NY; Owner: NEW YORK AM RADIO, LLC)
- WINS (1010 AM; 50 kW; NEW YORK, NY; Owner: INFINITY BROADCASTING OPERATIONS, INC.)
- WBBR (1130 AM; 50 kW; NEW YORK, NY; Owner: BLOOMBERG COMMUNICATIONS INC.)
- WADO (1280 AM; 50 kW; NEW YORK, NY; Owner: WADO-AM LICENSE CORP.)
- WSNR (620 AM; 20 kW; JERSEY CITY, NJ)
- WRCR (1300 AM; 0 kW; SPRING VALLEY, NY; Owner: ALEXANDER BROADCASTING, INC.)
- WLIB (1190 AM; 30 kW; NEW YORK, NY; Owner: ICBC BROADCAST HOLDINGS-NY, INC.)
Strongest FM radio stations in Spring Valley:
- WPLJ (95.5 FM; NEW YORK, NY; Owner: WPLJ-FM RADIO, INC.)
- WNYK (88.7 FM; NYACK, NY; Owner: NYACK COLLEGE)
- WKCR-FM (89.9 FM; NEW YORK, NY; Owner: TRUSTEES OF COLUMBIA UNIVERSITY IN NEW YORK)
- WNEW (102.7 FM; NEW YORK, NY; Owner: INFINITY BROADCASTING OPERATIONS, INC.)
- WFAS-FM (103.9 FM; WHITE PLAINS, NY; Owner: CUMULUS LICENSING CORP.)
- WLJP (89.3 FM; MONROE, NY; Owner: SOUND OF LIFE, INC.)
- WKTU (103.5 FM; LAKE SUCCESS, NY; Owner: AMFM RADIO LICENSES, LLC)
- WQCD (101.9 FM; NEW YORK, NY; Owner: EMMIS RADIO LICENSE CORPORATION)
- WAXQ (104.3 FM; NEW YORK, NY; Owner: AMFM NEW YORK LICENSES, LLC)
- WHTZ (100.3 FM; NEWARK, NJ; Owner: AMFM RADIO LICENSES, L.L.C.)
- WWPR-FM (105.1 FM; NEW YORK, NY; Owner: AMFM RADIO LICENSES, L.L.C.)
- WRKS (98.7 FM; NEW YORK, NY; Owner: EMMIS RADIO LICENSE CORP OF NEW YORK)
- WCBS-FM (101.1 FM; NEW YORK, NY; Owner: INFINITY BROADCASTING OPERATIONS, INC.)
- WCAA (105.9 FM; NEWARK, NJ; Owner: WADO-AM LICENSE CORP. ("WADO"))
- WBAI (99.5 FM; NEW YORK, NY; Owner: PACIFICA FOUNDATION, INC.)
- WBLS (107.5 FM; NEW YORK, NY; Owner: ICBC BROADCAST HOLDINGS-NY, INC.)
- WLTW (106.7 FM; NEW YORK, NY; Owner: AMFM NEW YORK LICENSES, LLC)
- WQXR-FM (96.3 FM; NEW YORK, NY; Owner: THE NEW YORK TIMES ELECTRONIC MEDIA COMPANY)
- WSKQ-FM (97.9 FM; NEW YORK, NY; Owner: WSKQ LICENSING, INC.)
- WXRK (92.3 FM; NEW YORK, NY; Owner: INFINITY BROADCASTING OPERATIONS, INC.)
TV broadcast stations around Spring Valley:
- WFME-TV (Channel 66; WEST MILFORD, NJ; Owner: FAMILY STATIONS, INC.)
- WNYW (Channel 5; NEW YORK, NY; Owner: FOX TELEVISION STATIONS, INC.)
- W68DN (Channel 68; CHERRY HILL, ETC., NJ; Owner: MARCIA COHEN)
- WCBS-TV (Channel 2; NEW YORK, NY; Owner: CBS BROADCASTING INC.)
- WABC-TV (Channel 7; NEW YORK, NY; Owner: AMERICAN BROADCASTING COMPANIES, INC)
- WPIX (Channel 11; NEW YORK, NY; Owner: WPIX, INC.)
- WWOR-TV (Channel 9; SECAUCUS, NJ; Owner: FOX TELEVISION STATIONS, INC.)
- WNJU (Channel 47; LINDEN, NJ; Owner: WNJU LICENSE CORPORATION)
- WFUT (Channel 68; NEWARK, NJ; Owner: UNIVISION NEW YORK LLC)
- WPXN-TV (Channel 31; NEW YORK, NY; Owner: PAXSON COMMUNICATIONS LICENSE COMPANY, LLC)
- WXNY-LP (Channel 32; NEW YORK, NY; Owner: ISLAND BROADCASTING COMPANY)
- WNYE-TV (Channel 25; NEW YORK, NY; Owner: NEW YORK CITY BOARD OF EDUCATION)
- WNBC (Channel 4; NEW YORK, NY; Owner: NATIONAL BROADCASTING COMPANY, INC.)
- WNET (Channel 13; NEWARK, NJ; Owner: EDUCATIONAL BROADCASTING CORPORATION)
- WXTV (Channel 41; PATERSON, NJ; Owner: WXTV LICENSE PARTNERSHIP, G.P.)
- WPXO-LP (Channel 34; EAST ORANGE, NJ; Owner: PAXSON COMMUNICATIONS LPTV, INC.)
- WKOB-LP (Channel 53; NEW YORK, NY; Owner: WKOB COMMUNICATIONS, INC.)
- WEBR-CA (Channel 17; MANHATTAN, NY; Owner: K LICENSEE INC.)
- WRNN-LP (Channel 57; NYACK, NY; Owner: LP NYACK LIMITED PARTNERSHIP)
- W60AI (Channel 60; NEW YORK, NY; Owner: VENTANA TELEVISION, INC.)
- WTBY (Channel 54; POUGHKEEPSIE, NY; Owner: TRINITY BROADCASTING OF NEW YORK, INC.)
- W38CL (Channel 38; BRONX, NY; Owner: RENARD COMMUNICATIONS CORP.)
- WNXY-LP (Channel 26; NEW YORK, NY; Owner: ISLAND BROADCASTING COMPANY)
- W33BS (Channel 33; DARIEN, CT; Owner: CT&T BROADCASTING, INC.)
- WNYN-LP (Channel 39; NEW YORK, NY; Owner: ISLAND BROADCASTING COMPANY)
- National Bridge Inventory (NBI) Statistics
- 7Number of bridges
- 56ft / 16.8mTotal length
- $25,576,000Total costs
- 80,957Total average daily traffic
- 3,800Total average daily truck traffic
FCC Registered Antenna Towers:
2- Lynn Toomey, 274 Old Nyak Turnpike (Lat: 41.102389 Lon: -74.045444), Type: 36.5, Structure height: 36087 m, Overall height: 36.5 m, Registrant: Sectorsite Tower Assets, LLC, D/B/A Sectorsite, LLC, Info@sectorsitellc.Com, , 118 Conve-nt Station, Phone: (973) 543-0611
- Dan Gechtman, 274 Old Nyak Turnpike (Lat: 41.102389 Lon: -74.045444), Type: 36.5, Structure height: 36087 m, Overall height: 36.5 m, Registrant: Sectorsite Tower Assets, LLC, D/B/A Sectorsite, LLC, Info@sectorsitellc.Com, , 118 Conve-nt Station, Phone: (973) 543-0611
FCC Registered Commercial Land Mobile Towers:
1 (See the full list of FCC Registered Commercial Land Mobile Towers in Spring Valley, NY)FCC Registered Private Land Mobile Towers:
2 (See the full list of FCC Registered Private Land Mobile Towers)FCC Registered Broadcast Land Mobile Towers:
18 (See the full list of FCC Registered Broadcast Land Mobile Towers)FCC Registered Microwave Towers:
4- 728 N Main St SV, Lat: 41.139528 Lon: -74.034639, Type: Mast, Structure height: 172 m, Overall height: 174.3 m, Call Sign: WQOW965,
Assigned Frequencies: 3650.00 MHz, Grant Date: 02/22/2012, Expiration Date: 02/22/2022, Cancellation Date: 03/01/2022, Certifier: Mordy Gross, Registrant: Xchange Telecom Corp., 3611 14th Ave. Suite 215, Brooklyn, NY 11218, Phone: (646) 722-7200, Fax: (646) 726-9615, Email:
- SPRING VLY, 390 West Route 59 (Lat: 41.109528 Lon: -74.059583), Type: Tower, Structure height: 54.9 m, Overall height: 57.9 m, Call Sign: WAA718,
Assigned Frequencies: 5974.85 MHz, 6093.45 MHz, 10875.0 MHz, 6555.00 MHz, Grant Date: 01/26/2018, Expiration Date: 01/14/2028, Registrant: Blooston, Mordkofsky, Dickens & Prendergast, LLP, 2120 L Street, N.W., Suite 825, Washington, DC 20037, Phone: (202) 828-5565, Fax: (202) 828-5568, Email:
- ONE RAM RIDGE, One Ram Ridge Rd (Lat: 41.080083 Lon: -74.054583), Overall height: 6.4 m, Call Sign: WLN328,
Assigned Frequencies: 22525.0 MHz, Grant Date: 04/17/1991, Expiration Date: 02/01/2001, Cancellation Date: 12/22/2002, Registrant: Locate LLC, 17 Battery Pl Ste 1200, New York, NY 10004
- 100 SCHOOL, 100 School House Rd (Lat: 41.077028 Lon: -74.054028), Overall height: 6.4 m, Call Sign: WLN329,
Assigned Frequencies: 21325.0 MHz, Grant Date: 04/17/1991, Expiration Date: 02/01/2001, Cancellation Date: 12/22/2002, Registrant: Locate LLC, 17 Battery Pl Ste 1200, New York, NY 10004
FCC Registered Paging Towers:
2- 150 Liberty Parkway (Lat: 41.106194 Lon: -74.061250), Overall height: 29.9 m, Call Sign: KNKJ998,
Assigned Frequencies: 931.362 MHz, Grant Date: 04/19/1999, Expiration Date: 04/01/2009, Cancellation Date: 10/28/2004, Certifier: Kenneth Goldstein, Registrant: Alston & Bird LLP, 601 Pennsylvania Ave., Nw, North Building, 10th Floor, Washington, DC 20004, Phone: (202) 756-3376, Fax: (202) 756-3333, Email:
- 7 Mark Drive (Lat: 41.154806 Lon: -74.061528), Call Sign: WQZD509,
Assigned Frequencies: 931.937 MHz, Grant Date: 04/23/2019, Expiration Date: 04/01/2029, Certifier: J. Roy Pottle, Registrant: Wilkinson Barker Knauer, LLP, 1800 M Street, N.W., Suite 800n, Washington, DC 20036, Phone: (202) 783-4141, Fax: (202) 783-5851, Email:
FCC Registered Amateur Radio Licenses:
80 (See the full list of FCC Registered Amateur Radio Licenses in Spring Valley)FAA Registered Aircraft:
4- Aircraft: PIPER PA-28-180 (Category: Land, Seats: 4, Weight: Up to 12,499 Pounds, Speed: 107 mph), Engine: LYCOMING O&VO-360 SER (180 HP) (Reciprocating)
N-Number: 4885L, N4885L, N-4885L, Serial Number: 28-4251, Year manufactured: 1967, Airworthiness Date: 08/01/1967, Certificate Issue Date: 10/18/2016
Registrant (Corporation): Maximize Solutions Inc, 15 Rodman Ct, Spring Valley, NY 10977 - Aircraft: CESSNA 182R (Category: Land, Seats: 4, Weight: Up to 12,499 Pounds), Engine: CONT MOTOR I0-470 SERIES (260 HP) (Reciprocating)
N-Number: 5493N, N5493N, N-5493N, Serial Number: 18267757, Year manufactured: 1980, Airworthiness Date: 10/16/1980, Certificate Issue Date: 01/25/2019
Registrant (LLC): Ocaid Equipment Leasing LLC, Po Box 547, Spring Valley, NY 10977 - Aircraft: CESSNA 560 (Category: Land, Engines: 2, Seats: 11, Weight: 12,500 - 19,999 Pounds), Engine: P&W CANADA JT15D 5 SER (2900 Pounds of Thrust) (Turbo-fan)
N-Number: 891FV, N891FV, N-891FV, Serial Number: 560-0427, Year manufactured: 1997, Airworthiness Date: 08/05/1997, Certificate Issue Date: 07/24/2018
Registrant (LLC): Bhkt LLC, 25 Jacaruso Dr, Spring Valley, NY 10977 - Aircraft: CESSNA 150F (Category: Land, Seats: 2, Weight: Up to 12,499 Pounds, Speed: 90 mph), Engine: CONT MOTOR 0-200 SERIES (100 HP) (Reciprocating)
N-Number: 8954S, N8954S, N-8954S, Serial Number: 15062254, Year manufactured: 1965, Certificate Issue Date: 04/19/1968
Registrant (Corporation): Span Air Inc, Smith Road, Spring Valley, NY 10977
Deregistered: Cancel Date: 02/04/2017
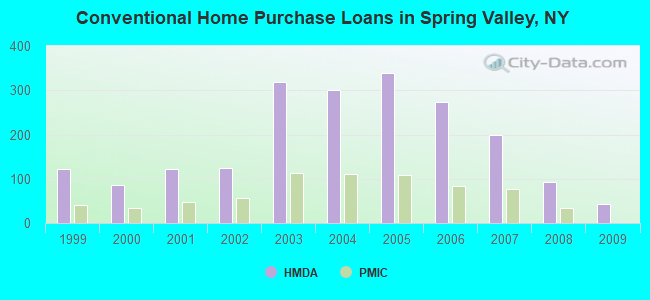
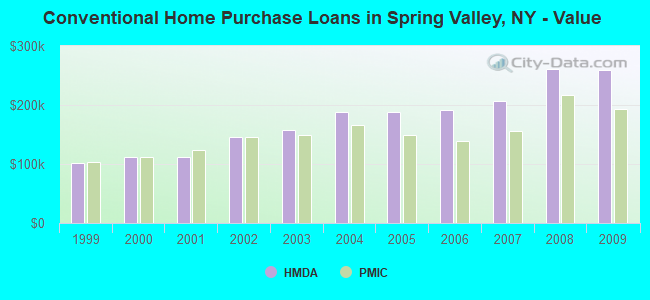
| Home Mortgage Disclosure Act Aggregated Statistics For Year 2009 (Based on 4 full and 1 partial tracts) | ||||||||||||
| A) FHA, FSA/RHS & VA Home Purchase Loans | B) Conventional Home Purchase Loans | C) Refinancings | D) Home Improvement Loans | E) Loans on Dwellings For 5+ Families | F) Non-occupant Loans on < 5 Family Dwellings (A B C & D) | |||||||
|---|---|---|---|---|---|---|---|---|---|---|---|---|
| Number | Average Value | Number | Average Value | Number | Average Value | Number | Average Value | Number | Average Value | Number | Average Value | |
| LOANS ORIGINATED | 12 | $220,011 | 43 | $260,140 | 61 | $218,851 | 5 | $294,180 | 2 | $7,762,600 | 18 | $264,222 |
| APPLICATIONS APPROVED, NOT ACCEPTED | 4 | $254,500 | 16 | $169,059 | 23 | $238,838 | 0 | $0 | 0 | $0 | 5 | $217,600 |
| APPLICATIONS DENIED | 2 | $315,360 | 45 | $232,688 | 112 | $245,612 | 6 | $37,653 | 1 | $1,055,760 | 22 | $203,812 |
| APPLICATIONS WITHDRAWN | 2 | $275,240 | 10 | $202,206 | 44 | $290,647 | 0 | $0 | 0 | $0 | 8 | $406,632 |
| FILES CLOSED FOR INCOMPLETENESS | 0 | $0 | 6 | $231,500 | 17 | $289,638 | 1 | $19,000 | 0 | $0 | 3 | $353,333 |
Detailed HMDA statistics for the following Tracts: 0113.01 , 0122.01, 0122.02, 0123.00, 0124.00
| Private Mortgage Insurance Companies Aggregated Statistics For Year 2009 (Based on 4 full and 1 partial tracts) | ||||
| A) Conventional Home Purchase Loans | B) Refinancings | |||
|---|---|---|---|---|
| Number | Average Value | Number | Average Value | |
| LOANS ORIGINATED | 1 | $192,710 | 0 | $0 |
| APPLICATIONS APPROVED, NOT ACCEPTED | 5 | $328,000 | 0 | $0 |
| APPLICATIONS DENIED | 4 | $310,485 | 1 | $423,120 |
| APPLICATIONS WITHDRAWN | 0 | $0 | 0 | $0 |
| FILES CLOSED FOR INCOMPLETENESS | 0 | $0 | 0 | $0 |
Detailed PMIC statistics for the following Tracts: 0113.01 , 0122.01, 0122.02, 0123.00, 0124.00
2003 - 2018 National Fire Incident Reporting System (NFIRS) incidents
- Fire incident types reported to NFIRS in Spring Valley, NY
- 43063.7%Structure Fires
- 15623.1%Outside Fires
- 558.1%Mobile Property/Vehicle Fires
- 345.0%Other
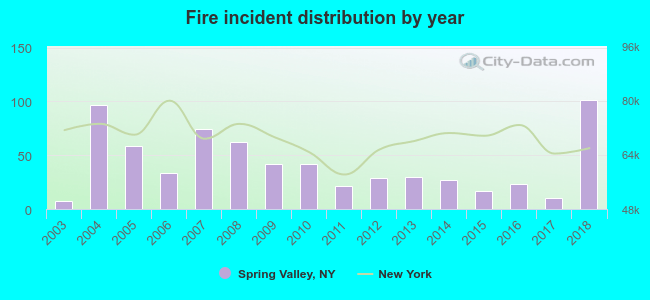 Based on the data from the years 2003 - 2018 the average number of fire incidents per year is 42. The highest number of reported fire incidents - 101 took place in 2018, and the least - 7 in 2003. The data has an increasing trend.
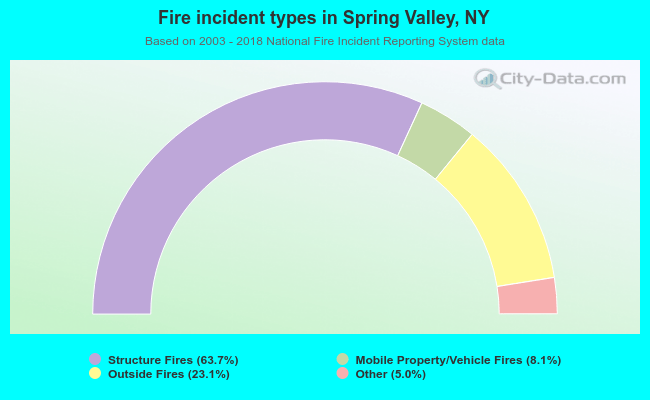 When looking into fire subcategories, the most incidents belonged to: Structure Fires (63.7%), and Outside Fires (23.1%).
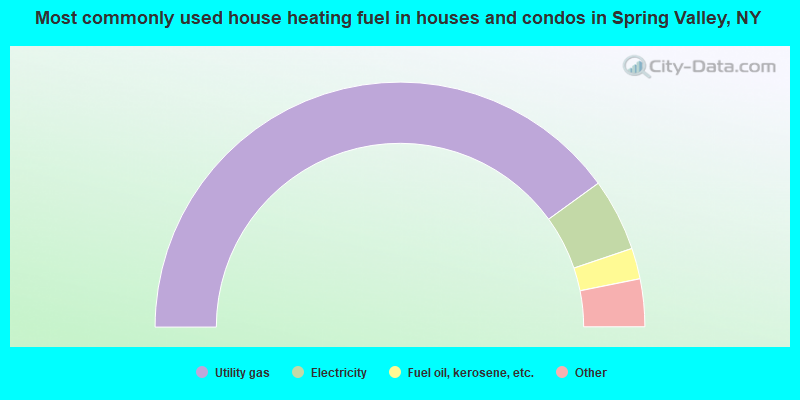
- 80.2%Utility gas
- 9.6%Electricity
- 4.1%Fuel oil, kerosene, etc.
- 3.3%Bottled, tank, or LP gas
- 1.8%Other fuel
- 1.1%No fuel used
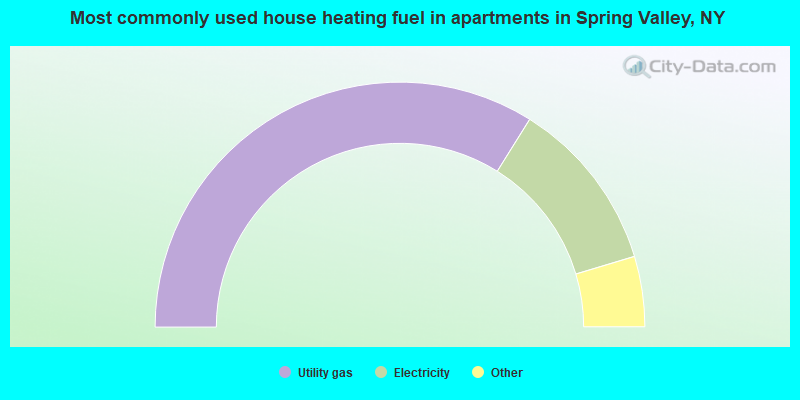
- 67.8%Utility gas
- 22.9%Electricity
- 3.0%Other fuel
- 2.6%Fuel oil, kerosene, etc.
- 1.9%Bottled, tank, or LP gas
- 1.7%No fuel used
Spring Valley compared to New York state average:
- Median household income below state average.
- Unemployed percentage below state average.
- Black race population percentage significantly above state average.
- Hispanic race population percentage above state average.
- Median age significantly below state average.
- Foreign-born population percentage above state average.
- Renting percentage above state average.
- Length of stay since moving in above state average.
- Number of rooms per house below state average.
- House age below state average.
- Percentage of population with a bachelor's degree or higher below state average.
Spring Valley on our top lists:
- #4 on the list of "Top 101 cities with the most people taking a taxi to work (population 5,000+)"
- #10 on the list of "Top 101 cities with the most residents born in Haiti (population 500+)"
- #16 on the list of "Top 101 cities with the most residents born in Other Southern Africa (population 500+)"
- #22 on the list of "Top 101 cities with the most residents born in Guatemala (population 500+)"
- #29 on the list of "Top 101 cities with the most residents born in Ecuador (population 500+)"
- #40 on the list of "Top 101 cities with largest percentage of females in occupations: building and grounds cleaning and maintenance occupations (population 5,000+)"
- #46 on the list of "Top 101 cities with the largest percentage of elementary and middle school students in private schools (1,000+ students)"
- #71 on the list of "Top 101 cities with the most residents born in Caribbean (population 500+)"
- #75 on the list of "Top 100 cities with highest percentage of foreign-born residents (pop. 5,000+)"
- #80 on the list of "Top 101 cities with largest percentage of males in occupations: building and grounds cleaning and maintenance occupations (population 5,000+)"
- #83 on the list of "Top 101 cities with largest percentage of males in industries: administrative and support and waste management services (population 5,000+)"
- #89 on the list of "Top 100 cities with highest percentage of renters (pop. 5,000+)"
- #101 on the list of "Top 101 cities with the most people walking to work (population 5,000+)"
- #61 (10977) on the list of "Top 101 zip codes with the largest percentage of Hungarian first ancestries"
- #91 (10977) on the list of "Top 101 zip codes with the largest percentage of West Indian first ancestries"
- #19 on the list of "Top 101 counties with the lowest number of infant deaths per 1000 residents 2007-2013 (pop. 50,000+)"
- #32 on the list of "Top 101 counties with the most Other adherents"
- #33 on the list of "Top 101 counties with the most Orthodox congregations"
- #34 on the list of "Top 101 counties with the most Other congregations"
- #45 on the list of "Top 101 counties with the lowest percentage of residents relocating from other counties between 2010 and 2011 (pop. 50,000+)"

|
|
Total of 118 patent applications in 2008-2024.