Burbank neighborhood in Hayward, California (CA), 94541, 94544 detailed profile
Settings
X


Business Search - 14 Million verified businesses
Area: 0.579 square miles
Population: 7,240
Population density:
| Burbank: | 12,508 people per square mile |
| Hayward: | 3,536 people per square mile |

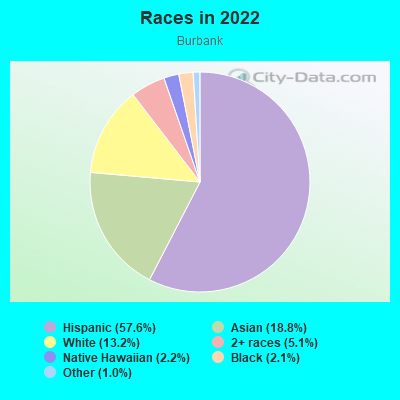
- 4,17857.6%Hispanic or Latino
- 1,36518.8%Asian
- 95713.2%White
- 3695.1%Two or more races
- 1582.2%Native Hawaiian and Other
Pacific Islander - 1502.1%Black
- 761.0%Some other race
Median household income in 2022:
| Burbank: | $85,079 |
| Hayward: | $101,199 |
Distribution of median household income
![Distribution of median household income]()
- 238Less than $10,000
- 77$10,000 to $19,999
- 170$20,000 to $29,999
- 219$30,000 to $39,999
- 235$40,000 to $49,999
- 127$50,000 to $59,999
- 107$60,000 to $74,999
- 291$75,000 to $99,999
- 233$100,000 to $124,999
- 172$125,000 to $149,999
- 259$150,000 to $199,999
- 366$200,000 or more

Distribution of owner-occupied house/condo value
![Distribution of owner-occupied house/condo value]()
- 149Less than $50,000
- 29$50,000 to $99,999
- 65$200,000 to $249,999
- 55$300,000 to $399,999
- 36$400,000 to $499,999
- 546$500,000 to $749,999
- 321$750,000 to $999,999
- 270$1,000,000 or more

Distribution of rent paid by renters
![Distribution of rent paid by renters]()
- 32Less than $100
- 44$200 to $299
- 81$300 to $399
- 5$400 to $499
- 41$500 to $599
- 116$700 to $799
- 7$800 to $899
- 154$1,000 to $1,249
- 130$1,250 to $1,499
- 273$1,500 to $1,999
- 554$2,000 or more

Median rent in 2022:
| Burbank: | $1,948 |
| Hayward: | $1,986 |
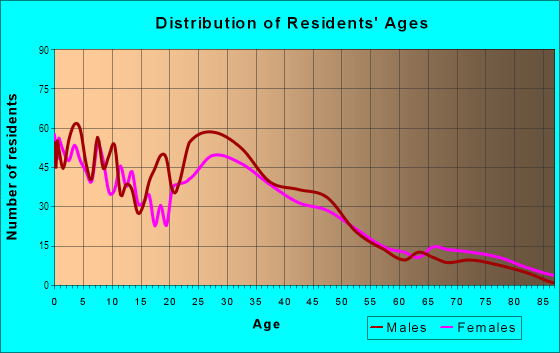
| Males: | 3,848 |
| Females: | 3,391 |
Males:
| This neighborhood: | 34.9 years |
| Whole city: | 37.2 years |
| This neighborhood: | 40.5 years |
| Whole city: | 40.3 years |
Average household size:
| Burbank: | 3.3 people |
| Hayward: | 3.1 people |
Percentage of family households:
| Burbank: | 45.4% |
| Hayward: | 51.7% |
| Here: | 37.4% |
| Hayward: | 48.8% |
Percentage of married-couple families with children (among all households):
| Burbank: | 24.1% |
| Hayward: | 21.7% |
Percentage of single-mother households (among all households):
| Burbank: | 5.4% |
| Hayward: | 5.6% |
Percentage of never married males 15 years old and over:
Percentage of never married females 15 years old and over:
| Burbank: | 25.0% |
| Hayward: | 22.2% |
Percentage of never married females 15 years old and over:
| Burbank: | 14.5% |
| city: | 19.8% |
Percentage of people that speak English not well or not at all:
| Burbank: | 5.6% |
| Hayward: | 12.1% |
Percentage of people born in this state:
Percentage of people born in another U.S. state:
Percentage of native residents but born outside the U.S.:
Percentage of foreign born residents:
| Here: | 44.9% |
| Hayward: | 47.1% |
Percentage of people born in another U.S. state:
| Burbank: | 6.7% |
| Hayward: | 7.6% |
Percentage of native residents but born outside the U.S.:
| Here: | 2.9% |
| city: | 2.5% |
Percentage of foreign born residents:
| Here: | 45.6% |
| Hayward: | 42.8% |
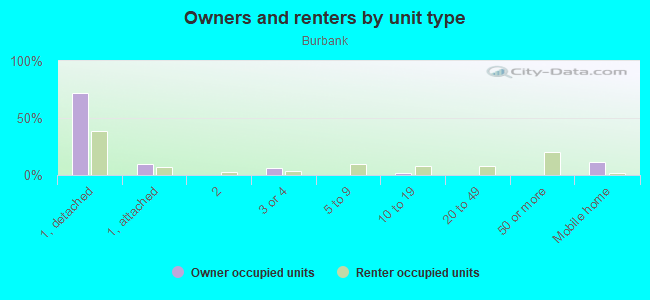
Owner-occupied
Renter-occupied

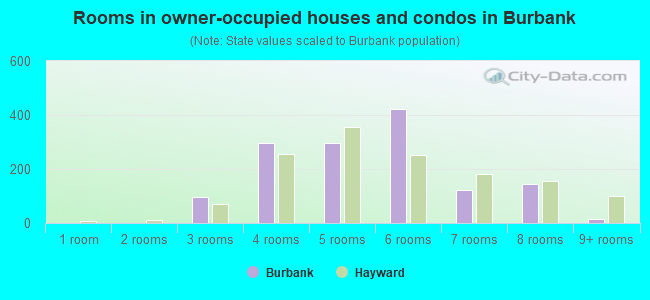
- Rooms in owner-occupied houses and condos in Burbank
- 01 room
- 02 rooms
- 953 rooms
- 2984 rooms
- 2955 rooms
- 4226 rooms
- 1217 rooms
- 1458 rooms
- 169+ rooms
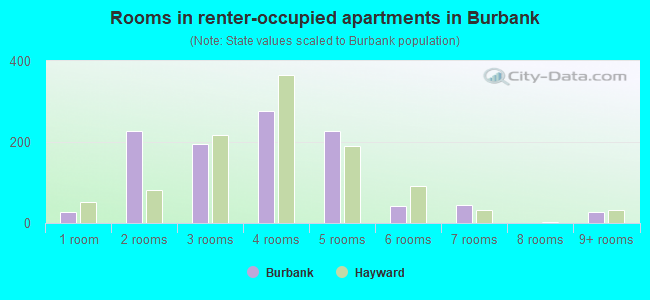
- Rooms in renter-occupied apartments in Burbank
- 281 room
- 2282 rooms
- 1953 rooms
- 2764 rooms
- 2285 rooms
- 436 rooms
- 447 rooms
- 08 rooms
- 289+ rooms
Owner-occupied
Renter-occupied
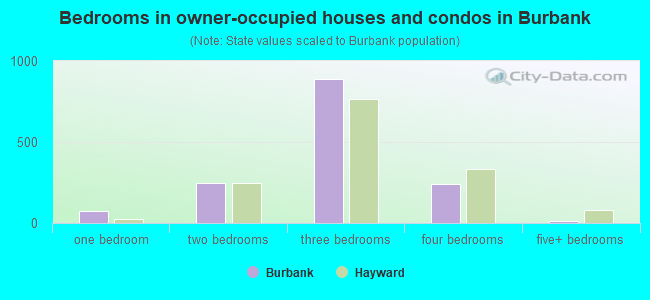
- Bedrooms in owner-occupied houses and condos in Burbank
- 0no bedroom
- 711 bedroom
- 2452 bedrooms
- 8893 bedrooms
- 2414 bedrooms
- 145+ bedrooms
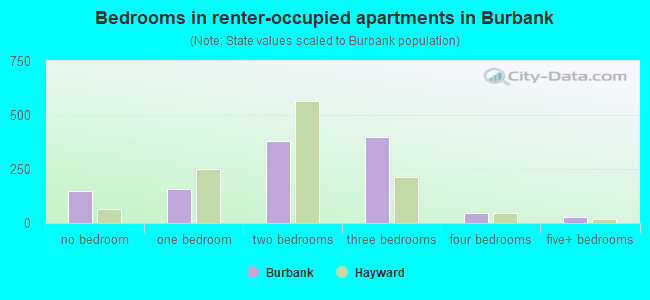
- Bedrooms in renter-occupied apartments in Burbank
- 148no bedroom
- 1581 bedroom
- 3792 bedrooms
- 3973 bedrooms
- 444 bedrooms
- 285+ bedrooms
Average number of cars or other vehicles available in houses/condos:
Average number of cars or other vehicles available in apartments:
| This neighborhood: | 2.0 |
| Hayward: | 2.4 |
Average number of cars or other vehicles available in apartments:
| Here: | 2.2 |
| city: | 1.8 |
Percentage of units with a mortgage:
| Burbank: | 57.0% |
| Hayward: | 70.5% |
Average estimated value of detached houses in 2022 (70.3% of all units):
| Burbank: | $755,043 |
| Hayward: | $943,651 |
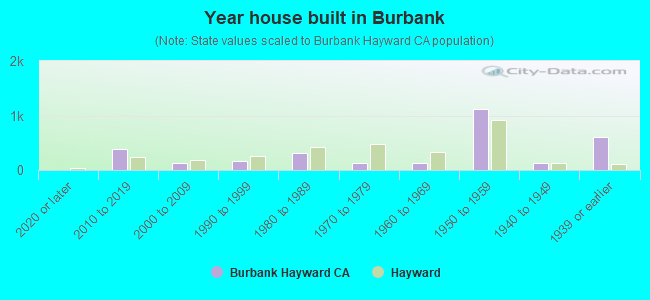
- Year house built in Burbank
- 02020 or later
- 3782010 to 2019
- 1282000 to 2009
- 1651990 to 1999
- 3061980 to 1989
- 1371970 to 1979
- 1291960 to 1969
- 1,1241950 to 1959
- 1341940 to 1949
- 5981939 or earlier
City-data.com crime index for city in 2020 (higher means more crime):
| City: | 308.5 |
| U.S. average: | 219.5 |
Travel time to work (commute)
![Travel time to work (commute)]()
- 44Less than 5 minutes
- 1435 to 9 minutes
- 29410 to 14 minutes
- 68615 to 19 minutes
- 38920 to 24 minutes
- 21425 to 29 minutes
- 70030 to 34 minutes
- 15835 to 39 minutes
- 2840 to 44 minutes
- 26845 to 59 minutes
- 22760 to 89 minutes
- 21490 or more minutes

Means of transportation to work
![Means of transportation to work]()
- 53.3%1,656Drove a car alone
- 18.5%576Carpooled
- 5.2%162Bus
- 6.5%203Subway or elevated rail
- 6.1%189Taxi
- 2.2%67Walked
- 4.4%138Other means
- 14.5%449Worked at home

Time leaving home to go to work
![Time leaving home to go to work]()
- 51112:00 a.m. to 4:59 a.m.
- 1295:00 a.m. to 5:29 a.m.
- 2705:30 a.m. to 5:59 a.m.
- 2956:00 a.m. to 6:29 a.m.
- 2406:30 a.m. to 6:59 a.m.
- 4657:00 a.m. to 7:29 a.m.
- 2457:30 a.m. to 7:59 a.m.
- 2508:00 a.m. to 8:29 a.m.
- 928:30 a.m. to 8:59 a.m.
- 1639:00 a.m. to 9:59 a.m.
- 31110:00 a.m. to 10:59 a.m.
- 5011:00 a.m. to 11:59 a.m.
- 31112:00 p.m. to 3:59 p.m.
- 1474:00 p.m. to 11:59 p.m.

Occupations of males:
- Percentage of males in management occupations (except farmers):
Here: 8.1% city: 8.3%
- Percentage of males in business and financial operations occupations:
Here: 3.9% city: 4.2%
- Percentage of males in computer and mathematical occupations:
Here: 1.7% city: 7.1%
- Percentage of males in architecture and engineering occupations:
Here: 4.8% city: 3.9%
- Percentage of males in community and social services occupations:
Here: 1.4% city: 1.0%
- Percentage of males in legal occupations:
Here: 2.5% city: 0.4%
- Percentage of males in education, training, and library occupations:
Here: 1.2% city: 2.1%
- Percentage of males in healthcare practitioners and technical occupations:
Here: 3.3% city: 2.6%
- Percentage of males in service occupations:
Here: 14.8% city: 14.9%
- Percentage of males in sales and office occupations:
Here: 4.5% city: 13.9%
- Percentage of males in farming, fishing, and forestry occupations:
Here: 2.6% city: 0.5%
- Percentage of males in construction, extraction, and maintenance occupations:
Here: 34.4% city: 10.7%
- Percentage of males in production occupations:
Here: 3.7% city: 6.8%
- Percentage of males in transportation occupations:
Here: 8.3% city: 8.4%
- Percentage of males in material moving occupations:
Here: 5.9% city: 5.5%
Occupations of females:
- Percentage of females in management occupations (except farmers):
Here: 20.8% city: 10.2%
- Percentage of females in business and financial operations occupations:
Here: 4.6% city: 7.7%
- Percentage of females in computer and mathematical occupations:
Here: 3.2% city: 2.6%
- Percentage of females in architecture and engineering occupations:
Here: 3.8% city: 0.8%
- Percentage of females in life, physical, and social science occupations:
Here: 5.8% city: 1.3%
- Percentage of females in community and social services occupations:
Here: 4.8% city: 1.9%
- Percentage of females in education, training, and library occupations:
Here: 8.3% city: 6.1%
- Percentage of females in arts, design, entertainment, sports, and media occupations:
Here: 1.9% city: 1.3%
- Percentage of females in healthcare practitioners and technical occupations:
Here: 3.0% city: 7.7%
- Percentage of females in service occupations:
Here: 24.6% city: 23.5%
- Percentage of females in sales and office occupations:
Here: 14.5% city: 26.6%
- Percentage of females in transportation occupations:
Here: 1.5% city: 1.0%
- Percentage of females in material moving occupations:
Here: 8.2% city: 2.5%
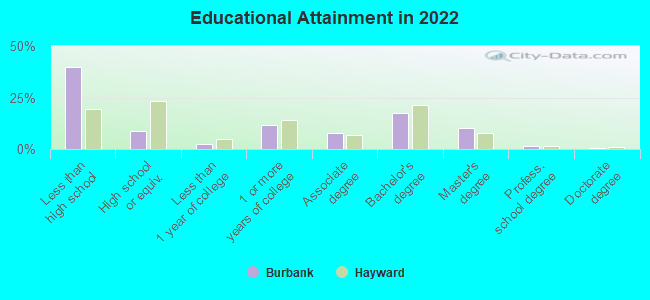
Education in this neighborhood (subdivision or community):
- Percentage of people 3 years and older in K-12 schools:
Burbank: 14.5% Hayward: 13.7%
- Percentage of people 3 years and older in undergraduate colleges:
Burbank: 5.3% Hayward: 6.2%
- Percentage of people 3 years and older in grad. or professional schools:
Burbank: 2.0% Hayward: 1.9%
- Percentage of students K-12 enrolled in private schools:
Burbank: 29.2% Hayward: 14.7%
Percentage of population below poverty level:
| Burbank: | 12.5% |
| Hayward: | 14.2% |
Median year owner moved in (as recorded in 2022):
Median year renter moved in (as recorded in 2022):
| Burbank: | 2010 |
| Hayward: | 2012 |
Median year renter moved in (as recorded in 2022):
| Burbank: | 2015 |
| Hayward: | 2018 |
Percentage of married-couple families with both working:
| Burbank: | 66.9% |
| Hayward: | 68.5% |
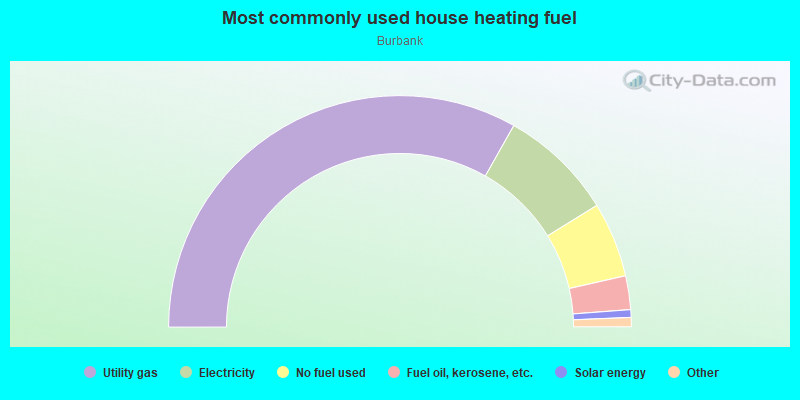
- 66.4%Utility gas
- 16.0%Electricity
- 10.5%No fuel used
- 4.7%Fuel oil, kerosene, etc.
- 1.1%Solar energy
- 0.8%Other fuel
- 0.6%Bottled, tank, or LP gas
Highways in this neighborhood:
Jackson St (State Hwy 92)
Length: 0.95 miles
Directions: SE-NW, SW-NE
Address range: 61 to 599
Directions: SE-NW, SW-NE
Address range: 61 to 599
Roads and streets:
Alice St
Length: 0.74 miles
Directions: E-W, N-S, SE-NW
Address range: 22500 to 24299
Directions: E-W, N-S, SE-NW
Address range: 22500 to 24299
D St
Length: 0.74 miles
Directions: N-S, SW-NE
Address range: 300 to 399
Directions: N-S, SW-NE
Address range: 300 to 399
Winton Ave
Length: 0.71 miles
Directions: E-W, SW-NE
Address range: 29 to 499
Directions: E-W, SW-NE
Address range: 29 to 499
B St
Length: 0.69 miles
Directions: E-W, SW-NE
Address range: 100 to 599
Directions: E-W, SW-NE
Address range: 100 to 599
Myrtle St
Length: 0.65 miles
Direction: SE-NW
Address range: 22500 to 24099
Direction: SE-NW
Address range: 22500 to 24099
A St
Length: 0.64 miles
Directions: E-W, SW-NE
Address range: 259 to 611
Directions: E-W, SW-NE
Address range: 259 to 611
Grand St
Length: 0.58 miles
Directions: E-W, SE-NW
Address range: 22500 to 24199
Directions: E-W, SE-NW
Address range: 22500 to 24199
C St
Length: 0.55 miles
Directions: E-W, SW-NE
Address range: 100 to 599
Directions: E-W, SW-NE
Address range: 100 to 599
Meek Ave
Length: 0.51 miles
Directions: E-W, SE-NW
Address range: 200 to 599
Directions: E-W, SE-NW
Address range: 200 to 599
Mlk Way
Length: 0.49 miles
Directions: N-S, SE-NW
Directions: N-S, SE-NW
Smalley Ave
Length: 0.36 miles
Directions: E-W, SW-NE
Address range: 361 to 599
Directions: E-W, SW-NE
Address range: 361 to 599
Park St
Length: 0.35 miles
Directions: E-W, SE-NW
Address range: 24000 to 24317
Directions: E-W, SE-NW
Address range: 24000 to 24317
Filbert St
Length: 0.29 miles
Directions: N-S, SE-NW
Address range: 22500 to 22799
Directions: N-S, SE-NW
Address range: 22500 to 22799
Soto Rd
Length: 0.27 miles
Direction: SE-NW
Address range: 24100 to 24599
Direction: SE-NW
Address range: 24100 to 24599
Flagg St
Length: 0.22 miles
Direction: SE-NW
Address range: 22300 to 22499
Direction: SE-NW
Address range: 22300 to 22499
Laurel Ave
Length: 0.19 miles
Directions: E-W, SW-NE
Address range: 434 to 599
Directions: E-W, SW-NE
Address range: 434 to 599
Arnold Ct
Length: 0.18 miles
Directions: E-W, N-S, SE-NW, SW-NE
Address range: 22700 to 22899
Directions: E-W, N-S, SE-NW, SW-NE
Address range: 22700 to 22899
New St
Length: 0.16 miles
Direction: E-W
Direction: E-W
Magna Ave
Length: 0.15 miles
Direction: SE-NW
Address range: 24100 to 24399
Direction: SE-NW
Address range: 24100 to 24399
Western Blvd
Length: 0.15 miles
Direction: SE-NW
Direction: SE-NW
Clarendale St
Length: 0.14 miles
Direction: SE-NW
Address range: 24100 to 24399
Direction: SE-NW
Address range: 24100 to 24399
Barnes Ct
Length: 0.14 miles
Directions: N-S, SW-NE
Address range: 1 to 99
Directions: N-S, SW-NE
Address range: 1 to 99
Rotary St
Length: 0.13 miles
Direction: E-W
Address range: 300 to 399
Direction: E-W
Address range: 300 to 399
W Winton Ave
Length: 0.12 miles
Direction: E-W
Direction: E-W
Optimist St
Length: 0.12 miles
Direction: SE-NW
Address range: 22800 to 22899
Direction: SE-NW
Address range: 22800 to 22899
Lion St
Length: 0.11 miles
Directions: E-W, SW-NE
Address range: 300 to 399
Directions: E-W, SW-NE
Address range: 300 to 399
Kiwanis St
Length: 0.09 miles
Directions: N-S, SE-NW
Address range: 22800 to 22899
Directions: N-S, SE-NW
Address range: 22800 to 22899
Dean St
Length: 0.09 miles
Direction: E-W
Address range: 500 to 599
Direction: E-W
Address range: 500 to 599
Souza Ct
Length: 0.08 miles
Direction: SE-NW
Address range: 22700 to 22799
Direction: SE-NW
Address range: 22700 to 22799
Burbank St
Length: 0.08 miles
Direction: SE-NW
Address range: 22600 to 22699
Direction: SE-NW
Address range: 22600 to 22699
Dotson Ct
Length: 0.07 miles
Direction: SE-NW
Address range: 24000 to 24099
Direction: SE-NW
Address range: 24000 to 24099
St Anton Way
Length: 0.07 miles
Direction: E-W
Direction: E-W
Pamela Ct
Length: 0.06 miles
Direction: E-W
Address range: 400 to 499
Direction: E-W
Address range: 400 to 499
Eight St
Length: 0.02 miles
Direction: E-W
Direction: E-W
Three St
Length: 0.02 miles
Direction: E-W
Direction: E-W
Sycamore Ave
Length: 0.01 miles
Directions: E-W, SE-NW
Address range: 300 to 309
Directions: E-W, SE-NW
Address range: 300 to 309