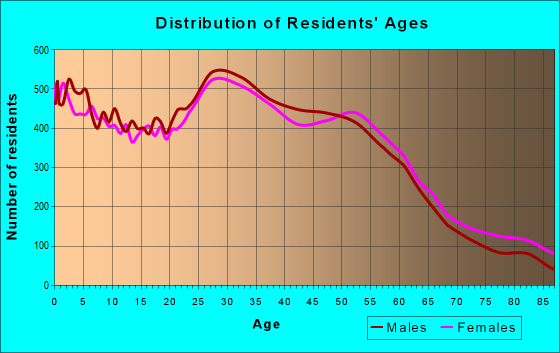
Estimated zip code population in 2022: 66,841 Zip code population in 2010: 61,635 Zip code population in 2000: 60,254
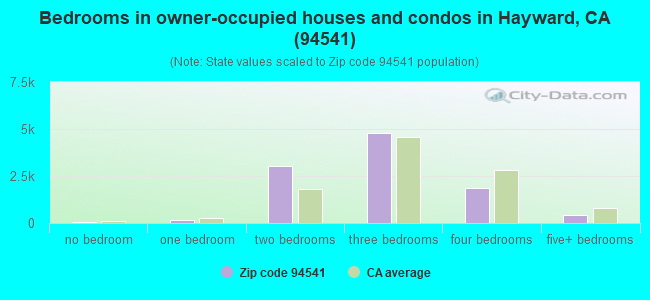
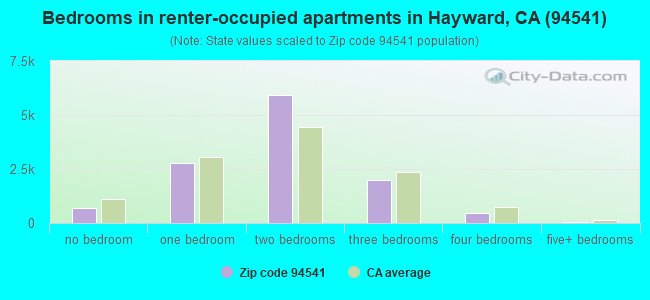
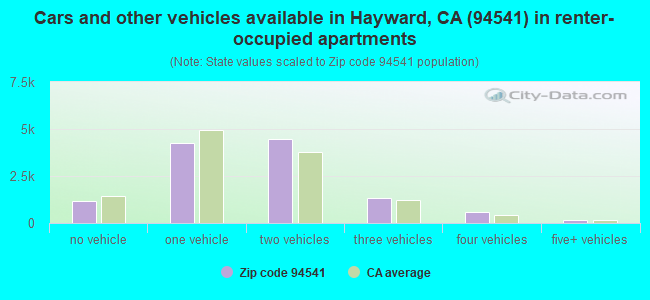
Houses and condos: 23,602 Renter-occupied apartments: 11,962
% of renters here:
54%
State:
44%
March 2022 cost of living index in zip code 94541: 119.2 (more than average, U.S. average is 100)
Land area: 7.4 sq. mi. Water area: 0.0 sq. mi.
Population density: 8,996 people per square mile
(high).
OSM Map
General Map
Google Map
MSN Map
OSM Map
General Map
Google Map
MSN Map
OSM Map
General Map
Google Map
MSN Map
OSM Map
General Map
Google Map
MSN Map
Please wait while loading the map...
Real estate property taxes paid for housing units in 2022:
This zip code:
0.7% ($5,530)
California:
0.7% ($4,831)
Median real estate property taxes paid for housing units with mortgages in 2022: $6,237 (0.8%) Median real estate property taxes paid for housing units with no mortgage in 2022: $4,189 (0.5%)
Averages for the 2020 tax year for zip code 94541, filed in 2021:
Average Adjusted Gross Income (AGI) in 2020: $68,249 (Individual Income Tax Returns)
Here:
$68,249
State:
$95,910
Salary/wage: $64,978 (reported on 85.9% of returns)
Here:
$64,978
State:
$77,331
(% of AGI for various income ranges: 1300.6% for AGIs below $25k, 4284.5% for AGIs $25k-50k, 7868.4% for AGIs $50k-75k, 11338.3% for AGIs $75k-100k, 20458.7% for AGIs $100k-200k, 79774.5% for AGIs over 200k)
Taxable interest for individuals: $683 (reported on 27.0% of returns)
This zip code:
$683
California:
$2,294
(% of AGI for various income ranges: 10.6% for AGIs below $25k, 13.0% for AGIs $25k-50k, 16.4% for AGIs $50k-75k, 24.1% for AGIs $75k-100k, 61.7% for AGIs $100k-200k, 381.7% for AGIs over 200k)
Ordinary dividends: $3,064 (reported on 12.1% of returns)
Here:
$3,064
State:
$10,949
(% of AGI for various income ranges: 12.7% for AGIs below $25k, 13.4% for AGIs $25k-50k, 30.8% for AGIs $50k-75k, 54.2% for AGIs $75k-100k, 125.1% for AGIs $100k-200k, 998.3% for AGIs over 200k)
Net capital gain/loss in AGI: +$10,351 (reported on 12.7% of returns)
Here:
+$10,351
State:
+$49,306
(% of AGI for various income ranges: 13.0% for AGIs below $25k, 15.0% for AGIs $25k-50k, 59.7% for AGIs $50k-75k, 112.3% for AGIs $75k-100k, 342.9% for AGIs $100k-200k, 5709.8% for AGIs over 200k)
Profit/loss from business: +$10,608 (reported on 16.5% of returns)
Here:
+$10,608
State:
+$15,671
(% of AGI for various income ranges: 210.0% for AGIs below $25k, 224.1% for AGIs $25k-50k, 177.4% for AGIs $50k-75k, 287.2% for AGIs $75k-100k, 414.5% for AGIs $100k-200k, 1698.3% for AGIs over 200k)
Taxable individual retirement arrangement distribution: $18,280 (reported on 3.6% of returns)
94541:
$18,280
California:
$23,505
(% of AGI for various income ranges: 27.7% for AGIs below $25k, 35.2% for AGIs $25k-50k, 64.4% for AGIs $50k-75k, 130.0% for AGIs $75k-100k, 258.8% for AGIs $100k-200k, 1070.2% for AGIs over 200k)
Self-employed (Keogh) retirement plans: $19,271 (reported on 0.2% of returns)
94541:
$19,271
California:
$30,163
(% of AGI for various income ranges: 3.9% for AGIs $25k-50k, 10.8% for AGIs $100k-200k, 176.4% for AGIs over 200k)
Total itemized deductions: $30,498 (reported on 13.8% of returns)
Here:
$30,498
State:
$39,517
(% of AGI for various income ranges: 74.8% for AGIs below $25k, 174.3% for AGIs $25k-50k, 396.1% for AGIs $50k-75k, 920.9% for AGIs $75k-100k, 1971.0% for AGIs $100k-200k, 6957.0% for AGIs over 200k)
Charity contributions: $5,196 (reported on 10.3% of returns)
Here:
$5,196
State:
$12,598
(% of AGI for various income ranges: 3.6% for AGIs below $25k, 13.7% for AGIs $25k-50k, 43.2% for AGIs $50k-75k, 115.0% for AGIs $75k-100k, 250.7% for AGIs $100k-200k, 1119.4% for AGIs over 200k)
Taxes paid: $9,207 (reported on 13.8% of returns)
94541:
$9,207
State:
$8,807
(% of AGI for various income ranges: 18.8% for AGIs below $25k, 52.1% for AGIs $25k-50k, 121.9% for AGIs $50k-75k, 305.6% for AGIs $75k-100k, 641.1% for AGIs $100k-200k, 1730.9% for AGIs over 200k)
Earned income credit: $1,879 (reported on 11.9% of returns)
Here:
$1,879
State:
$2,074
(% of AGI for various income ranges: 79.0% for AGIs below $25k, 51.4% for AGIs $25k-50k, 0.7% for AGIs $50k-75k)
Percentage of individuals using paid preparers for their 2020 taxes: 91.8%
Here:
92%
State:
92%
(% for various income ranges: 89.5% for AGIs below $25k, 92.0% for AGIs $25k-50k, 92.6% for AGIs $50k-75k, 92.4% for AGIs $75k-100k, 93.1% for AGIs $100k-200k, 95.2% for AGIs over 200k)
Averages for the 2012 tax year for zip code 94541, filed in 2013:
Average Adjusted Gross Income (AGI) in 2012: $46,645 (Individual Income Tax Returns)
Here:
$46,645
State:
$72,726
Salary/wage: $44,748 (reported on 86.7% of returns)
Here:
$44,748
State:
$59,079
(% of AGI for various income ranges: 76.7% for AGIs below $25k, 85.8% for AGIs $25k-50k, 85.7% for AGIs $50k-75k, 84.6% for AGIs $75k-100k, 84.3% for AGIs $100k-200k, 69.9% for AGIs over 200k)
Taxable interest for individuals: $580 (reported on 26.4% of returns)
This zip code:
$580
California:
$2,146
(% of AGI for various income ranges: 0.4% for AGIs below $25k, 0.3% for AGIs $25k-50k, 0.2% for AGIs $50k-75k, 0.3% for AGIs $75k-100k, 0.3% for AGIs $100k-200k, 0.8% for AGIs over 200k)
Ordinary dividends: $2,986 (reported on 9.7% of returns)
Here:
$2,986
State:
$9,308
(% of AGI for various income ranges: 0.6% for AGIs below $25k, 0.4% for AGIs $25k-50k, 0.5% for AGIs $50k-75k, 0.6% for AGIs $75k-100k, 0.6% for AGIs $100k-200k, 1.8% for AGIs over 200k)
Net capital gain/loss in AGI: +$3,214 (reported on 8.2% of returns)
Here:
+$3,214
State:
+$30,460
(% of AGI for various income ranges: 0.2% for AGIs $50k-75k, 0.3% for AGIs $75k-100k, 0.7% for AGIs $100k-200k, 4.7% for AGIs over 200k)
Profit/loss from business: +$11,329 (reported on 14.3% of returns)
Here:
+$11,329
State:
+$17,064
(% of AGI for various income ranges: 10.8% for AGIs below $25k, 3.2% for AGIs $25k-50k, 2.5% for AGIs $50k-75k, 1.6% for AGIs $75k-100k, 1.8% for AGIs $100k-200k, 5.7% for AGIs over 200k)
Taxable individual retirement arrangement distribution: $14,044 (reported on 4.7% of returns)
94541:
$14,044
California:
$19,557
(% of AGI for various income ranges: 1.2% for AGIs below $25k, 1.1% for AGIs $25k-50k, 1.3% for AGIs $50k-75k, 1.4% for AGIs $75k-100k, 1.5% for AGIs $100k-200k, 2.8% for AGIs over 200k)
Self-employment retirement plans: $12,757 (reported on 0.3% of returns)
94541:
$12,757
California:
$24,530
Total itemized deductions: $22,711 (26% of AGI, reported on 28.0% of returns)
Here:
$22,711
State:
$34,004
Here:
26.3% of AGI
State:
22.7% of AGI
(% of AGI for various income ranges: 7.6% for AGIs below $25k, 8.3% for AGIs $25k-50k, 12.9% for AGIs $50k-75k, 16.7% for AGIs $75k-100k, 18.7% for AGIs $100k-200k, 17.4% for AGIs over 200k)
Charity contributions: $2,669 (reported on 21.5% of returns)
Here:
$2,669
State:
$4,659
(% of AGI for various income ranges: 0.3% for AGIs below $25k, 0.7% for AGIs $25k-50k, 1.2% for AGIs $50k-75k, 1.4% for AGIs $75k-100k, 1.8% for AGIs $100k-200k, 1.7% for AGIs over 200k)
Taxes paid: $7,759 (reported on 27.8% of returns)
94541:
$7,759
State:
$14,448
(% of AGI for various income ranges: 1.7% for AGIs below $25k, 2.0% for AGIs $25k-50k, 3.6% for AGIs $50k-75k, 5.7% for AGIs $75k-100k, 7.3% for AGIs $100k-200k, 8.6% for AGIs over 200k)
Earned income credit: $2,164 (reported on 18.8% of returns)
Here:
$2,164
State:
$2,286
(% of AGI for various income ranges: 6.2% for AGIs below $25k, 0.9% for AGIs $25k-50k)
Percentage of individuals using paid preparers for their 2012 taxes: 62.0%
Here:
62%
State:
64%
(% for various income ranges: 60.4% for AGIs below $25k, 63.9% for AGIs $25k-50k, 62.0% for AGIs $50k-75k, 62.7% for AGIs $75k-100k, 61.5% for AGIs $100k-200k, 66.7% for AGIs over 200k)
Averages for the 2004 tax year for zip code 94541, filed in 2005:
Average Adjusted Gross Income (AGI) in 2004: $42,830 (Individual Income Tax Returns)
Here:
$42,830
State:
$58,600
Salary/wage: $41,141 (reported on 86.6% of returns)
Here:
$41,141
State:
$49,455
(% of AGI for various income ranges: 110.0% for AGIs below $10k, 78.5% for AGIs $10k-25k, 87.7% for AGIs $25k-50k, 87.0% for AGIs $50k-75k, 86.1% for AGIs $75k-100k, 73.5% for AGIs over 100k)
Taxable interest for individuals: $1,295 (reported on 37.5% of returns)
This zip code:
$1,295
California:
$2,365
(% of AGI for various income ranges: 4.3% for AGIs below $10k, 1.4% for AGIs $10k-25k, 0.7% for AGIs $25k-50k, 0.8% for AGIs $50k-75k, 1.0% for AGIs $75k-100k, 1.7% for AGIs over 100k)
Taxable dividends: $1,826 (reported on 14.1% of returns)
Here:
$1,826
State:
$4,746
(% of AGI for various income ranges: 2.5% for AGIs below $10k, 0.8% for AGIs $10k-25k, 0.4% for AGIs $25k-50k, 0.5% for AGIs $50k-75k, 0.5% for AGIs $75k-100k, 0.8% for AGIs over 100k)
Net capital gain/loss: +$9,027 (reported on 12.0% of returns)
Here:
+$9,027
State:
+$23,418
(% of AGI for various income ranges: -1.2% for AGIs below $10k, 0.2% for AGIs $10k-25k, 0.3% for AGIs $25k-50k, 0.4% for AGIs $50k-75k, 0.9% for AGIs $75k-100k, 9.1% for AGIs over 100k)
Profit/loss from business: +$12,595 (reported on 13.0% of returns)
Here:
+$12,595
State:
+$16,826
(% of AGI for various income ranges: 16.1% for AGIs below $10k, 6.8% for AGIs $10k-25k, 3.2% for AGIs $25k-50k, 2.7% for AGIs $50k-75k, 2.1% for AGIs $75k-100k, 4.9% for AGIs over 100k)
IRA payment deduction: $2,943 (reported on 1.8% of returns)
94541:
$2,943
California:
$3,192
(% of AGI for various income ranges: 0.4% for AGIs below $10k, 0.1% for AGIs $10k-25k, 0.1% for AGIs $25k-50k, 0.1% for AGIs $50k-75k, 0.1% for AGIs $75k-100k, 0.1% for AGIs over 100k)
Self-employed pension: $12,481 (reported on 0.6% of returns)
Here:
$12,481
California:
$17,688
(% of AGI for various income ranges: 0.2% for AGIs below $10k, 0.1% for AGIs $25k-50k, 0.1% for AGIs $50k-75k, 0.1% for AGIs $75k-100k, 0.4% for AGIs over 100k)
Total itemized deductions: $22,681 (31% of AGI, reported on 33.1% of returns)
Here:
$22,681
State:
$28,113
Here:
31.0% of AGI
State:
25.3% of AGI
(% of AGI for various income ranges: 20.6% for AGIs below $10k, 10.6% for AGIs $10k-25k, 13.3% for AGIs $25k-50k, 19.8% for AGIs $50k-75k, 22.1% for AGIs $75k-100k, 19.9% for AGIs over 100k)
Charity contributions deductions: $2,528 (3% of AGI, reported on 28.0% of returns)
Here:
$2,528
State:
$3,923
Here:
3.3% of AGI
State:
3.3% of AGI
(% of AGI for various income ranges: 0.8% for AGIs below $10k, 0.8% for AGIs $10k-25k, 1.0% for AGIs $25k-50k, 1.6% for AGIs $50k-75k, 2.0% for AGIs $75k-100k, 2.5% for AGIs over 100k)
Total tax: $5,402 (reported on 75.3% of returns)
94541:
$5,402
State:
$10,761
(% of AGI for various income ranges: 4.8% for AGIs below $10k, 4.0% for AGIs $10k-25k, 6.7% for AGIs $25k-50k, 8.8% for AGIs $50k-75k, 10.2% for AGIs $75k-100k, 15.2% for AGIs over 100k)
Earned income credit: $1,620 (reported on 14.2% of returns)
Here:
$1,620
State:
$1,763
Percentage of individuals using paid preparers for their 2004 taxes: 65.6%
Here:
66%
State:
66%
(% for various income ranges: 60.0% for AGIs below $10k, 69.8% for AGIs $10k-25k, 65.6% for AGIs $25k-50k, 65.4% for AGIs $50k-75k, 64.5% for AGIs $75k-100k, 65.7% for AGIs over 100k)
Likely homosexual households (counted as self-reported same-sex unmarried-partner households)
Lesbian couples: 0.5% of all households
Gay men: 0.4% of all households
Household received Food Stamps/SNAP in the past 12 months: 3,319 Household did not receive Food Stamps/SNAP in the past 12 months: 19,130
Women who had a birth in the past 12 months: 924 (780 now married, 141 unmarried) Women who did not have a birth in the past 12 months: 15,196 (5,702 now married, 9,508 unmarried)
Housing units in zip code 94541 with a mortgage: 7,421 (453 second mortgage, 34 home equity loan, 311 both second mortgage and home equity loan) Houses without a mortgage: 156
Median monthly owner costs for units with a mortgage: $2,933 Median monthly owner costs for units without a mortgage: $832
Residents with income below the poverty level in 2022:
This zip code:
11.2%
Whole state:
12.2%
Residents with income below 50% of the poverty level in 2022:
This zip code:
5.2%
Whole state:
6.2%
Median number of rooms in houses and condos:
Here:
5.4
State:
6.0
Median number of rooms in apartments:
Here:
3.8
State:
3.9
Notable locations in this zip code not listed on our city pages
Notable locations in zip code 94541: Veterans Memorial Building (A), Hayward City Hall (B), Hayward Public Library (C), Centennial Hall (D), Hayward Fire Department Station 9 (E), Hayward Fire Department Station 6 (F), Hayward Fire Department Station 1 (G), Alameda County Fire Department Station 2 (H). Display/hide their locations on the map
Churches in zip code 94541 include: Seventh Day Adventist Church (A), Pentecostal Church (B), Four Square Church (C), First Christian Church (D), First Baptist Church (E), Eden Congregational Church (F), The Church of Jesus Christ of Latter Day Saints (G), Church of Christ (H), Bethel Assembly of God Church (I). Display/hide their locations on the map
Parks in zip code 94541 include: John F Kennedy Park (1), Centennial Center Botany Grounds (2), Cherryland Park (3), DeAnza Park (4), East Avenue Park (5), Fairview Park (6), Meek Park (7), San Felipe Park (8), Sulphur Creek Park (9). Display/hide their locations on the map
8,316 married couples with children.
3,374 single-parent households (1,068 men, 2,306 women).
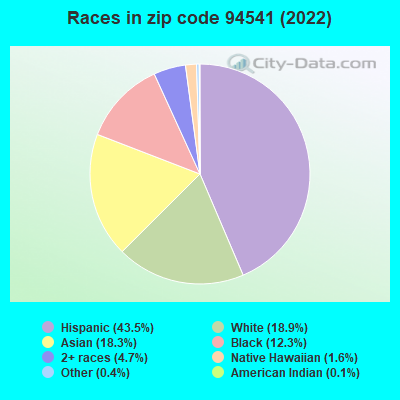
47.3% of residents of 94541 zip code speak English at home.
34.7% of residents speak Spanish at home (59% very well, 19% well, 17% not well, 5% not at all).
4.9% of residents speak other Indo-European language at home (67% very well, 17% well, 15% not well, 1% not at all).
12.0% of residents speak Asian or Pacific Island language at home (55% very well, 27% well, 11% not well, 7% not at all).
1.1% of residents speak other language at home (86% very well, 9% well, 5% not well).
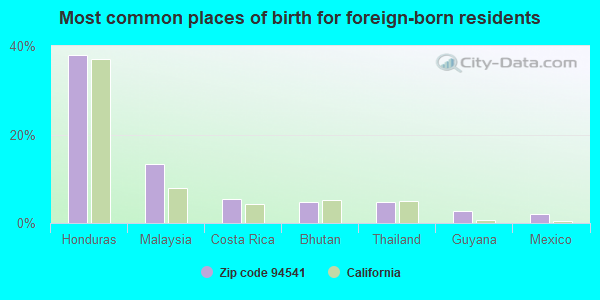
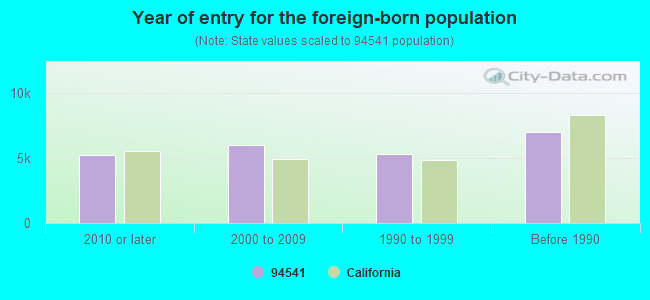
Foreign born population: 22,198 (33.2%) (53.8% of them are naturalized citizens)
Major facilities with environmental interests located in this zip code:
MERVYNS M C S (22301 FOOTHILL BLVD in HAYWARD, CA)
STATE MASTER (California - Hazardous Waste Tracking) - HAZARDOU WASTE PROGRAM Small Quantity Generators, between 100 kg and 1000 kg of hazardous waste/month (Resource Conservation and Recovery Act (tracking hazardous waste)) - notification Organizations: MERVYNS LLC (CONTACT/OPERATOR)
, LUBERT ADLER MGMT INC (CONTACT/OWNER)
HAYWARD AUTO IMPORTS INC (20095 MISSION BLVD in HAYWARD, CA)
STATE MASTER (California - Hazardous Waste Tracking) - HAZARDOU WASTE PROGRAM CRITERIA AND HAZARDOUS AIR POLLUTANT INVENTORY (Inventory of air pollution sources) Small Quantity Generators, between 100 kg and 1000 kg of hazardous waste/month (Resource Conservation and Recovery Act (tracking hazardous waste)) - notification Business SIC classification: AUTO AND HOME SUPPLY STORES
HAYWARD HIGH (1633 EAST AVE. in HAYWARD, CA)
(National Center for Education Statistics) - STATE ID-0133629 Organizations: HAYWARD UNIFIED (SCHOOL DISTRICT)
LONGWOOD ELEMENTARY (850 LONGWOOD AVE. in HAYWARD, CA)
(National Center for Education Statistics) - STATE ID-6001044 Organizations: HAYWARD UNIFIED (SCHOOL DISTRICT)
CHERRYLAND ELEMENTARY (585 WILLOW AVE. in HAYWARD, CA)
(National Center for Education Statistics) - STATE ID-6000913 Organizations: HAYWARD UNIFIED (SCHOOL DISTRICT)
EAST AVENUE ELEMENTARY (2424 EAST AVE. in HAYWARD, CA)
(National Center for Education Statistics) - STATE ID-6000921 Organizations: HAYWARD UNIFIED (SCHOOL DISTRICT)
FAIRVIEW ELEMENTARY (23515 MAUD AVE. in HAYWARD, CA)
(National Center for Education Statistics) - STATE ID-6000962 Organizations: HAYWARD UNIFIED (SCHOOL DISTRICT)
MARKHAM ELEMENTARY (1570 WARD ST. in HAYWARD, CA)
(National Center for Education Statistics) - STATE ID-6001069 Organizations: HAYWARD UNIFIED (SCHOOL DISTRICT)
LORENZO MANOR ELEMENTARY (18250 BENGAL ST. in HAYWARD, CA)
(National Center for Education Statistics) - STATE ID-6002653 Organizations: SAN LORENZO UNIFIED (SCHOOL DISTRICT)
AA'S DRIVE-IN DRY CLEANERS (206 A STREET in HAYWARD, CA)
CRITERIA AND HAZARDOUS AIR POLLUTANT INVENTORY (Inventory of air pollution sources) Small Quantity Generators, between 100 kg and 1000 kg of hazardous waste/month (Resource Conservation and Recovery Act (tracking hazardous waste)) - notification Business SIC classification: DRYCLEANING PLANTS, EXCEPT RUG CLEANING Organizations: ARTURO TORRES ERNESTO ARELLANO (CONTACT/OWNER)
Alternative names: A A CLEANERS
HAYWARD FD HOUSEHOLD HAZ WASTE TURN IN (1401 W WINTON AVE in HAYWARD, CA)
(Resource Conservation and Recovery Act (tracking hazardous waste)) Organizations: CITY OF FREMONT (CONTACT/OWNER)
LASERFORM INC (22359 MEEKLAND AVE in HAYWARD, CA)
CRITERIA AND HAZARDOUS AIR POLLUTANT INVENTORY (Inventory of air pollution sources) Small Quantity Generators, between 100 kg and 1000 kg of hazardous waste/month (Resource Conservation and Recovery Act (tracking hazardous waste)) - notification Business SIC classification: WOOD HOUSEHOLD FURNITURE, EXCEPT UPHOLSTERED Organizations: LABER THOMAS (CONTACT/OWNER)
LEADER CLEANERS (1147 B STREET in HAYWARD, CA)
CRITERIA AND HAZARDOUS AIR POLLUTANT INVENTORY (Inventory of air pollution sources) Small Quantity Generators, between 100 kg and 1000 kg of hazardous waste/month (Resource Conservation and Recovery Act (tracking hazardous waste)) - notification Business SIC classification: DRYCLEANING PLANTS, EXCEPT RUG CLEANING Organizations: KUM CHU PAK (CONTACT/OWNER)
Housing units lacking complete plumbing facilities: 0.7% Housing units lacking complete kitchen facilities: 2.1%
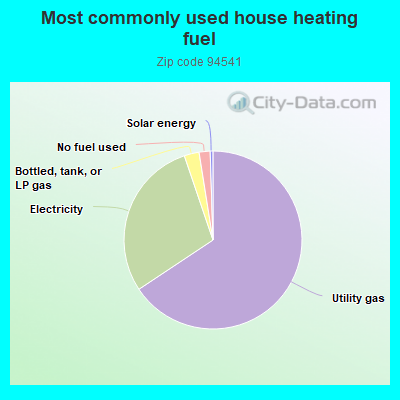
65.6%Utility gas
29.1%Electricity
2.7%Bottled, tank, or LP gas
2.0%No fuel used
0.5%Solar energy
Population in 1990: 48,964. Population change in the 1990s: +11,290 (+23.1%).
Place of birth for U.S.-born residents:
This state: 36,995
Northeast: 1,149
Midwest: 1,742
South: 2,329
West: 1,261
54% of the 94541 zip code residents lived in the same house 5 years ago. Out of people who lived in different houses, 67% lived in this county. Out of people who lived in different counties, 50% lived in California.
92% of the 94541 zip code residents lived in the same house 1 year ago. Out of people who lived in different houses, 60% moved from this county. Out of people who lived in different houses, 29% moved from different county within same state. Out of people who lived in different houses, 3% moved from different state. Out of people who lived in different houses, 9% moved from abroad.
Private vs. public school enrollment:
Students in private schools in grades 1 to 8 (elementary and middle school): 417
Here:
7.7%
California:
10.5%
Students in private schools in grades 9 to 12 (high school): 310
Here:
9.0%
California:
8.5%
Students in private undergraduate colleges: 364
Here:
11.5%
California:
15.9%
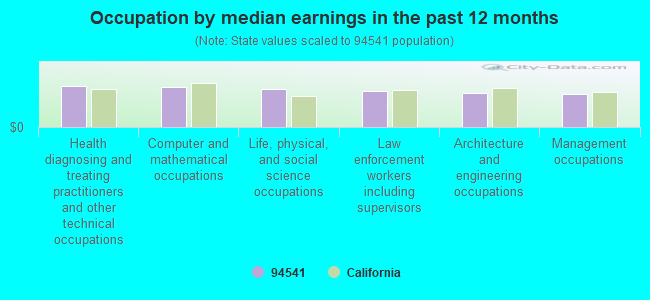
Occupation by median earnings in the past 12 months ($)
114,143Health diagnosing and treating practitioners and other technical occupations
110,252Computer and mathematical occupations
105,812Life, physical, and social science occupations
99,974Law enforcement workers including supervisors
95,154Architecture and engineering occupations
91,170Management occupations
Companies with federal contracts located in this zip code:
CALTECH SERVICE CORPORATION (1290 B ST STE 205 in HAYWARD, CA) : $416,038 in 2 contractsin 2000
$353,992 with Air Force for Maintenance, Repair or Alteration of Real Property -- Office Buildings. Signed on 2000-07-18. Completion date: 1999-12-31.
$62,046 with Air Force for Operation of Government-Owned Facilities -- Other Administrative Facilities and Service Buildings. Signed on 2000-08-09. Completion date: 1999-12-31.
ALAMEDA NEWSPAPERS, INC (22533 FOOTHILLS BLVD in HAYWARD, CA)
$10,500 with Navy for Advertising Services. Signed on 2005-01-28. Completion date: 2005-09-30.
Top industries in this zip code by the number of employees in 2005:
Health Care and Social Assistance: Nursing Care Facilities (100-249 employees: 2 establishments, 50-99 employees: 6 establishments, 20-49 employees: 2 establishments, 1-4 employees: 1 establishment)
Management of Companies and Enterprises: Corporate, Subsidiary, and Regional Managing Offices (500-999: 1, 20-49: 1, 10-19: 1, 1-4: 3)
2005 - 2018 National Fire Incident Reporting System (NFIRS) incidents
According to the data from the years 2005 - 2018 the average number of fire incidents per year is 37. The highest number of reported fires - 64 took place in 2017, and the least - 0 in 2013. The data has a declining trend.
When looking into fire subcategories, the most reports belonged to: Structure Fires (48.3%), and Outside Fires (33.1%).
Fire incident types reported to NFIRS in Zip Code 94541
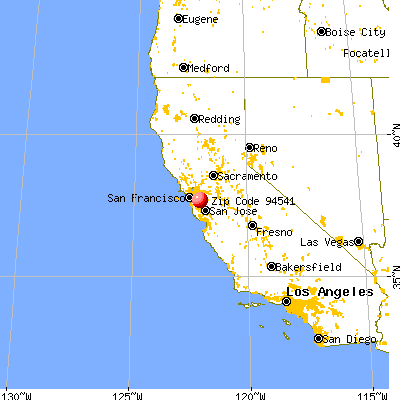


 Nearest zip codes: 94546, 94580, 94544, 94542, 94578, 94579.
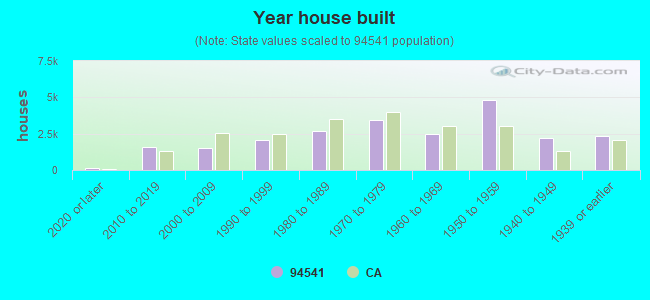


 According to the data from the years 2005 - 2018 the average number of fire incidents per year is 37. The highest number of reported fires - 64 took place in 2017, and the least - 0 in 2013. The data has a declining trend.
 When looking into fire subcategories, the most reports belonged to: Structure Fires (48.3%), and Outside Fires (33.1%).