Downtown Third Avenue District neighborhood in Chula Vista, California (CA), 91910 detailed profile
Settings
X


Business Search - 14 Million verified businesses
Area: 0.189 square miles
Population: 2,256
Population density:
| Downtown Third Avenue District: | 11,959 people per square mile |
| Chula Vista: | 5,711 people per square mile |

- 1,50364.5%Hispanic or Latino
- 33814.5%White
- 23610.1%Asian
- 1325.7%Black
- 662.8%American Indian
- 401.7%Two or more races
- 170.7%Native Hawaiian and Other
Pacific Islander

Median household income in 2022:
| Downtown Third Avenue District: | $60,475 |
| Chula Vista: | $101,190 |
Distribution of median household income
![Distribution of median household income]()
- 50Less than $10,000
- 135$10,000 to $19,999
- 89$20,000 to $29,999
- 190$30,000 to $39,999
- 108$40,000 to $49,999
- 60$50,000 to $59,999
- 154$60,000 to $74,999
- 82$75,000 to $99,999
- 51$100,000 to $124,999
- 33$125,000 to $149,999
- 67$150,000 to $199,999
- 15$200,000 or more

Distribution of owner-occupied house/condo value
![Distribution of owner-occupied house/condo value]()
- 11Less than $50,000
- 17$50,000 to $99,999
- 8$250,000 to $299,999
- 22$300,000 to $399,999
- 37$400,000 to $499,999
- 45$500,000 to $749,999
- 16$750,000 to $999,999
- 32$1,000,000 or more

Distribution of rent paid by renters
![Distribution of rent paid by renters]()
- 4Less than $100
- 12$100 to $199
- 38$200 to $299
- 109$300 to $399
- 7$400 to $499
- 28$500 to $599
- 13$600 to $699
- 17$700 to $799
- 13$800 to $899
- 16$900 to $999
- 93$1,000 to $1,249
- 164$1,250 to $1,499
- 280$1,500 to $1,999
- 266$2,000 or more

Median rent in 2022:
| Downtown Third Avenue District: | $1,441 |
| Chula Vista: | $1,879 |
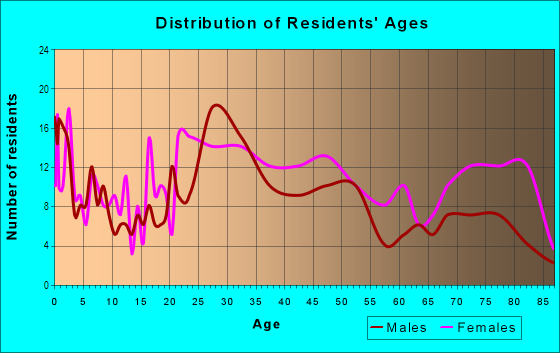
| Males: | 1,026 |
| Females: | 1,229 |
Males:
| This neighborhood: | 37.6 years |
| Whole city: | 34.8 years |
| This neighborhood: | 40.7 years |
| Whole city: | 37.4 years |
Average household size:
| Downtown Third Avenue District: | 2.6 people |
| Chula Vista: | 3.2 people |
Percentage of family households:
| Downtown Third Avenue District: | 34.1% |
| Chula Vista: | 57.2% |
| Here: | 30.2% |
| Chula Vista: | 54.5% |
Percentage of married-couple families with children (among all households):
| Downtown Third Avenue District: | 22.7% |
| Chula Vista: | 22.9% |
Percentage of single-mother households (among all households):
| Downtown Third Avenue District: | 20.0% |
| Chula Vista: | 5.5% |
Percentage of never married males 15 years old and over:
Percentage of never married females 15 years old and over:
| Downtown Third Avenue District: | 21.0% |
| Chula Vista: | 19.8% |
Percentage of never married females 15 years old and over:
| Downtown Third Avenue District: | 17.2% |
| city: | 16.5% |
Percentage of people that speak English not well or not at all:
| Downtown Third Avenue District: | 11.7% |
| Chula Vista: | 8.7% |
Percentage of people born in this state:
Percentage of people born in another U.S. state:
Percentage of native residents but born outside the U.S.:
Percentage of foreign born residents:
| Here: | 52.8% |
| Chula Vista: | 56.5% |
Percentage of people born in another U.S. state:
| Downtown Third Avenue District: | 11.4% |
| Chula Vista: | 13.1% |
Percentage of native residents but born outside the U.S.:
| Here: | 1.2% |
| city: | 2.8% |
Percentage of foreign born residents:
| Here: | 34.7% |
| Chula Vista: | 27.6% |

Owner-occupied
Renter-occupied


- Rooms in owner-occupied houses and condos in Downtown Third Avenue District
- 01 room
- 692 rooms
- 153 rooms
- 494 rooms
- 245 rooms
- 486 rooms
- 67 rooms
- 208 rooms
- 529+ rooms

- Rooms in renter-occupied apartments in Downtown Third Avenue District
- 1071 room
- 1782 rooms
- 2893 rooms
- 1744 rooms
- 825 rooms
- 316 rooms
- 57 rooms
- 208 rooms
- 69+ rooms
Owner-occupied
Renter-occupied

- Bedrooms in owner-occupied houses and condos in Downtown Third Avenue District
- 0no bedroom
- 61 bedroom
- 882 bedrooms
- 373 bedrooms
- 124 bedrooms
- 25+ bedrooms

- Bedrooms in renter-occupied apartments in Downtown Third Avenue District
- 123no bedroom
- 2611 bedroom
- 4172 bedrooms
- 613 bedrooms
- 74 bedrooms
- 65+ bedrooms
Average number of cars or other vehicles available in houses/condos:
Average number of cars or other vehicles available in apartments:
| This neighborhood: | 1.7 |
| Chula Vista: | 2.4 |
Average number of cars or other vehicles available in apartments:
| Here: | 1.3 |
| city: | 1.7 |
Percentage of units with a mortgage:
| Downtown Third Avenue District: | 65.2% |
| Chula Vista: | 76.0% |
Housing prices:
- Average estimated value of detached houses in 2022 (14.6% of all units):
Downtown Third Avenue District: $575,116 California: $988,808
- Average estimated '22 value of housing units in 5-or-more-unit structures (30.6% of all units):
Downtown Third Avenue District: $142,368 California: $730,996

- Year house built in Downtown Third Avenue District
- 102020 or later
- 922010 to 2019
- 222000 to 2009
- 81990 to 1999
- 2021980 to 1989
- 2681970 to 1979
- 1091960 to 1969
- 2311950 to 1959
- 651940 to 1949
- 1181939 or earlier

City-data.com crime index for city in 2020 (higher means more crime):
| City: | 159.8 |
| U.S. average: | 219.5 |
Travel time to work (commute)
![Travel time to work (commute)]()
- 14Less than 5 minutes
- 535 to 9 minutes
- 12410 to 14 minutes
- 13715 to 19 minutes
- 11620 to 24 minutes
- 4425 to 29 minutes
- 13430 to 34 minutes
- 3735 to 39 minutes
- 6240 to 44 minutes
- 9445 to 59 minutes
- 4360 to 89 minutes
- 5590 or more minutes

Means of transportation to work
![Means of transportation to work]()
- 72.2%742Drove a car alone
- 6.6%68Carpooled
- 4.5%46Bus
- 0.8%8Light rail, streetcar or trolley
- 1.0%10Motorcycle
- 0.5%5Bicycle
- 1.4%14Walked
- 5.3%54Other means
- 10.9%112Worked at home

Time leaving home to go to work
![Time leaving home to go to work]()
- 9312:00 a.m. to 4:59 a.m.
- 155:00 a.m. to 5:29 a.m.
- 495:30 a.m. to 5:59 a.m.
- 896:00 a.m. to 6:29 a.m.
- 676:30 a.m. to 6:59 a.m.
- 1737:00 a.m. to 7:29 a.m.
- 567:30 a.m. to 7:59 a.m.
- 1278:00 a.m. to 8:29 a.m.
- 348:30 a.m. to 8:59 a.m.
- 439:00 a.m. to 9:59 a.m.
- 4210:00 a.m. to 10:59 a.m.
- 711:00 a.m. to 11:59 a.m.
- 5612:00 p.m. to 3:59 p.m.
- 434:00 p.m. to 11:59 p.m.

Occupations of males:
- Percentage of males in management occupations (except farmers):
Here: 3.3% city: 9.9%
- Percentage of males in business and financial operations occupations:
Here: 11.0% city: 6.5%
- Percentage of males in architecture and engineering occupations:
Here: 3.6% city: 4.8%
- Percentage of males in life, physical, and social science occupations:
Here: 2.0% city: 1.2%
- Percentage of males in community and social services occupations:
Here: 1.5% city: 1.2%
- Percentage of males in education, training, and library occupations:
Here: 1.2% city: 2.3%
- Percentage of males in service occupations:
Here: 17.7% city: 18.4%
- Percentage of males in sales and office occupations:
Here: 23.5% city: 16.0%
- Percentage of males in construction, extraction, and maintenance occupations:
Here: 16.6% city: 9.2%
- Percentage of males in production occupations:
Here: 6.2% city: 5.7%
- Percentage of males in transportation occupations:
Here: 5.8% city: 5.1%
- Percentage of males in material moving occupations:
Here: 5.3% city: 3.7%
Occupations of females:
- Percentage of females in management occupations (except farmers):
Here: 9.7% city: 8.6%
- Percentage of females in business and financial operations occupations:
Here: 2.8% city: 5.6%
- Percentage of females in computer and mathematical occupations:
Here: 2.1% city: 1.2%
- Percentage of females in education, training, and library occupations:
Here: 7.0% city: 7.6%
- Percentage of females in arts, design, entertainment, sports, and media occupations:
Here: 1.1% city: 1.2%
- Percentage of females in healthcare practitioners and technical occupations:
Here: 11.2% city: 10.6%
- Percentage of females in service occupations:
Here: 27.1% city: 22.6%
- Percentage of females in sales and office occupations:
Here: 28.8% city: 29.5%
- Percentage of females in production occupations:
Here: 8.1% city: 3.0%
- Percentage of females in material moving occupations:
Here: 1.8% city: 1.7%
Percentage of people 16-64 in Armed Forces:
| Downtown Third Avenue District: | 6.3% |
| Chula Vista: | 4.1% |
Education in this neighborhood (subdivision or community):
- Percentage of people 3 years and older in K-12 schools:
Downtown Third Avenue District: 14.1% Chula Vista: 22.0%
- Percentage of people 3 years and older in undergraduate colleges:
Downtown Third Avenue District: 7.3% Chula Vista: 7.6%
- Percentage of people 3 years and older in grad. or professional schools:
Downtown Third Avenue District: 1.5% Chula Vista: 1.2%
- Percentage of students K-12 enrolled in private schools:
Downtown Third Avenue District: 28.6% Chula Vista: 7.0%
Percentage of population below poverty level:
| Downtown Third Avenue District: | 16.0% |
| Chula Vista: | 10.1% |
Median year owner moved in (as recorded in 2022):
Median year renter moved in (as recorded in 2022):
| Downtown Third Avenue District: | 2001 |
| Chula Vista: | 2011 |
Median year renter moved in (as recorded in 2022):
| Downtown Third Avenue District: | 2008 |
| Chula Vista: | 2018 |
Percentage of married-couple families with both working:
| Downtown Third Avenue District: | 90.7% |
| Chula Vista: | 69.2% |

- 55.9%Utility gas
- 27.8%Electricity
- 6.0%No fuel used
- 3.4%Wood
- 3.2%Other fuel
- 2.6%Solar energy
- 1.0%Bottled, tank, or LP gas
Roads and streets:
del Mar Ave
Length: 0.38 miles
Directions: N-S, SE-NW
Address range: 250 to 399
Directions: N-S, SE-NW
Address range: 250 to 399
3rd Ave
Length: 0.38 miles
Directions: N-S, SE-NW
Address range: 243 to 399
Directions: N-S, SE-NW
Address range: 243 to 399
Davidson St
Length: 0.36 miles
Direction: E-W
Address range: 250 to 372
Direction: E-W
Address range: 250 to 372
F St
Length: 0.30 miles
Direction: E-W
Address range: 248 to 350
Direction: E-W
Address range: 248 to 350
G St
Length: 0.30 miles
Direction: E-W
Address range: 240 to 348
Direction: E-W
Address range: 240 to 348
Garrett Ave
Length: 0.25 miles
Direction: N-S
Address range: 253 to 399
Direction: N-S
Address range: 253 to 399
Church Ave
Length: 0.22 miles
Direction: N-S
Address range: 250 to 369
Direction: N-S
Address range: 250 to 369
Landis Ave
Length: 0.19 miles
Directions: N-S, SE-NW
Address range: 250 to 319
Directions: N-S, SE-NW
Address range: 250 to 319
Madrona St
Length: 0.16 miles
Direction: E-W
Address range: 245 to 299
Direction: E-W
Address range: 245 to 299
Center St
Length: 0.15 miles
Direction: E-W
Address range: 250 to 299
Direction: E-W
Address range: 250 to 299
Park Way
Length: 0.15 miles
Direction: E-W
Address range: 300 to 349
Direction: E-W
Address range: 300 to 349
W Madrona St
Length: 0.09 miles
Direction: E-W
Direction: E-W