Estimated zip code population in 2022: 75,679 Zip code population in 2010: 75,802 Zip code population in 2000: 74,009
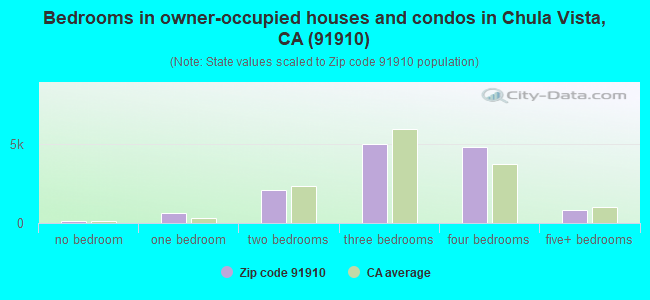
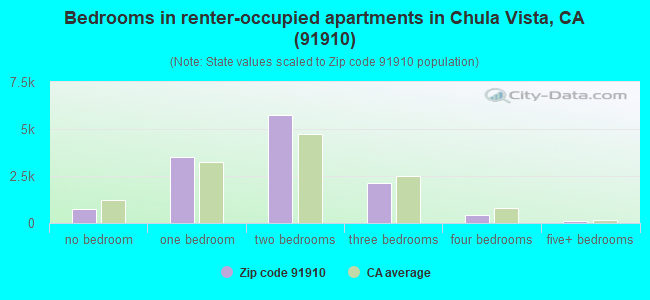
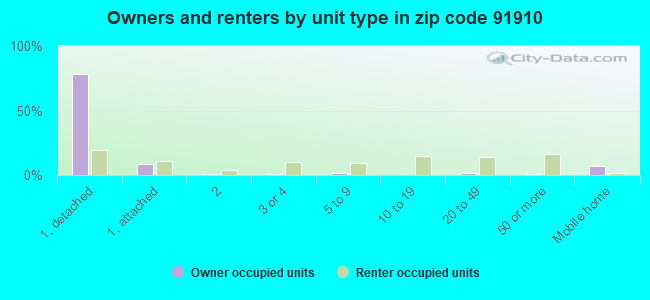
Houses and condos: 28,372 Renter-occupied apartments: 12,693
% of renters here:
49%
State:
44%
March 2022 cost of living index in zip code 91910: 122.2 (high, U.S. average is 100)
Land area: 12.2 sq. mi. Water area: 0.0 sq. mi.
Population density: 6,186 people per square mile
(high).
OSM Map
General Map
Google Map
MSN Map
OSM Map
General Map
Google Map
MSN Map
OSM Map
General Map
Google Map
MSN Map
OSM Map
General Map
Google Map
MSN Map
Please wait while loading the map...
Real estate property taxes paid for housing units in 2022:
This zip code:
0.6% ($4,263)
California:
0.7% ($4,831)
Median real estate property taxes paid for housing units with mortgages in 2022: $4,838 (0.7%) Median real estate property taxes paid for housing units with no mortgage in 2022: $2,892 (0.5%)
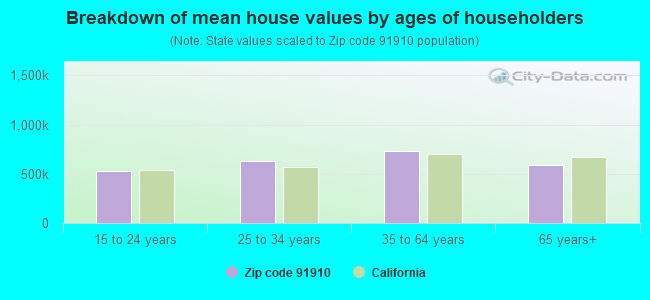
Estimated median house/condo value in 2022: $674,529
91910:
$674,529
California:
$715,900
According to our research of California and other state lists, there were 57 registered sex offenders living in 91910 zip code as of May 28, 2024. The ratio of all residents to sex offenders in zip code 91910 is 1,353 to 1. The ratio of registered sex offenders to all residents in this zip code is lower than the state average.
Median resident age:
This zip code:
39.0 years
California median age:
37.9 years
Average household size:
This zip code:
2.8 people
California:
2.8 people
Averages for the 2020 tax year for zip code 91910, filed in 2021:
Average Adjusted Gross Income (AGI) in 2020: $58,608 (Individual Income Tax Returns)
Here:
$58,608
State:
$95,910
Salary/wage: $51,115 (reported on 82.1% of returns)
Here:
$51,115
State:
$77,331
(% of AGI for various income ranges: 1133.0% for AGIs below $25k, 3712.0% for AGIs $25k-50k, 6960.0% for AGIs $50k-75k, 10357.8% for AGIs $75k-100k, 19533.4% for AGIs $100k-200k, 70426.5% for AGIs over 200k)
Taxable interest for individuals: $937 (reported on 26.7% of returns)
This zip code:
$937
California:
$2,294
(% of AGI for various income ranges: 9.2% for AGIs below $25k, 12.7% for AGIs $25k-50k, 25.4% for AGIs $50k-75k, 56.5% for AGIs $75k-100k, 110.6% for AGIs $100k-200k, 937.7% for AGIs over 200k)
Ordinary dividends: $5,125 (reported on 10.4% of returns)
Here:
$5,125
State:
$10,949
(% of AGI for various income ranges: 9.6% for AGIs below $25k, 16.0% for AGIs $25k-50k, 47.0% for AGIs $50k-75k, 79.6% for AGIs $75k-100k, 189.1% for AGIs $100k-200k, 3393.9% for AGIs over 200k)
Net capital gain/loss in AGI: +$13,149 (reported on 10.2% of returns)
Here:
+$13,149
State:
+$49,306
(% of AGI for various income ranges: 3.5% for AGIs below $25k, 13.7% for AGIs $25k-50k, 33.2% for AGIs $50k-75k, 118.1% for AGIs $75k-100k, 380.4% for AGIs $100k-200k, 12671.6% for AGIs over 200k)
Profit/loss from business: +$8,488 (reported on 15.4% of returns)
Here:
+$8,488
State:
+$15,671
(% of AGI for various income ranges: 151.7% for AGIs below $25k, 127.2% for AGIs $25k-50k, 142.3% for AGIs $50k-75k, 207.9% for AGIs $75k-100k, 395.0% for AGIs $100k-200k, 1990.6% for AGIs over 200k)
Taxable individual retirement arrangement distribution: $17,491 (reported on 4.9% of returns)
91910:
$17,491
California:
$23,505
(% of AGI for various income ranges: 23.1% for AGIs below $25k, 31.6% for AGIs $25k-50k, 96.6% for AGIs $50k-75k, 200.9% for AGIs $75k-100k, 517.6% for AGIs $100k-200k, 2332.6% for AGIs over 200k)
Self-employed (Keogh) retirement plans: $23,550 (reported on 0.1% of returns)
91910:
$23,550
California:
$30,163
(% of AGI for various income ranges: 17.8% for AGIs $100k-200k, 299.7% for AGIs over 200k)
Total itemized deductions: $31,365 (reported on 11.0% of returns)
Here:
$31,365
State:
$39,517
(% of AGI for various income ranges: 34.4% for AGIs below $25k, 99.5% for AGIs $25k-50k, 428.1% for AGIs $50k-75k, 972.0% for AGIs $75k-100k, 2241.7% for AGIs $100k-200k, 9121.9% for AGIs over 200k)
Charity contributions: $5,803 (reported on 8.9% of returns)
Here:
$5,803
State:
$12,598
(% of AGI for various income ranges: 2.0% for AGIs below $25k, 8.3% for AGIs $25k-50k, 49.0% for AGIs $50k-75k, 102.1% for AGIs $75k-100k, 335.1% for AGIs $100k-200k, 2147.7% for AGIs over 200k)
Taxes paid: $8,385 (reported on 11.0% of returns)
91910:
$8,385
State:
$8,807
(% of AGI for various income ranges: 7.6% for AGIs below $25k, 23.1% for AGIs $25k-50k, 108.7% for AGIs $50k-75k, 292.3% for AGIs $75k-100k, 665.5% for AGIs $100k-200k, 1817.7% for AGIs over 200k)
Earned income credit: $2,082 (reported on 18.5% of returns)
Here:
$2,082
State:
$2,074
(% of AGI for various income ranges: 96.6% for AGIs below $25k, 73.3% for AGIs $25k-50k, 1.5% for AGIs $50k-75k)
Percentage of individuals using paid preparers for their 2020 taxes: 93.4%
Here:
93%
State:
92%
(% for various income ranges: 92.3% for AGIs below $25k, 94.0% for AGIs $25k-50k, 94.2% for AGIs $50k-75k, 93.4% for AGIs $75k-100k, 93.4% for AGIs $100k-200k, 95.5% for AGIs over 200k)
Averages for the 2012 tax year for zip code 91910, filed in 2013:
Average Adjusted Gross Income (AGI) in 2012: $49,603 (Individual Income Tax Returns)
Here:
$49,603
State:
$72,726
Salary/wage: $44,216 (reported on 83.5% of returns)
Here:
$44,216
State:
$59,079
(% of AGI for various income ranges: 75.2% for AGIs below $25k, 81.8% for AGIs $25k-50k, 78.8% for AGIs $50k-75k, 75.9% for AGIs $75k-100k, 76.3% for AGIs $100k-200k, 51.6% for AGIs over 200k)
Taxable interest for individuals: $973 (reported on 28.1% of returns)
This zip code:
$973
California:
$2,146
(% of AGI for various income ranges: 0.6% for AGIs below $25k, 0.4% for AGIs $25k-50k, 0.5% for AGIs $50k-75k, 0.5% for AGIs $75k-100k, 0.5% for AGIs $100k-200k, 1.0% for AGIs over 200k)
Ordinary dividends: $5,090 (reported on 11.1% of returns)
Here:
$5,090
State:
$9,308
(% of AGI for various income ranges: 0.7% for AGIs below $25k, 0.6% for AGIs $25k-50k, 0.7% for AGIs $50k-75k, 0.8% for AGIs $75k-100k, 0.9% for AGIs $100k-200k, 3.8% for AGIs over 200k)
Net capital gain/loss in AGI: +$9,231 (reported on 9.0% of returns)
Here:
+$9,231
State:
+$30,460
(% of AGI for various income ranges: 0.2% for AGIs $50k-75k, 0.3% for AGIs $75k-100k, 0.8% for AGIs $100k-200k, 10.9% for AGIs over 200k)
Profit/loss from business: +$11,917 (reported on 13.8% of returns)
Here:
+$11,917
State:
+$17,064
(% of AGI for various income ranges: 10.0% for AGIs below $25k, 3.2% for AGIs $25k-50k, 2.2% for AGIs $50k-75k, 1.8% for AGIs $75k-100k, 2.0% for AGIs $100k-200k, 4.0% for AGIs over 200k)
Taxable individual retirement arrangement distribution: $14,277 (reported on 6.1% of returns)
91910:
$14,277
California:
$19,557
(% of AGI for various income ranges: 1.3% for AGIs below $25k, 1.1% for AGIs $25k-50k, 1.7% for AGIs $50k-75k, 2.1% for AGIs $75k-100k, 1.8% for AGIs $100k-200k, 2.5% for AGIs over 200k)
Self-employment retirement plans: $22,125 (reported on 0.2% of returns)
91910:
$22,125
California:
$24,530
(% of AGI for various income ranges: 0.1% for AGIs $25k-50k, 0.4% for AGIs over 200k)
Total itemized deductions: $25,799 (26% of AGI, reported on 28.0% of returns)
Here:
$25,799
State:
$34,004
Here:
25.9% of AGI
State:
22.7% of AGI
(% of AGI for various income ranges: 6.7% for AGIs below $25k, 9.2% for AGIs $25k-50k, 13.9% for AGIs $50k-75k, 17.6% for AGIs $75k-100k, 19.2% for AGIs $100k-200k, 17.4% for AGIs over 200k)
Charity contributions: $3,121 (reported on 22.5% of returns)
Here:
$3,121
State:
$4,659
(% of AGI for various income ranges: 0.4% for AGIs below $25k, 0.7% for AGIs $25k-50k, 1.3% for AGIs $50k-75k, 1.8% for AGIs $75k-100k, 2.0% for AGIs $100k-200k, 1.8% for AGIs over 200k)
Taxes paid: $8,773 (reported on 27.9% of returns)
91910:
$8,773
State:
$14,448
(% of AGI for various income ranges: 1.3% for AGIs below $25k, 2.4% for AGIs $25k-50k, 3.7% for AGIs $50k-75k, 5.2% for AGIs $75k-100k, 6.9% for AGIs $100k-200k, 9.0% for AGIs over 200k)
Earned income credit: $2,293 (reported on 23.0% of returns)
Here:
$2,293
State:
$2,286
(% of AGI for various income ranges: 7.5% for AGIs below $25k, 1.4% for AGIs $25k-50k)
Percentage of individuals using paid preparers for their 2012 taxes: 65.2%
Here:
65%
State:
64%
(% for various income ranges: 63.2% for AGIs below $25k, 64.5% for AGIs $25k-50k, 66.7% for AGIs $50k-75k, 67.1% for AGIs $75k-100k, 69.6% for AGIs $100k-200k, 79.6% for AGIs over 200k)
Averages for the 2004 tax year for zip code 91910, filed in 2005:
Average Adjusted Gross Income (AGI) in 2004: $42,488 (Individual Income Tax Returns)
Here:
$42,488
State:
$58,600
Salary/wage: $38,942 (reported on 84.3% of returns)
Here:
$38,942
State:
$49,455
(% of AGI for various income ranges: 153.5% for AGIs below $10k, 80.2% for AGIs $10k-25k, 83.8% for AGIs $25k-50k, 79.7% for AGIs $50k-75k, 80.5% for AGIs $75k-100k, 65.2% for AGIs over 100k)
Taxable interest for individuals: $1,482 (reported on 40.2% of returns)
This zip code:
$1,482
California:
$2,365
(% of AGI for various income ranges: 5.2% for AGIs below $10k, 1.4% for AGIs $10k-25k, 1.1% for AGIs $25k-50k, 1.1% for AGIs $50k-75k, 0.9% for AGIs $75k-100k, 1.9% for AGIs over 100k)
Taxable dividends: $2,597 (reported on 15.3% of returns)
Here:
$2,597
State:
$4,746
(% of AGI for various income ranges: 3.5% for AGIs below $10k, 0.9% for AGIs $10k-25k, 0.6% for AGIs $25k-50k, 0.8% for AGIs $50k-75k, 0.7% for AGIs $75k-100k, 1.3% for AGIs over 100k)
Net capital gain/loss: +$10,864 (reported on 12.7% of returns)
Here:
+$10,864
State:
+$23,418
(% of AGI for various income ranges: -1.9% for AGIs below $10k, -0.2% for AGIs $10k-25k, 0.3% for AGIs $25k-50k, 0.7% for AGIs $50k-75k, 1.2% for AGIs $75k-100k, 9.6% for AGIs over 100k)
Profit/loss from business: +$13,951 (reported on 13.1% of returns)
Here:
+$13,951
State:
+$16,826
(% of AGI for various income ranges: 14.9% for AGIs below $10k, 6.3% for AGIs $10k-25k, 3.4% for AGIs $25k-50k, 3.2% for AGIs $50k-75k, 2.7% for AGIs $75k-100k, 5.4% for AGIs over 100k)
Profit/loss from farming: +$1,143 (reported on 0.0% of returns)
Here:
+$1,143
State:
-$7,562
IRA payment deduction: $2,797 (reported on 2.0% of returns)
91910:
$2,797
California:
$3,192
(% of AGI for various income ranges: 0.2% for AGIs below $10k, 0.1% for AGIs $10k-25k, 0.2% for AGIs $25k-50k, 0.2% for AGIs $50k-75k, 0.1% for AGIs $75k-100k, 0.1% for AGIs over 100k)
Self-employed pension: $14,979 (reported on 0.5% of returns)
Here:
$14,979
California:
$17,688
(% of AGI for various income ranges: 0.1% for AGIs $25k-50k, 0.1% for AGIs $50k-75k, 0.2% for AGIs $75k-100k, 0.4% for AGIs over 100k)
Total itemized deductions: $26,977 (34% of AGI, reported on 32.0% of returns)
Here:
$26,977
State:
$28,113
Here:
33.7% of AGI
State:
25.3% of AGI
(% of AGI for various income ranges: 17.1% for AGIs below $10k, 8.2% for AGIs $10k-25k, 16.5% for AGIs $25k-50k, 30.5% for AGIs $50k-75k, 23.7% for AGIs $75k-100k, 19.9% for AGIs over 100k)
Charity contributions deductions: $2,832 (3% of AGI, reported on 27.4% of returns)
Here:
$2,832
State:
$3,923
Here:
3.4% of AGI
State:
3.3% of AGI
(% of AGI for various income ranges: 0.6% for AGIs below $10k, 0.6% for AGIs $10k-25k, 1.2% for AGIs $25k-50k, 2.0% for AGIs $50k-75k, 2.5% for AGIs $75k-100k, 2.4% for AGIs over 100k)
Total tax: $5,430 (reported on 73.8% of returns)
91910:
$5,430
State:
$10,761
(% of AGI for various income ranges: 5.4% for AGIs below $10k, 4.0% for AGIs $10k-25k, 6.1% for AGIs $25k-50k, 8.1% for AGIs $50k-75k, 9.0% for AGIs $75k-100k, 15.3% for AGIs over 100k)
Earned income credit: $1,762 (reported on 17.9% of returns)
Here:
$1,762
State:
$1,763
Percentage of individuals using paid preparers for their 2004 taxes: 69.6%
Here:
70%
State:
66%
(% for various income ranges: 63.8% for AGIs below $10k, 71.5% for AGIs $10k-25k, 69.5% for AGIs $25k-50k, 70.3% for AGIs $50k-75k, 71.0% for AGIs $75k-100k, 73.1% for AGIs over 100k)
Likely homosexual households (counted as self-reported same-sex unmarried-partner households)
Lesbian couples: 0.1% of all households
Gay men: 0.0% of all households
Household received Food Stamps/SNAP in the past 12 months: 3,653 Household did not receive Food Stamps/SNAP in the past 12 months: 22,576
Women who had a birth in the past 12 months: 671 (469 now married, 201 unmarried) Women who did not have a birth in the past 12 months: 16,047 (6,400 now married, 9,645 unmarried)
Housing units in zip code 91910 with a mortgage: 9,141 (1,262 second mortgage, 63 home equity loan, 1,037 both second mortgage and home equity loan) Houses without a mortgage: 134
Median monthly owner costs for units with a mortgage: $2,561 Median monthly owner costs for units without a mortgage: $613
Residents with income below the poverty level in 2022:
This zip code:
11.1%
Whole state:
12.2%
Residents with income below 50% of the poverty level in 2022:
This zip code:
4.7%
Whole state:
6.2%
Median number of rooms in houses and condos:
Here:
5.9
State:
6.0
Median number of rooms in apartments:
Here:
3.6
State:
3.9
Notable locations in this zip code not listed on our city pages
Notable locations in zip code 91910: Chula Vista Junction (A), Chula Vista Library (B), Chula Vista Chamber of Commerce (C), Chula Vista Nature Interpretive Center (D), Chula Vista Fire Department Station 4 (E), Chula Vista Fire Department Station 2 (F), Chula Vista Fire Department Station 1 (G), Lutheran Social Services Building (H), Civic Center Branch Chula Vista City Library (I), Chula Vista Convention and Visitors Bureau (J). Display/hide their locations on the map
Shopping Centers: Chula Vista Square Shopping Center (1), Broadway Village Shopping Center (2), Park Plaza Shopping Center (3), Chula Vista Shopping Center (4), Terra Nova Plaza Shopping Center (5), Rancho del Rey Shopping Center (6), Canyon Plaza Shopping Center (7). Display/hide their locations on the map
Churches in zip code 91910 include: Assembly of God Church (A), Church of the Nazarene (B), First Christian Church (C), First Church of Christ (D), First Church of Christ Scientist (E), First Community Congregational Church (F), First Methodist Church (G), Pilgrim Lutheran Church (H), Saint Johns Episcopal Church (I). Display/hide their locations on the map
Parks in zip code 91910 include: Chula Vista Bay Front Park (1), Marina View Park (2), General Roca Park (3), Memorial Park (4), Norman Park (5), Sweetwater Marsh National Wildlife Refuge (6), Bayside Park (7), Halecrest Park (8), Paseo del Ray Park (9). Display/hide their locations on the map
9,037 married couples with children.
4,534 single-parent households (870 men, 3,664 women).
43.0% of residents of 91910 zip code speak English at home.
48.9% of residents speak Spanish at home (66% very well, 18% well, 13% not well, 3% not at all).
0.8% of residents speak other Indo-European language at home (76% very well, 18% well, 6% not well).
6.6% of residents speak Asian or Pacific Island language at home (58% very well, 29% well, 10% not well, 3% not at all).
0.7% of residents speak other language at home (94% very well, 4% well, 1% not at all).
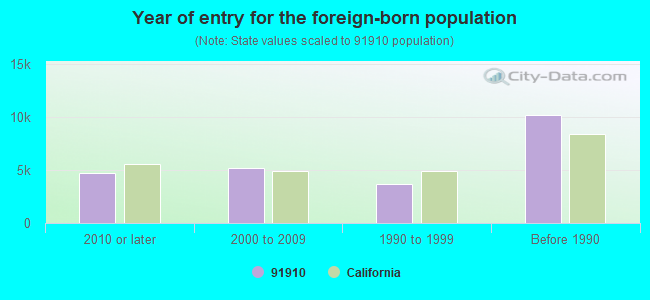
Foreign born population: 22,029 (29.1%) (61.3% of them are naturalized citizens)
Major facilities with environmental interests located in this zip code:
CHULA VISTA CITY OF PW OPS (707 F STREET in CHULA VISTA, CA)
STATE MASTER (California - Hazardous Waste Tracking) - HAZARDOU WASTE PROGRAM (Resource Conservation and Recovery Act (tracking hazardous waste)) Small Quantity Generators, between 100 kg and 1000 kg of hazardous waste/month (Resource Conservation and Recovery Act (tracking hazardous waste)) - notification Organizations: CITY OF CHULA VISTA (CONTACT/OWNER)
KINSBURSKY ENVIRONMENTAL MGMT DBA KEM (101 N GLOVER AVE STE B in CHULA VISTA, CA)
STATE MASTER (California - Hazardous Waste Tracking) - HAZARDOU WASTE PROGRAM COMPLIANCE ACTIVITY (Tracking inspections of insecticide, fungicide, and rodenticide, and toxic substances) TRANSPORTER (Resource Conservation and Recovery Act (tracking hazardous waste)) USED OIL PROGRAM (Resource Conservation and Recovery Act (tracking hazardous waste)) Organizations: KEM LLC DBA KEM (CONTACT/OPERATOR)
, HINES FAMILY TRUST (CONTACT/OWNER)
Alternative names: KINSBURSKY ENVIRONMENTAL MANAGEMENT
CHEVRON STATION 96056 (695 H ST in CHULA VISTA, CA)
STATE MASTER (California - Hazardous Waste Tracking) - HAZARDOU WASTE PROGRAM CRITERIA AND HAZARDOUS AIR POLLUTANT INVENTORY (Inventory of air pollution sources) Small Quantity Generators, between 100 kg and 1000 kg of hazardous waste/month (Resource Conservation and Recovery Act (tracking hazardous waste)) - notification Business SIC classification: GASOLINE SERVICE STATIONS Business NAICS classification: GENERAL AUTOMOTIVE REPAIR. Organizations: CHEVRON PRODUCTS CO (CONTACT/OWNER)
Alternative names: CHEVRON STATION NO 96056
ARCO #5217 (798 3RD AVENUE in CHULA VISTA, CA)
STATE MASTER (California - Hazardous Waste Tracking) - HAZARDOU WASTE PROGRAM CRITERIA AND HAZARDOUS AIR POLLUTANT INVENTORY (Inventory of air pollution sources) Small Quantity Generators, between 100 kg and 1000 kg of hazardous waste/month (Resource Conservation and Recovery Act (tracking hazardous waste)) - notification Business SIC classification: GASOLINE SERVICE STATIONS Organizations: B P WEST COAST PRODUCTS LLC (CONTACT/OWNER)
Alternative names: ARCO FACILITY NO 05409, BP WEST COAST PRODUCTS LLC 5409, PRESTIGE STATIONS INC NO 5217
CHEVRON STATION 92335 (95 BONITA RD in CHULA VISTA, CA)
STATE MASTER (California - Hazardous Waste Tracking) - HAZARDOU WASTE PROGRAM CRITERIA AND HAZARDOUS AIR POLLUTANT INVENTORY (Inventory of air pollution sources) Small Quantity Generators, between 100 kg and 1000 kg of hazardous waste/month (Resource Conservation and Recovery Act (tracking hazardous waste)) - notification Business SIC classification: GASOLINE SERVICE STATIONS Organizations: CHEVRON PRODUCTS CO (CONTACT/OWNER)
ANTHONYS AUTO CENTER (305 E STREET in CHULA VISTA, CA)
STATE MASTER (California - Hazardous Waste Tracking) - HAZARDOU WASTE PROGRAM CRITERIA AND HAZARDOUS AIR POLLUTANT INVENTORY (Inventory of air pollution sources) Small Quantity Generators, between 100 kg and 1000 kg of hazardous waste/month (Resource Conservation and Recovery Act (tracking hazardous waste)) Business SIC classification: TOP, BODY, AND UPHOLSTERY REPAIR SHOPS AND PAINT SHOPS Business NAICS classification: ALL OTHER AUTOMOTIVE REPAIR AND MAINTENANCE. Alternative names: ANTHONY'S AUTO SALES
ARCO #5208 (407 E ST in CHULA VISTA, CA)
STATE MASTER (California - Hazardous Waste Tracking) - HAZARDOU WASTE PROGRAM CRITERIA AND HAZARDOUS AIR POLLUTANT INVENTORY (Inventory of air pollution sources) Small Quantity Generators, between 100 kg and 1000 kg of hazardous waste/month (Resource Conservation and Recovery Act (tracking hazardous waste)) - notification Business SIC classification: GASOLINE SERVICE STATIONS Organizations: B P WEST COAST PRODUCTS LLC (CONTACT/OWNER)
Alternative names: ARCO FACILITY NO 05397, BP WEST COAST PRODUCTS LLC 5397, PRESTIGE STATIONS INC NO 5208
JIFFY LUBE #897 (593 E STREET in CHULA VISTA, CA)
Small Quantity Generators, between 100 kg and 1000 kg of hazardous waste/month (Resource Conservation and Recovery Act (tracking hazardous waste)) - notification STATE MASTER (California - Used Oil Recycling System ) - USED OIL RECYCLING, USED OIL PROGRAM Business NAICS classification: ALL OTHER AUTOMOTIVE REPAIR AND MAINTENANCE. Organizations: SOUTH BAY JIFFY LUBE (CONTACT/OWNER)
Alternative names: JIFFY LUBE SOUTH BAY
CHEVRON STATION NO 203217 (770 PLAZA CT in CHULA VISTA, CA)
STATE MASTER (California - Hazardous Waste Tracking) - HAZARDOU WASTE PROGRAM CRITERIA AND HAZARDOUS AIR POLLUTANT INVENTORY (Inventory of air pollution sources) Small Quantity Generators, between 100 kg and 1000 kg of hazardous waste/month (Resource Conservation and Recovery Act (tracking hazardous waste)) - notification Business SIC classification: GASOLINE SERVICE STATIONS Organizations: CHEVRON PRODUCTS CO (CONTACT/OWNER)
KMART 7636 (875 E H ST in CHULA VISTA, CA)
STATE MASTER (California - Hazardous Waste Tracking) - HAZARDOU WASTE PROGRAM Small Quantity Generators, between 100 kg and 1000 kg of hazardous waste/month (Resource Conservation and Recovery Act (tracking hazardous waste)) - notification Organizations: KMART INTERNATIONAL HEADQUARTERS (CONTACT/OWNER)
Alternative names: KMART #7636
FLEETPRIDE WEST INC (630 BAY BLVD in CHULA VISTA, CA)
STATE MASTER (California - Hazardous Waste Tracking) - HAZARDOU WASTE PROGRAM Small Quantity Generators, between 100 kg and 1000 kg of hazardous waste/month (Resource Conservation and Recovery Act (tracking hazardous waste)) - notification Organizations: FLEETPRIDE INC (CONTACT/OWNER)
CHULA VISTA HILLS ELEMENTARY (980 BUENA VISTA WAY in CHULA VISTA, CA)
(National Center for Education Statistics) - STATE ID-6107775 Organizations: CHULA VISTA ELEMENTARY (SCHOOL DISTRICT)
CHULA VISTA MIDDLE (415 FIFTH AVE. in CHULA VISTA, CA)
(National Center for Education Statistics) - STATE ID-6059760 Organizations: SWEETWATER UNION HIGH (SCHOOL DISTRICT)
Housing units lacking complete plumbing facilities: 0.3% Housing units lacking complete kitchen facilities: 1.6%
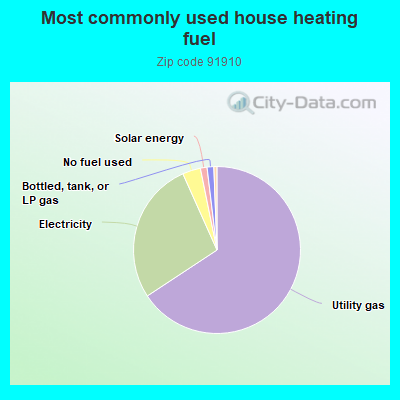
65.8%Utility gas
27.6%Electricity
3.5%No fuel used
1.3%Solar energy
1.3%Bottled, tank, or LP gas
Population in 1990: 56,320. Population change in the 1990s: +17,689 (+31.4%).
Place of birth for U.S.-born residents:
This state: 41,282
Northeast: 1,987
Midwest: 3,163
South: 3,195
West: 2,157
46% of the 91910 zip code residents lived in the same house 5 years ago. Out of people who lived in different houses, 76% lived in this county. Out of people who lived in different counties, 50% lived in California.
93% of the 91910 zip code residents lived in the same house 1 year ago. Out of people who lived in different houses, 70% moved from this county. Out of people who lived in different houses, 8% moved from different county within same state. Out of people who lived in different houses, 13% moved from different state. Out of people who lived in different houses, 11% moved from abroad.
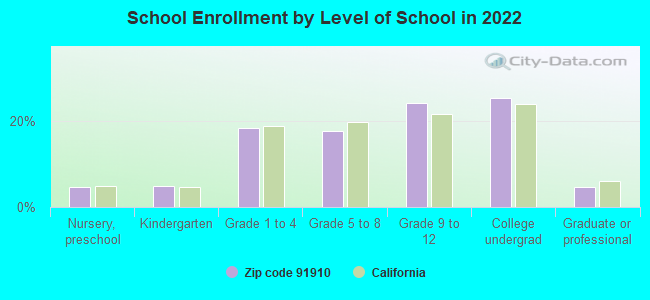
Private vs. public school enrollment:
Students in private schools in grades 1 to 8 (elementary and middle school): 598
Here:
8.7%
California:
10.5%
Students in private schools in grades 9 to 12 (high school): 192
Here:
4.2%
California:
8.5%
Students in private undergraduate colleges: 595
Here:
12.4%
California:
15.9%
Occupation by median earnings in the past 12 months ($)
113,702Law enforcement workers including supervisors
95,145Legal occupations
80,993Health diagnosing and treating practitioners and other technical occupations
74,838Life, physical, and social science occupations
74,495Architecture and engineering occupations
74,201Computer and mathematical occupations
Companies with biggest federal contracts located in this zip code (CHULA VISTA, CA):
ROHR, INCORPORATED (850 LAGOON DRIVE) : $235,461,996 in 145 contractsfrom 1999 to 2006
Contracts for Airframe Structural Components, Aeronautics and Space Technology -- Basic Research (R&D), Miscellaneous Items, Guns, through 30 mm, and moreby Air Force, Defense Logistics Agency, NASA, Navy, and others Signed by year:2000: $25,264,304; 2001: $9,964,802; 2002: $75,384,190; 2003: $68,861,485; 2004: $18,770,106; 2005: $25,377,283; 2006: $11,627,822.
Biggest contracts:
$18,094,305 with Air Force for Airframe Structural Components. Signed on 2002-09-17. Completion date: 2005-06-30.
$13,012,405, same as above.Signed on 2002-09-13. Completion date: 2009-01-31.
$11,159,820, same as above.Signed on 2003-04-30. Completion date: 2004-08-31.
$9,687,640, same as above.Signed on 2003-11-14. Completion date: 2007-08-31.
TOLO INCORPORATED (850 LAGOON DRIVE MC-107Z) : $10,529,300 in 7 contractsfrom 2000 to 2002
Contracts for Airframe Structural Components by Air Force, Defense Logistics Agency Signed by year:2000: $7,899,540; 2001: $1,314,880; 2002: $1,314,880; 2003: $0; 2004: $0; 2005: $0; 2006: $0.
Biggest contracts:
$3,515,426 with Air Force for Airframe Structural Components. Signed on 2000-11-21. Completion date: 2002-07-31.
$1,325,120 with Defense Logistics Agency for Airframe Structural Components. Signed on 2000-06-30. Completion date: 2002-04-21.
$1,314,880, same as above.Signed on 2001-11-30. Completion date: 2004-12-06.
$1,314,880, same as above.Signed on 2002-05-31. Completion date: 2006-05-30.
SWATH OCEAN SYSTEMS LLC (997 G STREET; small business) : $9,535,999 in 5 contractsfrom 2004 to 2005
Contracts for Small Craft by Navy Signed by year:2000: $0; 2001: $0; 2002: $0; 2003: $0; 2004: $5,036,000; 2005: $4,499,999; 2006: $0.
Biggest contracts:
$4,393,094 with Navy for Small Craft. Signed on 2005-09-15. Completion date: 2007-03-31.
$4,200,000, same as above.Signed on 2004-12-02. Completion date: 2006-06-30.
$836,000, same as above.Signed on 2004-02-05. Completion date: 2005-06-06.
$106,905, same as above.Signed on 2005-10-05. Completion date: 2006-10-31.
CALIFORNIA-AMERICAN WATER COMP (303 H ST 250) : $2,357,872 in 25 contractsfrom 1999 to 2005
Contracts for Water Services by Army Signed by year:2000: $304,214; 2001: $464,150; 2002: $618,412; 2003: $458,622; 2004: $390,432; 2005: $34,591; 2006: $0.
Biggest contracts:
$386,104 with Army for Water Services. Signed on 2003-10-01. Completion date: 2004-08-31.
$363,347, same as above.Signed on 2002-10-01. Completion date: 2003-05-30.
$334,422, same as above.Signed on 2004-10-01. Completion date: 2005-09-30.
$302,966, same as above.Signed on 2001-10-01. Completion date: 2002-09-30.
PREMIER COPPER & BRASS /PACIFI (310 B TROUSDALE DRIVE; small business) : $1,649,839 in 129 contractsfrom 2001 to 2006
Contracts for Hose, Pipe, Tube, Lubrication, and Railing Fittings, Valves, Nonpowered, Hardware, Commercial, Plate, Sheet, Strip, and Foil; Nonferrous Base Metal, and moreby Navy, Defense Logistics Agency Signed by year:2000: $0; 2001: $37,610; 2002: $658,081; 2003: $18,895; 2004: $351,422; 2005: $403,345; 2006: $180,486.
Biggest contracts:
$207,764 with Navy for Hose, Pipe, Tube, Lubrication, and Railing Fittings. Signed on 2002-02-14. Completion date: 2002-03-29.
$142,939 with Navy for Valves, Nonpowered. Signed on 2006-02-02. Completion date: 2006-05-03.
$108,264 with Navy for Hose, Pipe, Tube, Lubrication, and Railing Fittings. Signed on 2002-12-20. Completion date: 2003-03-07.
$74,437 with Navy for Hardware, Commercial. Signed on 2002-12-18. Completion date: 2003-01-22.
UNITED RENTALS (NORTH AMERICA) (501 C ST) : $1,133,000 in 55 contractsfrom 2002 to 2005
Contracts for Lease or Rental of Equipment -- Materials Handling Equipment, Lease or Rental of Equipment -- Ground Effect Vehicles, Motor Vehicles, Trailers, and Cycles, Material Handling Equipment, Nonself-Propelled, Miscellaneous Construction Equipment, and moreby Navy Signed by year:2000: $0; 2001: $0; 2002: $322,629; 2003: $308,946; 2004: $241,949; 2005: $259,476; 2006: $0.
Biggest contracts:
$100,726 with Navy for Lease or Rental of Equipment -- Materials Handling Equipment. Signed on 2005-09-15. Completion date: 2004-09-30.
$100,726, same as above.Signed on 2004-10-12. Completion date: 2004-09-30.
$100,726, same as above.Signed on 2003-09-03. Completion date: 2004-09-30.
$79,643, same as above.Signed on 2002-10-07. Completion date: 2003-09-30.
WESTCOAST MARINE CONSTRUCTION, (997 G STREET; small business) : $722,598 in 11 contractsfrom 2001 to 2004
Contracts for Lease or Rental of Equipment -- Ship and Marine Equipment, Vessel Towing Service, Tugs And Towboats by Navy Signed by year:2000: $0; 2001: $99,560; 2002: $362,600; 2003: $172,200; 2004: $88,238; 2005: $0; 2006: $0.
Biggest contracts:
$144,000 with Navy for Lease or Rental of Equipment -- Ship and Marine Equipment. Signed on 2003-11-24. Completion date: 2004-11-30.
$108,000, same as above.Signed on 2002-12-16. Completion date: 2002-08-21.
$100,000 with Navy for Vessel Towing Service. Signed on 2002-09-28. Completion date: 2002-06-15.
$99,560 with Navy for Tugs And Towboats. Signed on 2001-08-16. Completion date: 2001-08-22.
PRUDENTIAL OVERALL SUPPLY (740 F ST) : $620,174 in 20 contractsfrom 2000 to 2006
Contracts for Miscellaneous Items, Laundry and DryCleaning Services, Other Housekeeping Services, Laundry and Dry Cleaning Equipment, and moreby Navy, Army, U.S. Customs Service Signed by year:2000: $296,331; 2001: $277; 2002: $112,083; 2003: $1,206; 2004: $84,342; 2005: $98,507; 2006: $27,428.
Biggest contracts:
$295,499 with Navy for Miscellaneous Items. Signed on 2000-09-14. Completion date: 2001-09-30.
$80,000, same as above.Signed on 2002-08-28. Completion date: 2003-09-30.
$55,989 with Army for Laundry and DryCleaning Services. Signed on 2004-11-04. Completion date: 2004-10-01.
$52,937 with Navy for Laundry and DryCleaning Services. Signed on 2005-08-17. Completion date: 2006-09-30.
WALASHEK INDUSTRIAL & MARINE, (595 C ST; small business) 250 employees, $0 revenue. : $176,646 in 35 contractsfrom 2000 to 2001
Contracts for Non-nuclear Ship Repair (West) Ship repair (including overhauls and conversions) performed on. non-nuclear propelled and nonpropelled ships west of the 108th meridian by Navy Signed by year:2000: $124,280; 2001: $52,366; 2002: $0; 2003: $0; 2004: $0; 2005: $0; 2006: $0.
Biggest contracts:
$28,000 with Navy for Non-nuclear Ship Repair (West) Ship repair (including overhauls and conversions) performed on. non-nuclear propelled and nonpropelled ships west of the 108th meridian. Signed on 2000-06-08. Completion date: 2000-09-01.
$18,720, same as above.Signed on 2000-12-19. Completion date: 2000-12-31.
$18,000, same as above.Signed on 2001-02-01. Completion date: 2001-02-04.
$12,600, same as above.Signed on 2001-02-05. Completion date: 2001-02-19.
APPLIED INDUSTRIAL TECHNOLOGIE (630 BAY BLVD STE 106) : $157,363 in 5 contractsfrom 2004 to 2006
Contracts for Non-nuclear Ship Repair (West) Ship repair (including overhauls and conversions) performed on. non-nuclear propelled and nonpropelled ships west of the 108th meridian, Hose and Flexible Tubing, Miscellaneous Ship and Marine Equipment, Valves, Powered by Navy Signed by year:2000: $0; 2001: $0; 2002: $0; 2003: $0; 2004: $13,522; 2005: $132,526; 2006: $11,315.
Biggest contracts:
$116,507 with Navy for Non-nuclear Ship Repair (West) Ship repair (including overhauls and conversions) performed on. non-nuclear propelled and nonpropelled ships west of the 108th meridian. Signed on 2005-08-23. Completion date: 2006-06-01.
$13,522 with Navy for Hose and Flexible Tubing. Signed on 2004-08-26. Completion date: 2004-09-22.
$12,582 with Navy for Miscellaneous Ship and Marine Equipment. Signed on 2005-10-28. Completion date: 2005-12-01.
$11,315 with Navy for Non-nuclear Ship Repair (West) Ship repair (including overhauls and conversions) performed on. non-nuclear propelled and nonpropelled ships west of the 108th meridian. Signed on 2006-04-18. Completion date: 2006-06-12.
Top industries in this zip code by the number of employees in 2005:
2005 - 2018 National Fire Incident Reporting System (NFIRS) incidents
According to the data from the years 2005 - 2018 the average number of fires per year is 90. The highest number of reported fire incidents - 156 took place in 2007, and the least - 3 in 2012. The data has a decreasing trend.
When looking into fire subcategories, the most incidents belonged to: Outside Fires (40.0%), and Structure Fires (32.2%).
Fire incident types reported to NFIRS in Zip Code 91910


+$1,143
-$7,562
 Nearest zip codes: 91911, 92139, 91902, 91950, 92114, 91913.


 According to the data from the years 2005 - 2018 the average number of fires per year is 90. The highest number of reported fire incidents - 156 took place in 2007, and the least - 3 in 2012. The data has a decreasing trend.
 When looking into fire subcategories, the most incidents belonged to: Outside Fires (40.0%), and Structure Fires (32.2%).