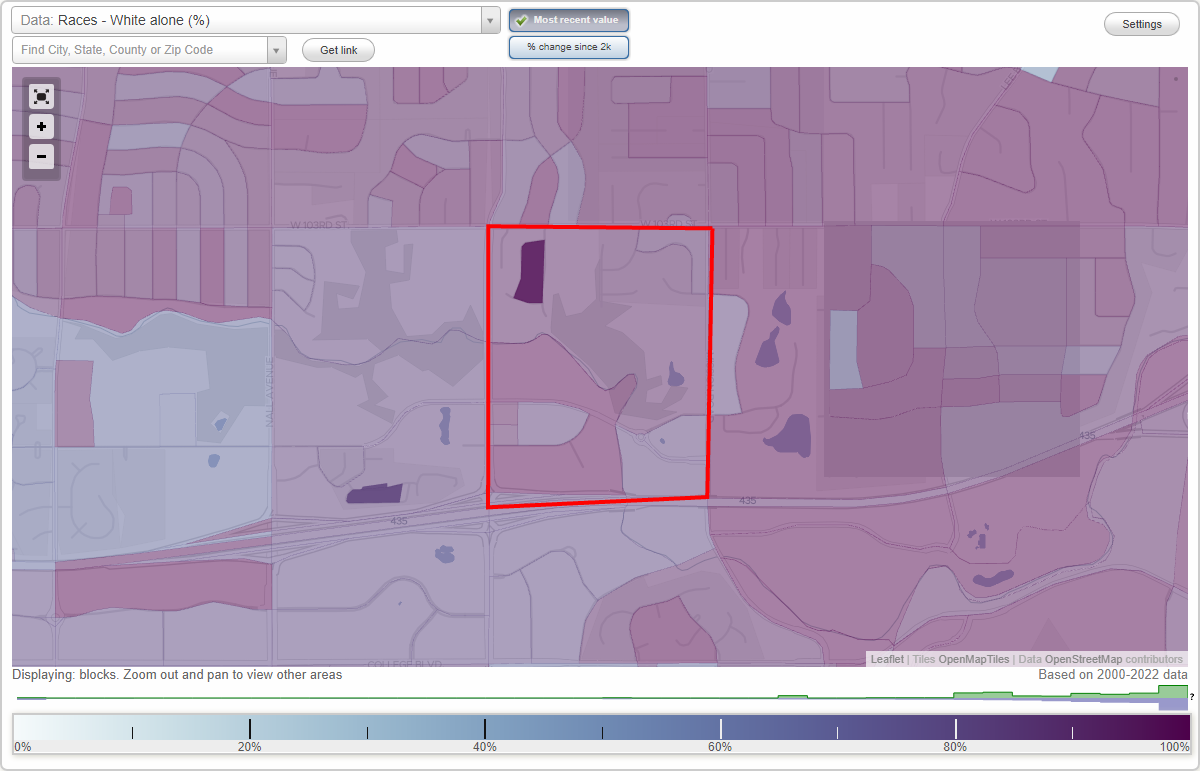
Foxhill neighborhood in Overland Park, Kansas (KS), 66207 detailed profile
Settings
X

Business Search - 14 Million verified businesses
Area: 0.324 square miles
Population: 727
Population density:
| Foxhill: | 2,244 people per square mile |
| Overland Park: | 3,485 people per square mile |

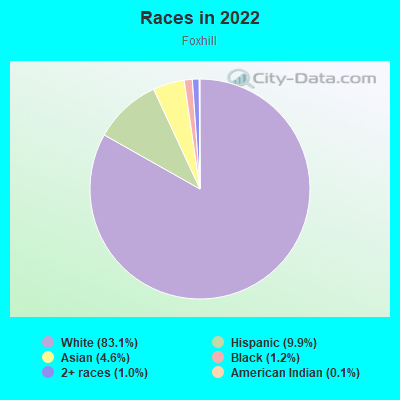
- 61183.1%White
- 739.9%Hispanic or Latino
- 344.6%Asian
- 91.2%Black
- 71.0%Two or more races
- 10.1%American Indian
Median household income in 2022:
| Foxhill: | $132,935 |
| Overland Park: | $96,694 |
Distribution of median household income
![Distribution of median household income]()
- 37Less than $10,000
- 11$10,000 to $19,999
- 16$20,000 to $29,999
- 14$30,000 to $39,999
- 31$40,000 to $49,999
- 11$50,000 to $59,999
- 44$60,000 to $74,999
- 69$75,000 to $99,999
- 93$100,000 to $124,999
- 33$125,000 to $149,999
- 48$150,000 to $199,999
- 11$200,000 or more

Distribution of owner-occupied house/condo value
![Distribution of owner-occupied house/condo value]()
- 44Less than $50,000
- 7$50,000 to $99,999
- 24$100,000 to $149,999
- 16$150,000 to $199,999
- 32$200,000 to $249,999
- 18$250,000 to $299,999
- 66$300,000 to $399,999
- 135$400,000 to $499,999
- 112$500,000 to $749,999
- 19$750,000 to $999,999
- 12$1,000,000 or more

Distribution of rent paid by renters
![Distribution of rent paid by renters]()
- 8$300 to $399
- 3$500 to $599
- 2$700 to $799
- 3$800 to $899
- 3$900 to $999
- 106$1,000 to $1,249
- 28$1,250 to $1,499
- 114$1,500 to $1,999
- 67$2,000 or more

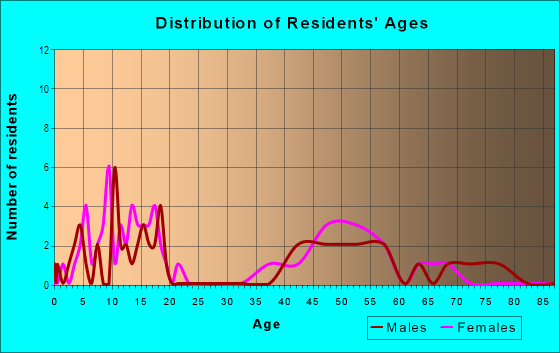
| Males: | 335 |
| Females: | 391 |
Males:
| This neighborhood: | 44.0 years |
| Whole city: | 37.7 years |
| This neighborhood: | 44.0 years |
| Whole city: | 38.8 years |
Average household size:
| Foxhill: | 2.2 people |
| Overland Park: | 2.3 people |
Percentage of family households:
| Foxhill: | 40.6% |
| Overland Park: | 42.1% |
| Here: | 30.6% |
| Overland Park: | 48.0% |
Percentage of married-couple families with children (among all households):
| Foxhill: | 14.1% |
| Overland Park: | 37.4% |
Percentage of single-mother households (among all households):
| Foxhill: | 36.2% |
| Overland Park: | 4.2% |
Percentage of never married males 15 years old and over:
Percentage of never married females 15 years old and over:
| Foxhill: | 17.3% |
| Overland Park: | 17.2% |
Percentage of never married females 15 years old and over:
| Foxhill: | 24.4% |
| city: | 15.1% |
Percentage of people that speak English not well or not at all:
| Foxhill: | 0.6% |
| Overland Park: | 1.4% |
Percentage of people born in this state:
Percentage of people born in another U.S. state:
Percentage of native residents but born outside the U.S.:
Percentage of foreign born residents:
| Here: | 31.8% |
| Overland Park: | 37.4% |
Percentage of people born in another U.S. state:
| Foxhill: | 62.3% |
| Overland Park: | 50.4% |
Percentage of native residents but born outside the U.S.:
| Here: | 1.8% |
| city: | 0.9% |
Percentage of foreign born residents:
| Here: | 4.1% |
| Overland Park: | 11.3% |
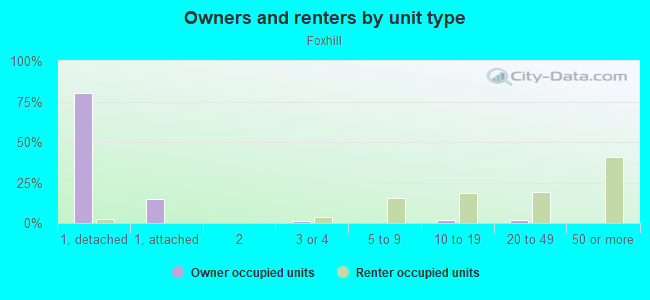
Owner-occupied
Renter-occupied

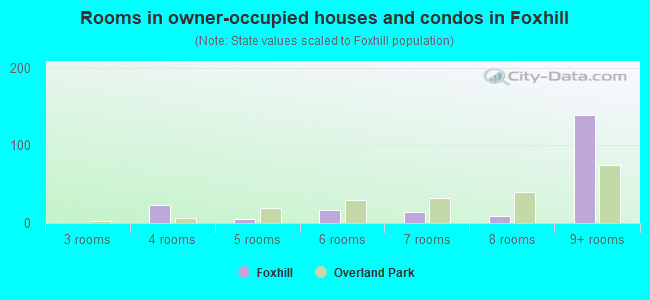
- Rooms in owner-occupied houses and condos in Foxhill
- 01 room
- 02 rooms
- 03 rooms
- 234 rooms
- 55 rooms
- 176 rooms
- 147 rooms
- 98 rooms
- 1399+ rooms
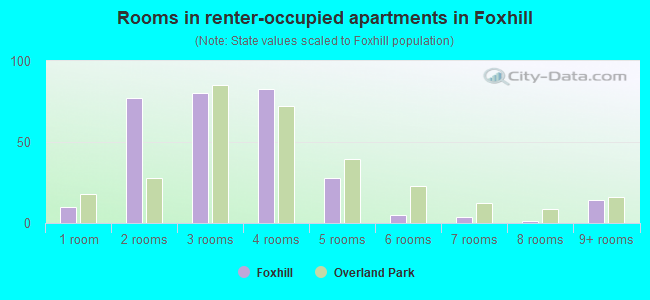
- Rooms in renter-occupied apartments in Foxhill
- 101 room
- 772 rooms
- 803 rooms
- 834 rooms
- 285 rooms
- 56 rooms
- 47 rooms
- 18 rooms
- 149+ rooms
Owner-occupied
Renter-occupied
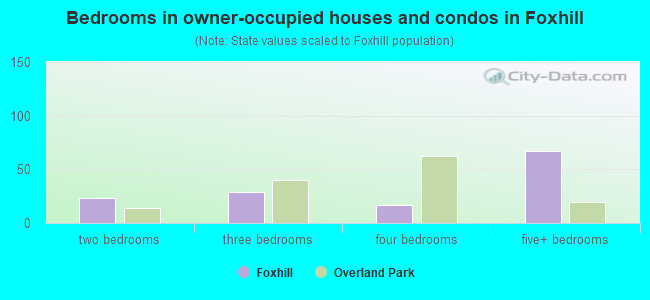
- Bedrooms in owner-occupied houses and condos in Foxhill
- 0no bedroom
- 01 bedroom
- 232 bedrooms
- 293 bedrooms
- 174 bedrooms
- 675+ bedrooms
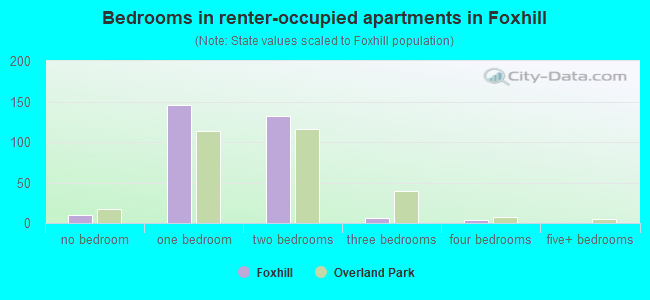
- Bedrooms in renter-occupied apartments in Foxhill
- 10no bedroom
- 1461 bedroom
- 1322 bedrooms
- 63 bedrooms
- 44 bedrooms
- 05+ bedrooms
Average number of cars or other vehicles available in houses/condos:
Average number of cars or other vehicles available in apartments:
| This neighborhood: | 2.4 |
| Overland Park: | 2.0 |
Average number of cars or other vehicles available in apartments:
| Here: | |
| city: |
Percentage of units with a mortgage:
| Foxhill: | 78.8% |
| Overland Park: | 67.7% |
Average estimated value of detached houses in 2022 (2.5% of all units):
| Foxhill: | $482,594 |
| Kansas: | $264,181 |
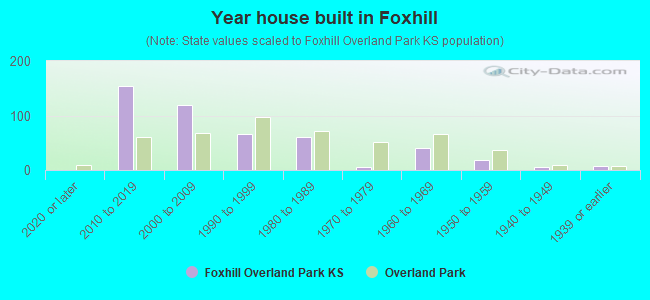
- Year house built in Foxhill
- 02020 or later
- 1552010 to 2019
- 1202000 to 2009
- 661990 to 1999
- 601980 to 1989
- 61970 to 1979
- 411960 to 1969
- 191950 to 1959
- 61940 to 1949
- 71939 or earlier
City-data.com crime index for city in 2020 (higher means more crime):
| City: | 154.8 |
| U.S. average: | 219.5 |
Travel time to work (commute)
![Travel time to work (commute)]()
- 8Less than 5 minutes
- 455 to 9 minutes
- 7310 to 14 minutes
- 6015 to 19 minutes
- 8720 to 24 minutes
- 3625 to 29 minutes
- 2930 to 34 minutes
- 1435 to 39 minutes
- 440 to 44 minutes
- 1245 to 59 minutes
- 160 to 89 minutes

Means of transportation to work
![Means of transportation to work]()
- 79.7%434Drove a car alone
- 4.2%23Carpooled
- 0.2%1Bus
- 1.5%8Walked
- 1.3%7Other means
- 13.0%71Worked at home

Time leaving home to go to work
![Time leaving home to go to work]()
- 1112:00 a.m. to 4:59 a.m.
- 125:00 a.m. to 5:29 a.m.
- 55:30 a.m. to 5:59 a.m.
- 146:00 a.m. to 6:29 a.m.
- 276:30 a.m. to 6:59 a.m.
- 727:00 a.m. to 7:29 a.m.
- 667:30 a.m. to 7:59 a.m.
- 428:00 a.m. to 8:29 a.m.
- 128:30 a.m. to 8:59 a.m.
- 349:00 a.m. to 9:59 a.m.
- 110:00 a.m. to 10:59 a.m.
- 111:00 a.m. to 11:59 a.m.
- 2412:00 p.m. to 3:59 p.m.
- 194:00 p.m. to 11:59 p.m.

Occupations of males:
- Percentage of males in management occupations (except farmers):
Here: 3.8% city: 17.2%
- Percentage of males in business and financial operations occupations:
Here: 15.8% city: 9.9%
- Percentage of males in computer and mathematical occupations:
Here: 24.7% city: 11.2%
- Percentage of males in architecture and engineering occupations:
Here: 12.3% city: 5.0%
- Percentage of males in arts, design, entertainment, sports, and media occupations:
Here: 2.8% city: 2.6%
- Percentage of males in service occupations:
Here: 18.0% city: 9.7%
- Percentage of males in sales and office occupations:
Here: 7.3% city: 19.9%
- Percentage of males in construction, extraction, and maintenance occupations:
Here: 3.6% city: 2.8%
- Percentage of males in production occupations:
Here: 1.4% city: 2.3%
- Percentage of males in transportation occupations:
Here: 2.1% city: 3.0%
Occupations of females:
- Percentage of females in management occupations (except farmers):
Here: 7.0% city: 10.8%
- Percentage of females in business and financial operations occupations:
Here: 27.6% city: 10.2%
- Percentage of females in computer and mathematical occupations:
Here: 1.4% city: 4.6%
- Percentage of females in architecture and engineering occupations:
Here: 2.3% city: 1.3%
- Percentage of females in life, physical, and social science occupations:
Here: 7.8% city: 1.2%
- Percentage of females in legal occupations:
Here: 3.9% city: 1.6%
- Percentage of females in healthcare practitioners and technical occupations:
Here: 3.1% city: 12.1%
- Percentage of females in service occupations:
Here: 31.5% city: 13.8%
- Percentage of females in sales and office occupations:
Here: 16.5% city: 25.2%
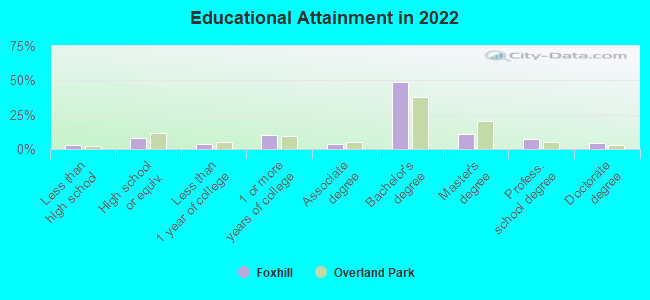
Education in this neighborhood (subdivision or community):
- Percentage of people 3 years and older in K-12 schools:
Foxhill: 18.9% Overland Park: 15.4%
- Percentage of people 3 years and older in undergraduate colleges:
Foxhill: 5.9% Overland Park: 3.4%
- Percentage of people 3 years and older in grad. or professional schools:
Foxhill: 6.2% Overland Park: 2.3%
- Percentage of students K-12 enrolled in private schools:
Foxhill: 23.9% Overland Park: 14.1%
Percentage of population below poverty level:
| Foxhill: | 5.6% |
| Overland Park: | 5.0% |
Median year owner moved in (as recorded in 2022):
| Foxhill: | 2009 |
| Overland Park: | 2013 |
Percentage of married-couple families with both working:
| Foxhill: | 172.0% |
| Overland Park: | 75.4% |
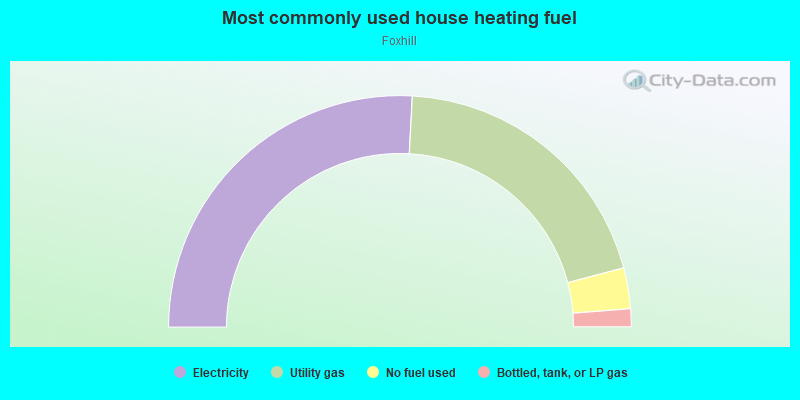
- 51.7%Electricity
- 40.1%Utility gas
- 5.7%No fuel used
- 2.5%Bottled, tank, or LP gas
Limited-access highways (interstate or state) in this neighborhood:
I- 435 (US Hwy 50)
Length: 0.40 miles
Direction: E-W
Direction: E-W
Roads and streets:
Wycklow St
Length: 0.48 miles
Directions: E-W, N-S, SE-NW, SW-NE
Address range: 24 to 99
Directions: E-W, N-S, SE-NW, SW-NE
Address range: 24 to 99
Mission Rd
Length: 0.28 miles
Direction: N-S
Address range: 10400 to 10513
Direction: N-S
Address range: 10400 to 10513
Alhambra St
Length: 0.27 miles
Directions: E-W, N-S, SE-NW, SW-NE
Address range: 10300 to 10499
Directions: E-W, N-S, SE-NW, SW-NE
Address range: 10300 to 10499
W 107th St
Length: 0.26 miles
Directions: E-W, N-S, SW-NE
Address range: 4300 to 4599
Directions: E-W, N-S, SW-NE
Address range: 4300 to 4599
Indian Creek Pkwy
Length: 0.24 miles
Directions: E-W, SE-NW
Address range: 4400 to 4599
Directions: E-W, SE-NW
Address range: 4400 to 4599
W 104th Ter (104th Ter)
Length: 0.20 miles
Directions: E-W, SE-NW
Address range: 4000 to 4299
Directions: E-W, SE-NW
Address range: 4000 to 4299
Delmar Ln
Length: 0.14 miles
Direction: N-S
Address range: 10304 to 10498
Direction: N-S
Address range: 10304 to 10498
Catalina St
Length: 0.12 miles
Directions: E-W, SW-NE
Address range: 10309 to 10399
Directions: E-W, SW-NE
Address range: 10309 to 10399
Granada
Length: 0.10 miles
Direction: N-S
Direction: N-S
el Monte St
Length: 0.07 miles
Direction: SE-NW
Address range: 10700 to 10799
Direction: SE-NW
Address range: 10700 to 10799
W 104th Ter
Length: 0.05 miles
Direction: E-W
Address range: 3900 to 3999
Direction: E-W
Address range: 3900 to 3999
Other features:
Indian Crk
Length: 0.00 miles
Direction: N-S
Direction: N-S