Historic Overland Park neighborhood in Overland Park, Kansas (KS), 66204, 66212 detailed profile
Settings
X


Business Search - 14 Million verified businesses
Area: 0.417 square miles
Population: 2,035
Population density:
| Historic Overland Park: | 4,878 people per square mile |
| Overland Park: | 3,485 people per square mile |

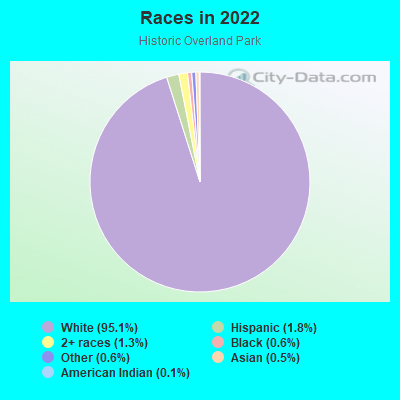
- 1,93595.1%White
- 361.8%Hispanic or Latino
- 261.3%Two or more races
- 130.6%Black
- 120.6%Some other race
- 100.5%Asian
- 30.1%American Indian
Median household income in 2022:
| Historic Overland Park: | $71,805 |
| Overland Park: | $96,694 |
Distribution of median household income
![Distribution of median household income]()
- 20Less than $10,000
- 13$10,000 to $19,999
- 26$20,000 to $29,999
- 48$30,000 to $39,999
- 48$40,000 to $49,999
- 168$50,000 to $59,999
- 141$60,000 to $74,999
- 211$75,000 to $99,999
- 57$100,000 to $124,999
- 61$125,000 to $149,999
- 75$150,000 to $199,999
- 34$200,000 or more

Distribution of owner-occupied house/condo value
![Distribution of owner-occupied house/condo value]()
- 23Less than $50,000
- 20$50,000 to $99,999
- 215$100,000 to $149,999
- 159$150,000 to $199,999
- 126$200,000 to $249,999
- 44$250,000 to $299,999
- 109$300,000 to $399,999
- 58$400,000 to $499,999
- 23$500,000 to $749,999

Distribution of rent paid by renters
![Distribution of rent paid by renters]()
- 8Less than $100
- 55$100 to $199
- 32$200 to $299
- 24$300 to $399
- 39$400 to $499
- 11$500 to $599
- 6$600 to $699
- 66$700 to $799
- 69$800 to $899
- 13$900 to $999
- 35$1,000 to $1,249
- 72$1,250 to $1,499
- 48$1,500 to $1,999
- 29$2,000 or more

Median rent in 2022:
| Historic Overland Park: | $1,151 |
| Overland Park: | $1,194 |
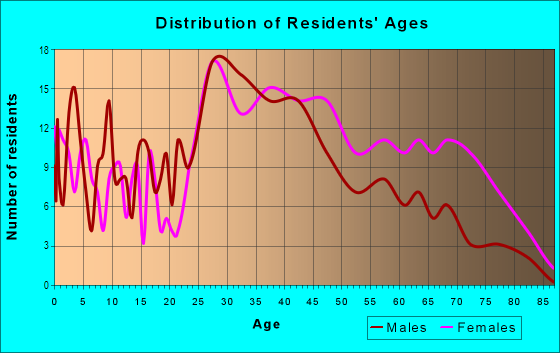
| Males: | 874 |
| Females: | 1,160 |
Males:
| This neighborhood: | 34.3 years |
| Whole city: | 37.7 years |
| This neighborhood: | 39.5 years |
| Whole city: | 38.8 years |
Average household size:
| Historic Overland Park: | 2.2 people |
| Overland Park: | 2.3 people |
Percentage of family households:
| Historic Overland Park: | 42.5% |
| Overland Park: | 42.1% |
| Here: | 38.4% |
| Overland Park: | 48.0% |
Percentage of married-couple families with children (among all households):
| Historic Overland Park: | 40.0% |
| Overland Park: | 37.4% |
Percentage of single-mother households (among all households):
| Historic Overland Park: | 5.2% |
| Overland Park: | 4.2% |
Percentage of never married males 15 years old and over:
Percentage of never married females 15 years old and over:
| Historic Overland Park: | 15.7% |
| Overland Park: | 17.2% |
Percentage of never married females 15 years old and over:
| Historic Overland Park: | 12.0% |
| city: | 15.1% |
Percentage of people that speak English not well or not at all:
| Historic Overland Park: | 0.0% |
| Overland Park: | 1.4% |
Percentage of people born in this state:
Percentage of people born in another U.S. state:
Percentage of native residents but born outside the U.S.:
Percentage of foreign born residents:
| Here: | 40.2% |
| Overland Park: | 37.4% |
Percentage of people born in another U.S. state:
| Historic Overland Park: | 46.1% |
| Overland Park: | 50.4% |
Percentage of native residents but born outside the U.S.:
| Here: | 0.9% |
| city: | 0.9% |
Percentage of foreign born residents:
| Here: | 12.8% |
| Overland Park: | 11.3% |
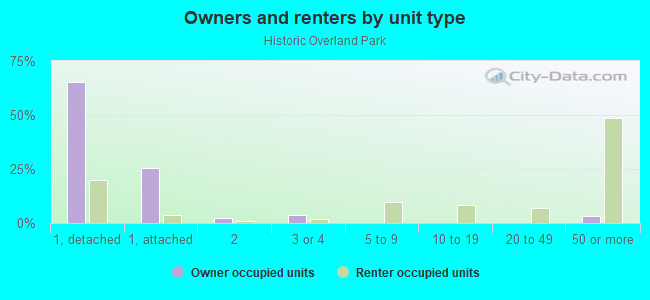
Owner-occupied
Renter-occupied

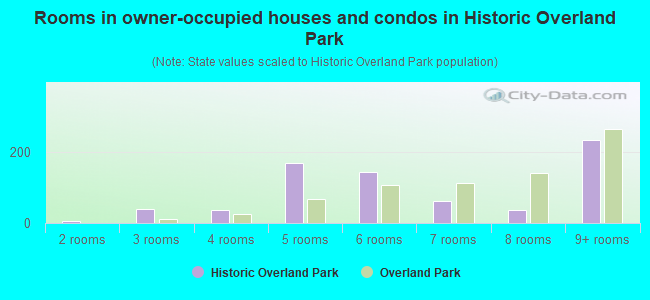
- Rooms in owner-occupied houses and condos in Historic Overland Park
- 01 room
- 62 rooms
- 413 rooms
- 374 rooms
- 1715 rooms
- 1446 rooms
- 617 rooms
- 378 rooms
- 2359+ rooms
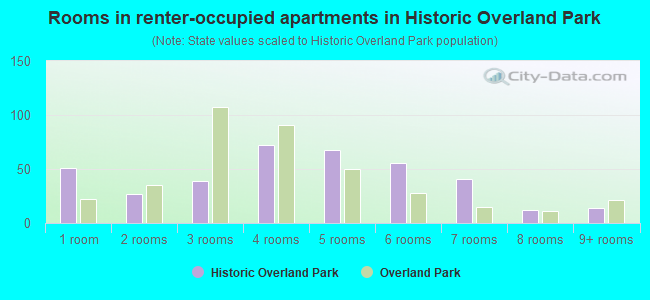
- Rooms in renter-occupied apartments in Historic Overland Park
- 511 room
- 272 rooms
- 393 rooms
- 724 rooms
- 685 rooms
- 566 rooms
- 417 rooms
- 128 rooms
- 149+ rooms
Owner-occupied
Renter-occupied
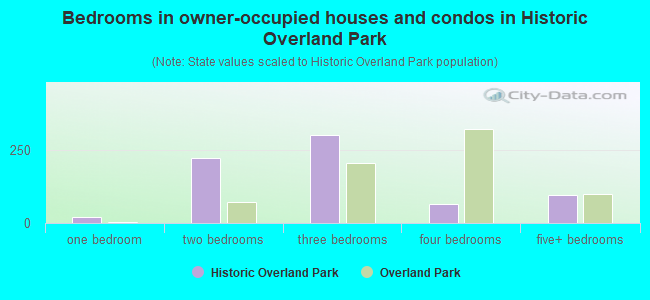
- Bedrooms in owner-occupied houses and condos in Historic Overland Park
- 0no bedroom
- 191 bedroom
- 2232 bedrooms
- 3023 bedrooms
- 644 bedrooms
- 965+ bedrooms
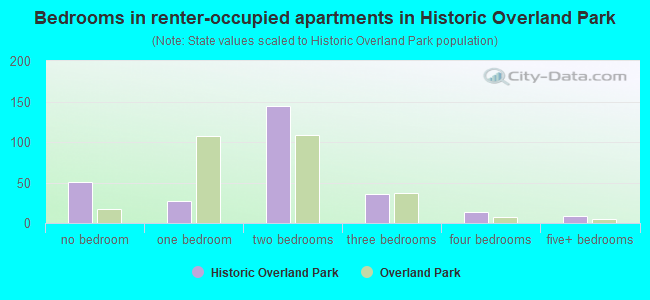
- Bedrooms in renter-occupied apartments in Historic Overland Park
- 51no bedroom
- 271 bedroom
- 1452 bedrooms
- 363 bedrooms
- 144 bedrooms
- 95+ bedrooms
Average number of cars or other vehicles available in houses/condos:
Average number of cars or other vehicles available in apartments:
| This neighborhood: | 1.9 |
| Overland Park: | 2.0 |
Average number of cars or other vehicles available in apartments:
| Here: | 1.5 |
| city: | 1.3 |
Percentage of units with a mortgage:
| Historic Overland Park: | 64.7% |
| Overland Park: | 67.7% |
Housing prices:
- Average estimated value of detached houses in 2022 (62.6% of all units):
Historic Overland Park: $268,568 Kansas: $264,181
- Average estimated value of townhouses or other attached units in 2022 (27.4% of all units):
This neighborhood: $145,352 Kansas: $219,178
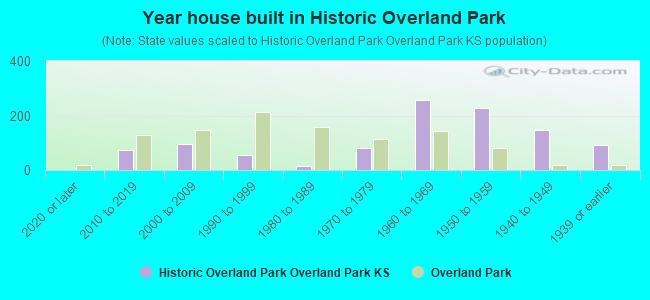
- Year house built in Historic Overland Park
- 02020 or later
- 722010 to 2019
- 952000 to 2009
- 551990 to 1999
- 131980 to 1989
- 821970 to 1979
- 2581960 to 1969
- 2261950 to 1959
- 1481940 to 1949
- 901939 or earlier
City-data.com crime index for city in 2020 (higher means more crime):
| City: | 154.8 |
| U.S. average: | 219.5 |
Travel time to work (commute)
![Travel time to work (commute)]()
- 31Less than 5 minutes
- 815 to 9 minutes
- 13710 to 14 minutes
- 20415 to 19 minutes
- 19020 to 24 minutes
- 7925 to 29 minutes
- 6630 to 34 minutes
- 2235 to 39 minutes
- 1640 to 44 minutes
- 3445 to 59 minutes
- 790 or more minutes

Means of transportation to work
![Means of transportation to work]()
- 65.8%733Drove a car alone
- 1.0%11Carpooled
- 3.1%35Taxi
- 1.3%14Bicycle
- 3.7%41Walked
- 1.1%12Other means
- 29.4%327Worked at home

Time leaving home to go to work
![Time leaving home to go to work]()
- 5512:00 a.m. to 4:59 a.m.
- 95:00 a.m. to 5:29 a.m.
- 365:30 a.m. to 5:59 a.m.
- 606:00 a.m. to 6:29 a.m.
- 1376:30 a.m. to 6:59 a.m.
- 657:00 a.m. to 7:29 a.m.
- 1307:30 a.m. to 7:59 a.m.
- 1038:00 a.m. to 8:29 a.m.
- 838:30 a.m. to 8:59 a.m.
- 1009:00 a.m. to 9:59 a.m.
- 3010:00 a.m. to 10:59 a.m.
- 611:00 a.m. to 11:59 a.m.
- 712:00 p.m. to 3:59 p.m.
- 104:00 p.m. to 11:59 p.m.

Occupations of males:
- Percentage of males in management occupations (except farmers):
Here: 25.2% city: 17.2%
- Percentage of males in business and financial operations occupations:
Here: 3.7% city: 9.9%
- Percentage of males in computer and mathematical occupations:
Here: 15.3% city: 11.2%
- Percentage of males in architecture and engineering occupations:
Here: 7.3% city: 5.0%
- Percentage of males in education, training, and library occupations:
Here: 1.7% city: 2.4%
- Percentage of males in healthcare practitioners and technical occupations:
Here: 4.2% city: 4.1%
- Percentage of males in service occupations:
Here: 14.0% city: 9.7%
- Percentage of males in sales and office occupations:
Here: 15.4% city: 19.9%
- Percentage of males in production occupations:
Here: 2.5% city: 2.3%
- Percentage of males in material moving occupations:
Here: 3.8% city: 2.7%
Occupations of females:
- Percentage of females in management occupations (except farmers):
Here: 14.9% city: 10.8%
- Percentage of females in business and financial operations occupations:
Here: 14.2% city: 10.2%
- Percentage of females in computer and mathematical occupations:
Here: 14.5% city: 4.6%
- Percentage of females in education, training, and library occupations:
Here: 12.6% city: 10.8%
- Percentage of females in arts, design, entertainment, sports, and media occupations:
Here: 10.1% city: 2.8%
- Percentage of females in healthcare practitioners and technical occupations:
Here: 13.8% city: 12.1%
- Percentage of females in service occupations:
Here: 6.8% city: 13.8%
- Percentage of females in sales and office occupations:
Here: 12.9% city: 25.2%
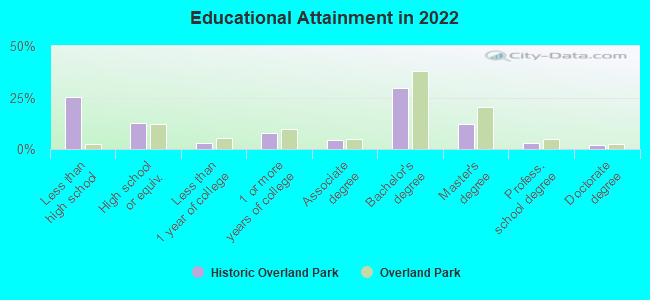
Education in this neighborhood (subdivision or community):
- Percentage of people 3 years and older in K-12 schools:
Historic Overland Park: 17.9% Overland Park: 15.4%
- Percentage of people 3 years and older in undergraduate colleges:
Historic Overland Park: 4.0% Overland Park: 3.4%
- Percentage of people 3 years and older in grad. or professional schools:
Historic Overland Park: 2.2% Overland Park: 2.3%
- Percentage of students K-12 enrolled in private schools:
Historic Overland Park: 67.7% Overland Park: 14.1%
Percentage of population below poverty level:
| Historic Overland Park: | 5.8% |
| Overland Park: | 5.0% |
Median year owner moved in (as recorded in 2022):
Median year renter moved in (as recorded in 2022):
| Historic Overland Park: | 2009 |
| Overland Park: | 2013 |
Median year renter moved in (as recorded in 2022):
| Historic Overland Park: | 2017 |
| Overland Park: | 2021 |
Percentage of married-couple families with both working:
| Historic Overland Park: | 33.8% |
| Overland Park: | 75.4% |
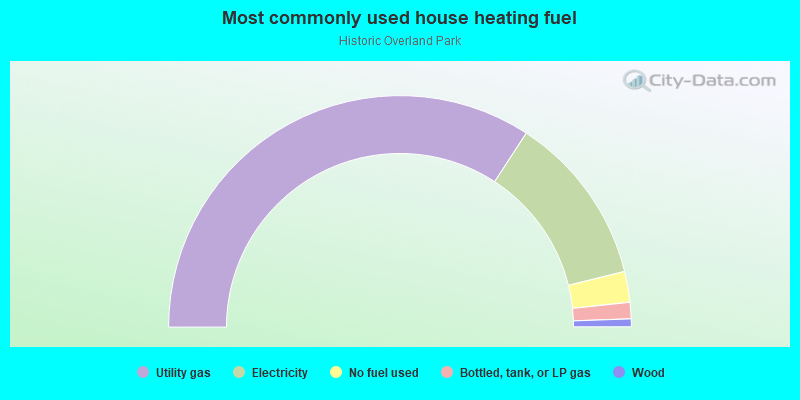
- 68.4%Utility gas
- 23.9%Electricity
- 4.3%No fuel used
- 2.3%Bottled, tank, or LP gas
- 1.1%Wood
Roads and streets:
W 80th St
Length: 0.99 miles
Direction: E-W
Address range: 7410 to 8699
Direction: E-W
Address range: 7410 to 8699
W 81st St
Length: 0.89 miles
Directions: E-W, SW-NE
Address range: 7700 to 8699
Directions: E-W, SW-NE
Address range: 7700 to 8699
Santa Fe Trail Dr (Santa Fe Dr)
Length: 0.86 miles
Directions: N-S, SW-NE
Address range: 7900 to 8434
Directions: N-S, SW-NE
Address range: 7900 to 8434
Hemlock St
Length: 0.64 miles
Direction: N-S
Address range: 7922 to 8399
Direction: N-S
Address range: 7922 to 8399
W 83rd St
Length: 0.60 miles
Direction: E-W
Address range: 8100 to 8699
Direction: E-W
Address range: 8100 to 8699
W 79th St
Length: 0.50 miles
Direction: E-W
Address range: 7406 to 8099
Direction: E-W
Address range: 7406 to 8099
W 82nd St
Length: 0.48 miles
Direction: E-W
Address range: 8100 to 8699
Direction: E-W
Address range: 8100 to 8699
Greenbriar Dr
Length: 0.45 miles
Directions: E-W, N-S, SE-NW
Address range: 8300 to 8699
Directions: E-W, N-S, SE-NW
Address range: 8300 to 8699
Antioch Rd
Length: 0.43 miles
Direction: N-S
Address range: 8000 to 8313
Direction: N-S
Address range: 8000 to 8313
Lowell Ave
Length: 0.42 miles
Directions: N-S, SE-NW
Address range: 7900 to 8206
Directions: N-S, SE-NW
Address range: 7900 to 8206
Hadley St
Length: 0.41 miles
Directions: E-W, N-S, SW-NE
Address range: 8100 to 8499
Directions: E-W, N-S, SW-NE
Address range: 8100 to 8499
Goodman St
Length: 0.36 miles
Directions: N-S, SE-NW, SW-NE
Address range: 8100 to 8399
Directions: N-S, SE-NW, SW-NE
Address range: 8100 to 8399
Woodward St
Length: 0.36 miles
Directions: N-S, SE-NW
Address range: 8100 to 8399
Directions: N-S, SE-NW
Address range: 8100 to 8399
Mackey St
Length: 0.32 miles
Directions: N-S, SW-NE
Address range: 8100 to 8399
Directions: N-S, SW-NE
Address range: 8100 to 8399
Newton St
Length: 0.31 miles
Direction: N-S
Address range: 7900 to 8199
Direction: N-S
Address range: 7900 to 8199
Hardy St
Length: 0.29 miles
Direction: N-S
Address range: 8100 to 8399
Direction: N-S
Address range: 8100 to 8399
Robinson St
Length: 0.25 miles
Direction: N-S
Address range: 7900 to 8099
Direction: N-S
Address range: 7900 to 8099
Conser St (Conser Pl)
Length: 0.24 miles
Directions: N-S, SE-NW
Address range: 7900 to 8099
Directions: N-S, SE-NW
Address range: 7900 to 8099
Craig St
Length: 0.24 miles
Direction: N-S
Address range: 8100 to 8299
Direction: N-S
Address range: 8100 to 8299
Foster St
Length: 0.16 miles
Direction: N-S
Address range: 7900 to 8099
Direction: N-S
Address range: 7900 to 8099
W 80th Ter
Length: 0.16 miles
Direction: E-W
Address range: 7900 to 8699
Direction: E-W
Address range: 7900 to 8699
W 85th St
Length: 0.11 miles
Direction: E-W
Direction: E-W
W 82nd Ter
Length: 0.09 miles
Directions: E-W, SW-NE
Directions: E-W, SW-NE
Circle St
Length: 0.08 miles
Directions: E-W, SW-NE
Directions: E-W, SW-NE
W 84th St
Length: 0.07 miles
Directions: E-W, SW-NE
Address range: 8500 to 8598
Directions: E-W, SW-NE
Address range: 8500 to 8598
Woodward (Woodward St)
Length: 0.06 miles
Direction: N-S
Address range: 8000 to 8099
Direction: N-S
Address range: 8000 to 8099