Horseleg Estates neighborhood in Rome, Georgia (GA), 30165 detailed profile
Settings
X


Business Search - 14 Million verified businesses
Area: 1.196 square miles
Population: 478
Population density:
| Horseleg Estates: | 400 people per square mile |
| Rome: | 1,280 people per square mile |

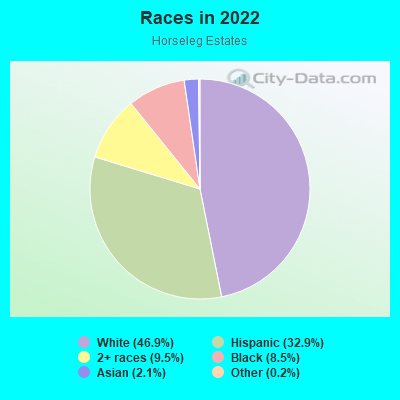
- 27146.9%White
- 19032.9%Hispanic or Latino
- 559.5%Two or more races
- 498.5%Black
- 122.1%Asian
- 10.2%Some other race
Median household income in 2022:
| Horseleg Estates: | $70,363 |
| Rome: | $48,512 |
Distribution of median household income
![Distribution of median household income]()
- 2Less than $10,000
- 8$10,000 to $19,999
- 87$20,000 to $29,999
- 19$30,000 to $39,999
- 119$40,000 to $49,999
- 4$50,000 to $59,999
- 23$60,000 to $74,999
- 4$75,000 to $99,999
- 32$100,000 to $124,999
- 3$125,000 to $149,999
- 21$150,000 to $199,999
- 5$200,000 or more

Distribution of owner-occupied house/condo value
![Distribution of owner-occupied house/condo value]()
- 18Less than $50,000
- 88$50,000 to $99,999
- 38$100,000 to $149,999
- 16$150,000 to $199,999
- 11$200,000 to $249,999
- 74$250,000 to $299,999
- 18$300,000 to $399,999
- 1$400,000 to $499,999
- 11$500,000 to $749,999
- 4$750,000 to $999,999
- 3$1,000,000 or more

Distribution of rent paid by renters
![Distribution of rent paid by renters]()
- 12$200 to $299
- 7$300 to $399
- 8$400 to $499
- 157$500 to $599
- 68$600 to $699
- 11$700 to $799
- 13$800 to $899
- 58$900 to $999
- 17$1,000 to $1,249

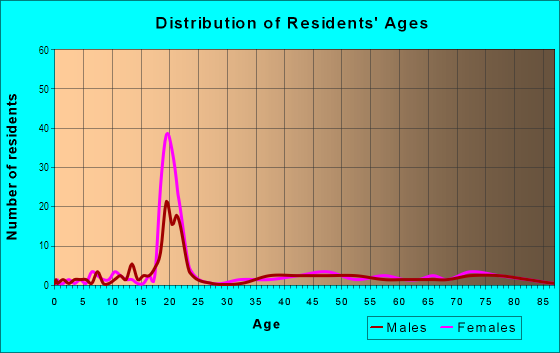
| Males: | 232 |
| Females: | 246 |
Males:
| This neighborhood: | 36.6 years |
| Whole city: | 36.1 years |
| This neighborhood: | 35.9 years |
| Whole city: | 37.9 years |
Average household size:
| Horseleg Estates: | 3.2 people |
| Rome: | 2.5 people |
Percentage of family households:
| Horseleg Estates: | 58.2% |
| Rome: | 45.4% |
| Here: | 59.1% |
| Rome: | 36.6% |
Percentage of married-couple families with children (among all households):
| Horseleg Estates: | 21.3% |
| Rome: | 22.4% |
Percentage of single-mother households (among all households):
| Horseleg Estates: | 10.5% |
| Rome: | 15.0% |
Percentage of never married males 15 years old and over:
Percentage of never married females 15 years old and over:
| Horseleg Estates: | 18.2% |
| Rome: | 19.0% |
Percentage of never married females 15 years old and over:
| Horseleg Estates: | 18.7% |
| city: | 20.3% |
Percentage of people that speak English not well or not at all:
| Horseleg Estates: | 14.2% |
| Rome: | 5.6% |
Percentage of people born in this state:
Percentage of people born in another U.S. state:
Percentage of native residents but born outside the U.S.:
Percentage of foreign born residents:
| Here: | 57.3% |
| Rome: | 66.1% |
Percentage of people born in another U.S. state:
| Horseleg Estates: | 14.9% |
| Rome: | 20.8% |
Percentage of native residents but born outside the U.S.:
| Here: | 0.3% |
| city: | 0.6% |
Percentage of foreign born residents:
| Here: | 27.6% |
| Rome: | 12.4% |
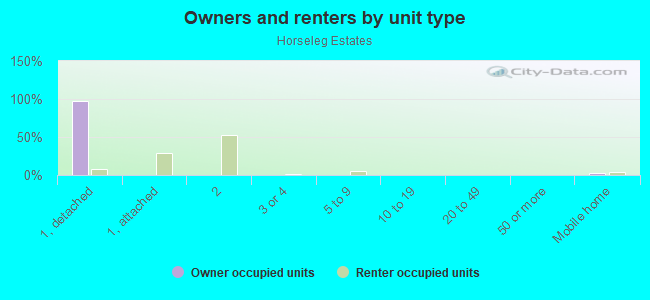
Owner-occupied
Renter-occupied

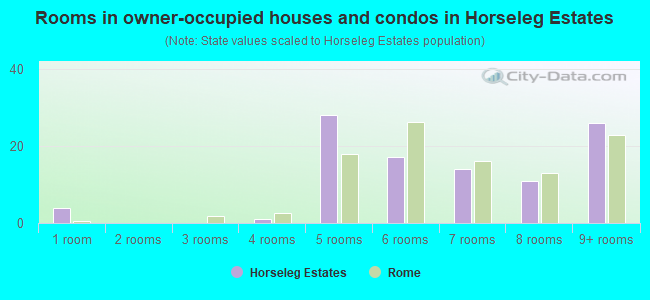
- Rooms in owner-occupied houses and condos in Horseleg Estates
- 41 room
- 02 rooms
- 03 rooms
- 14 rooms
- 285 rooms
- 176 rooms
- 147 rooms
- 118 rooms
- 269+ rooms
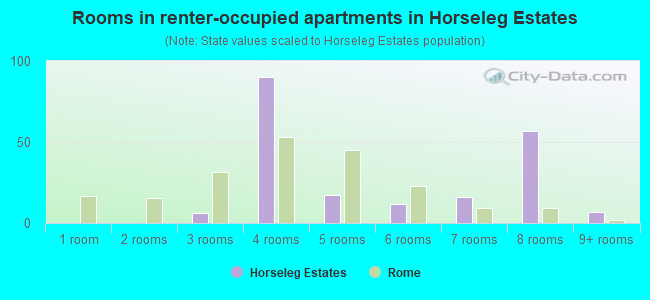
- Rooms in renter-occupied apartments in Horseleg Estates
- 01 room
- 02 rooms
- 63 rooms
- 904 rooms
- 175 rooms
- 126 rooms
- 167 rooms
- 578 rooms
- 79+ rooms
Owner-occupied
Renter-occupied
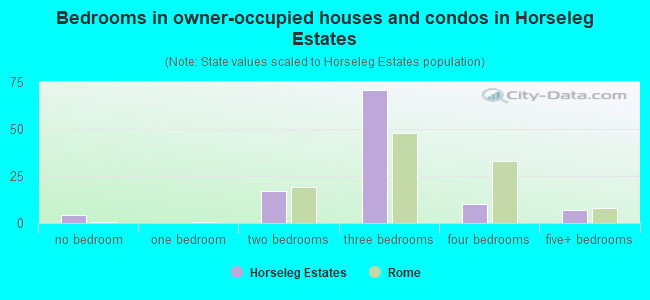
- Bedrooms in owner-occupied houses and condos in Horseleg Estates
- 4no bedroom
- 01 bedroom
- 172 bedrooms
- 713 bedrooms
- 104 bedrooms
- 75+ bedrooms
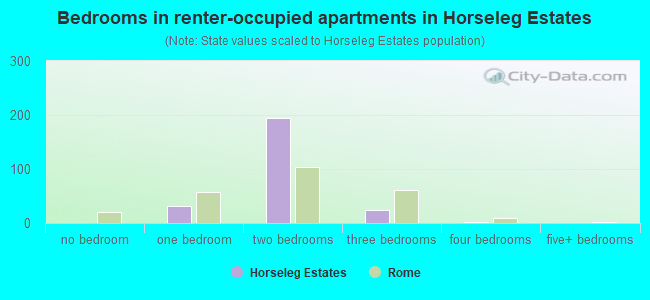
- Bedrooms in renter-occupied apartments in Horseleg Estates
- 0no bedroom
- 321 bedroom
- 1952 bedrooms
- 253 bedrooms
- 24 bedrooms
- 05+ bedrooms
Average number of cars or other vehicles available in houses/condos:
Average number of cars or other vehicles available in apartments:
| This neighborhood: | 10.6 |
| Rome: | 2.1 |
Average number of cars or other vehicles available in apartments:
| Here: | 9.1 |
| city: | 1.0 |
Percentage of units with a mortgage:
| Horseleg Estates: | 39.6% |
| Rome: | 54.9% |
Average estimated value of detached houses in 2022 (79.0% of all units):
| Horseleg Estates: | $211,722 |
| Georgia: | $376,364 |
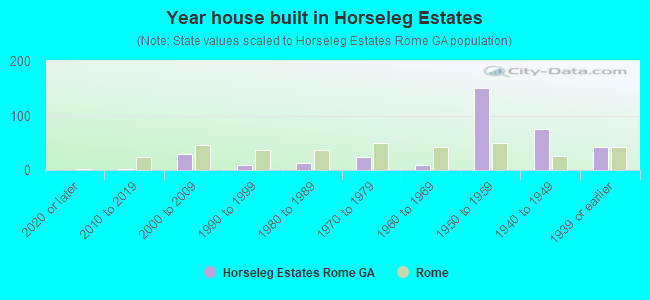
- Year house built in Horseleg Estates
- 02020 or later
- 12010 to 2019
- 292000 to 2009
- 91990 to 1999
- 131980 to 1989
- 241970 to 1979
- 91960 to 1969
- 1511950 to 1959
- 751940 to 1949
- 421939 or earlier
City-data.com crime index for city in 2020 (higher means more crime):
| City: | 213.7 |
| U.S. average: | 219.5 |
Travel time to work (commute)
![Travel time to work (commute)]()
- 39Less than 5 minutes
- 205 to 9 minutes
- 6210 to 14 minutes
- 6315 to 19 minutes
- 3220 to 24 minutes
- 1325 to 29 minutes
- 2330 to 34 minutes
- 335 to 39 minutes
- 740 to 44 minutes
- 1645 to 59 minutes
- 9560 to 89 minutes
- 690 or more minutes

Means of transportation to work
![Means of transportation to work]()
- 71.2%154Drove a car alone
- 110.0%238Carpooled
- 10.2%22Bus
- 4.6%10Taxi
- 35.6%77Walked
- 0.5%1Other means
- 6.5%14Worked at home

Time leaving home to go to work
![Time leaving home to go to work]()
- 1112:00 a.m. to 4:59 a.m.
- 135:00 a.m. to 5:29 a.m.
- 175:30 a.m. to 5:59 a.m.
- 146:00 a.m. to 6:29 a.m.
- 176:30 a.m. to 6:59 a.m.
- 207:00 a.m. to 7:29 a.m.
- 487:30 a.m. to 7:59 a.m.
- 378:00 a.m. to 8:29 a.m.
- 48:30 a.m. to 8:59 a.m.
- 129:00 a.m. to 9:59 a.m.
- 1010:00 a.m. to 10:59 a.m.
- 111:00 a.m. to 11:59 a.m.
- 3312:00 p.m. to 3:59 p.m.
- 234:00 p.m. to 11:59 p.m.

Occupations of males:
- Percentage of males in management occupations (except farmers):
Here: 8.8% city: 10.2%
- Percentage of males in business and financial operations occupations:
Here: 2.1% city: 2.8%
- Percentage of males in computer and mathematical occupations:
Here: 3.3% city: 1.8%
- Percentage of males in architecture and engineering occupations:
Here: 3.0% city: 1.8%
- Percentage of males in education, training, and library occupations:
Here: 3.0% city: 4.0%
- Percentage of males in service occupations:
Here: 8.1% city: 18.0%
- Percentage of males in sales and office occupations:
Here: 12.3% city: 11.4%
- Percentage of males in farming, fishing, and forestry occupations:
Here: 11.9% city: 0.9%
- Percentage of males in construction, extraction, and maintenance occupations:
Here: 16.6% city: 10.3%
- Percentage of males in production occupations:
Here: 14.5% city: 15.0%
- Percentage of males in transportation occupations:
Here: 9.2% city: 3.2%
- Percentage of males in material moving occupations:
Here: 2.9% city: 5.6%
Occupations of females:
- Percentage of females in management occupations (except farmers):
Here: 5.6% city: 3.3%
- Percentage of females in business and financial operations occupations:
Here: 14.0% city: 5.1%
- Percentage of females in community and social services occupations:
Here: 7.4% city: 3.5%
- Percentage of females in legal occupations:
Here: 2.7% city: 1.1%
- Percentage of females in education, training, and library occupations:
Here: 1.7% city: 9.2%
- Percentage of females in healthcare practitioners and technical occupations:
Here: 20.1% city: 10.6%
- Percentage of females in service occupations:
Here: 15.2% city: 26.4%
- Percentage of females in sales and office occupations:
Here: 23.0% city: 23.6%
- Percentage of females in production occupations:
Here: 10.4% city: 9.7%
- Percentage of females in transportation occupations:
Here: 1.1% city: 2.0%
- Percentage of females in material moving occupations:
Here: 1.7% city: 2.1%
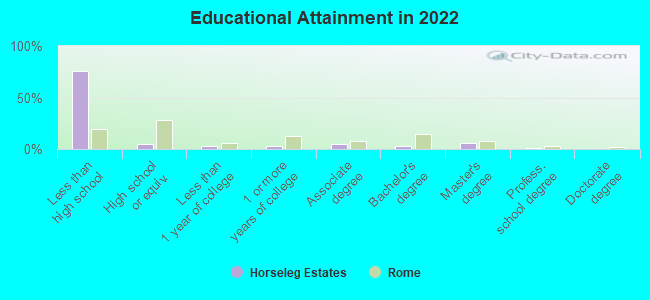
Education in this neighborhood (subdivision or community):
- Percentage of people 3 years and older in K-12 schools:
Horseleg Estates: 15.4% Rome: 18.8%
- Percentage of people 3 years and older in undergraduate colleges:
Horseleg Estates: 33.3% Rome: 4.7%
- Percentage of people 3 years and older in grad. or professional schools:
Horseleg Estates: 10.6% Rome: 1.0%
- Percentage of students K-12 enrolled in private schools:
Horseleg Estates: 19.1% Rome: 14.1%
Percentage of population below poverty level:
| Horseleg Estates: | 10.9% |
| Rome: | 22.2% |
Median year owner moved in (as recorded in 2022):
| Horseleg Estates: | 2007 |
| Rome: | 2008 |
Percentage of married-couple families with both working:
| Horseleg Estates: | 220.8% |
| Rome: | 68.1% |
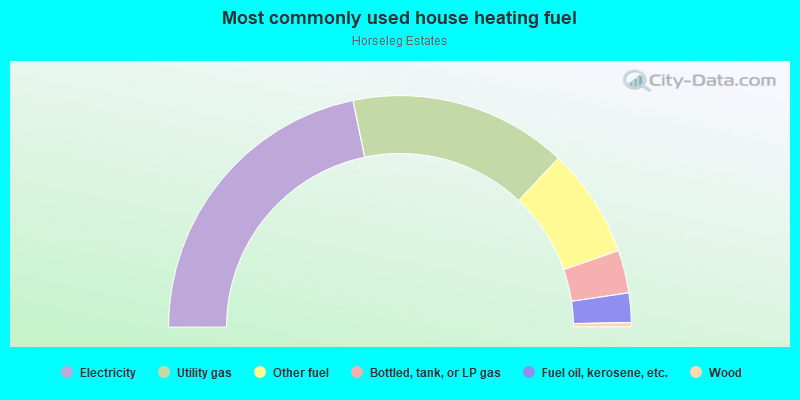
- 43.5%Electricity
- 30.5%Utility gas
- 15.3%Other fuel
- 6.0%Bottled, tank, or LP gas
- 4.1%Fuel oil, kerosene, etc.
- 0.6%Wood
Roads and streets:
Horseleg Creek Rd SW
Length: 1.60 miles
Directions: N-S, SW-NE
Address range: 94 to 930
Directions: N-S, SW-NE
Address range: 94 to 930
Pine Valley Rd
Length: 1.04 miles
Directions: E-W, N-S, SE-NW, SW-NE
Address range: 7 to 298
Directions: E-W, N-S, SE-NW, SW-NE
Address range: 7 to 298
Greenview Rd
Length: 0.79 miles
Directions: E-W, N-S, SE-NW, SW-NE
Address range: 216 to 1098
Directions: E-W, N-S, SE-NW, SW-NE
Address range: 216 to 1098
Featherston Rd SW
Length: 0.76 miles
Directions: E-W, N-S, SE-NW
Address range: 1 to 399
Directions: E-W, N-S, SE-NW
Address range: 1 to 399
Crestwood Dr
Length: 0.42 miles
Directions: E-W, N-S, SE-NW, SW-NE
Address range: 6 to 14
Directions: E-W, N-S, SE-NW, SW-NE
Address range: 6 to 14
Hilldale Ln
Length: 0.17 miles
Directions: E-W, N-S, SE-NW, SW-NE
Address range: 1 to 99
Directions: E-W, N-S, SE-NW, SW-NE
Address range: 1 to 99
Creek Side Way SW
Length: 0.16 miles
Directions: E-W, SE-NW
Address range: 1 to 99
Directions: E-W, SE-NW
Address range: 1 to 99
Bridlewood Ln SW
Length: 0.12 miles
Directions: E-W, N-S, SE-NW, SW-NE
Address range: 5 to 13
Directions: E-W, N-S, SE-NW, SW-NE
Address range: 5 to 13
Oakhill Ln
Length: 0.12 miles
Directions: N-S, SW-NE
Address range: 1 to 99
Directions: N-S, SW-NE
Address range: 1 to 99
Woodglen Rd
Length: 0.11 miles
Direction: E-W
Address range: 200 to 299
Direction: E-W
Address range: 200 to 299
Forest Ln
Length: 0.11 miles
Direction: SE-NW
Direction: SE-NW
Andrea Ct SW
Length: 0.10 miles
Directions: N-S, SW-NE
Address range: 1 to 99
Directions: N-S, SW-NE
Address range: 1 to 99
Featherstone Ridge
Length: 0.08 miles
Directions: N-S, SE-NW, SW-NE
Directions: N-S, SE-NW, SW-NE
Featherston Ct SW
Length: 0.04 miles
Direction: E-W
Address range: 1 to 27
Direction: E-W
Address range: 1 to 27
Ridge Creek Ct SW
Length: 0.04 miles
Direction: N-S
Direction: N-S
Other features:
Horseleg Crk
Length: 0.11 miles
Direction: E-W
Direction: E-W