Lexington Farms neighborhood in Indianapolis, Indiana (IN), 46280 detailed profile
Settings
X


Business Search - 14 Million verified businesses
Area: 0.144 square miles
Population: 247
Population density:
| Lexington Farms: | 1,711 people per square mile |
| Indianapolis: | 2,425 people per square mile |

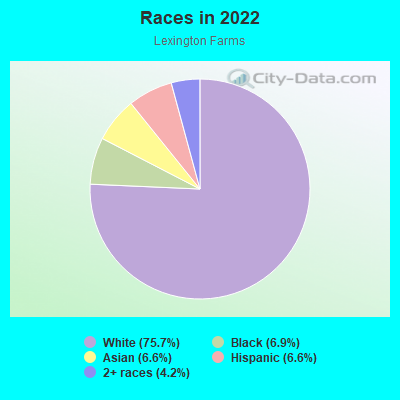
- 19675.7%White
- 186.9%Black
- 176.6%Asian
- 176.6%Hispanic or Latino
- 114.2%Two or more races
Median household income in 2022:
| Lexington Farms: | $81,402 |
| Indianapolis: | $61,501 |
Distribution of median household income
![Distribution of median household income]()
- 4Less than $10,000
- 3$10,000 to $19,999
- 5$20,000 to $29,999
- 15$30,000 to $39,999
- 12$40,000 to $49,999
- 7$50,000 to $59,999
- 17$60,000 to $74,999
- 17$75,000 to $99,999
- 10$100,000 to $124,999
- 8$125,000 to $149,999
- 8$150,000 to $199,999
- 19$200,000 or more

Distribution of owner-occupied house/condo value
![Distribution of owner-occupied house/condo value]()
- 3Less than $50,000
- 1$50,000 to $99,999
- 4$100,000 to $149,999
- 9$150,000 to $199,999
- 16$200,000 to $249,999
- 16$250,000 to $299,999
- 25$300,000 to $399,999
- 8$400,000 to $499,999
- 6$500,000 to $749,999
- 2$750,000 to $999,999

Distribution of rent paid by renters
![Distribution of rent paid by renters]()
- 5$500 to $599
- 5$700 to $799
- 5$800 to $899
- 5$900 to $999
- 2$1,000 to $1,249
- 3$1,250 to $1,499
- 10$1,500 to $1,999
- 6$2,000 or more

| Males: | 121 |
| Females: | 126 |
Males:
| This neighborhood: | 38.6 years |
| Whole city: | 32.9 years |
| This neighborhood: | 47.3 years |
| Whole city: | 35.4 years |
Average household size:
| Lexington Farms: | 2.3 people |
| Indianapolis: | 2.3 people |
Percentage of family households:
| Lexington Farms: | 43.7% |
| Indianapolis: | 42.9% |
| Here: | 48.5% |
| Indianapolis: | 37.4% |
Percentage of married-couple families with children (among all households):
| Lexington Farms: | 32.5% |
| Indianapolis: | 26.5% |
Percentage of single-mother households (among all households):
| Lexington Farms: | 8.8% |
| Indianapolis: | 12.9% |
Percentage of never married males 15 years old and over:
Percentage of never married females 15 years old and over:
| Lexington Farms: | 14.2% |
| Indianapolis: | 19.9% |
Percentage of never married females 15 years old and over:
| Lexington Farms: | 15.9% |
| city: | 19.2% |
Percentage of people that speak English not well or not at all:
| Lexington Farms: | 1.7% |
| Indianapolis: | 4.2% |
Percentage of people born in this state:
Percentage of people born in another U.S. state:
Percentage of native residents but born outside the U.S.:
Percentage of foreign born residents:
| Here: | 56.7% |
| Indianapolis: | 63.1% |
Percentage of people born in another U.S. state:
| Lexington Farms: | 30.6% |
| Indianapolis: | 23.6% |
Percentage of native residents but born outside the U.S.:
| Here: | 1.1% |
| city: | 1.1% |
Percentage of foreign born residents:
| Here: | 11.7% |
| Indianapolis: | 12.2% |
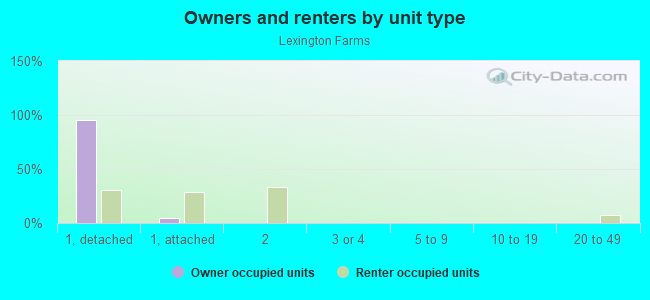
Owner-occupied
Renter-occupied

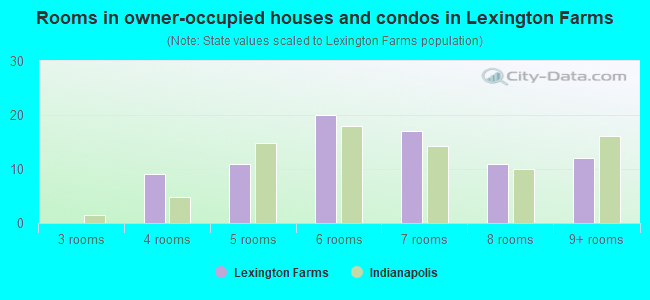
- Rooms in owner-occupied houses and condos in Lexington Farms
- 01 room
- 02 rooms
- 03 rooms
- 94 rooms
- 115 rooms
- 206 rooms
- 177 rooms
- 118 rooms
- 129+ rooms
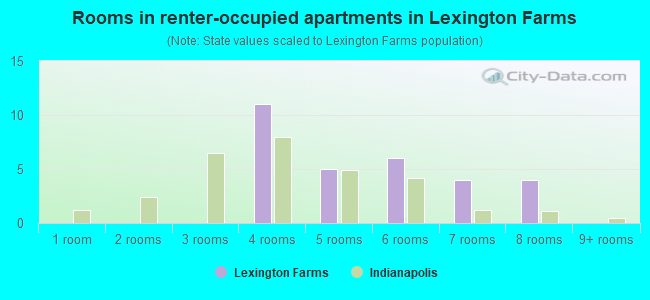
- Rooms in renter-occupied apartments in Lexington Farms
- 01 room
- 02 rooms
- 03 rooms
- 114 rooms
- 55 rooms
- 66 rooms
- 47 rooms
- 48 rooms
- 09+ rooms
Owner-occupied
Renter-occupied
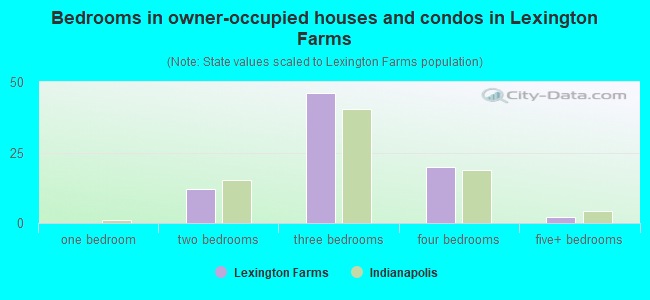
- Bedrooms in owner-occupied houses and condos in Lexington Farms
- 0no bedroom
- 01 bedroom
- 122 bedrooms
- 463 bedrooms
- 204 bedrooms
- 25+ bedrooms
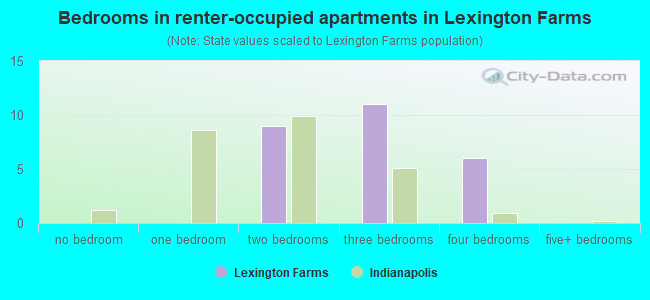
- Bedrooms in renter-occupied apartments in Lexington Farms
- 0no bedroom
- 01 bedroom
- 92 bedrooms
- 113 bedrooms
- 64 bedrooms
- 05+ bedrooms
Average number of cars or other vehicles available in houses/condos:
Average number of cars or other vehicles available in apartments:
| This neighborhood: | 2.0 |
| Indianapolis: | 2.0 |
Average number of cars or other vehicles available in apartments:
| Here: | 2.6 |
| city: | 1.2 |
Percentage of units with a mortgage:
| Lexington Farms: | 57.4% |
| Indianapolis: | 68.8% |
Housing prices:
- Average estimated value of detached houses in 2022 (76.9% of all units):
Lexington Farms: $286,777 Indiana: $257,916
- Average estimated value of townhouses or other attached units in 2022 (15.4% of all units):
This neighborhood: $348,991 Indiana: $224,114
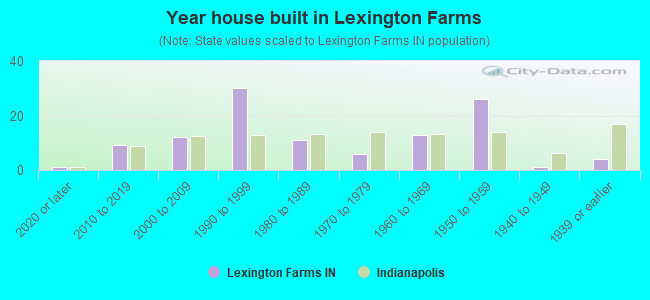
- Year house built in Lexington Farms
- 12020 or later
- 92010 to 2019
- 122000 to 2009
- 301990 to 1999
- 111980 to 1989
- 61970 to 1979
- 131960 to 1969
- 261950 to 1959
- 11940 to 1949
- 41939 or earlier
City-data.com crime index for city in 2020 (higher means more crime):
| City: | 465.4 |
| U.S. average: | 219.5 |
Travel time to work (commute)
![Travel time to work (commute)]()
- 4Less than 5 minutes
- 105 to 9 minutes
- 1110 to 14 minutes
- 1815 to 19 minutes
- 1520 to 24 minutes
- 125 to 29 minutes
- 2430 to 34 minutes
- 435 to 39 minutes
- 640 to 44 minutes
- 545 to 59 minutes
- 190 or more minutes

Means of transportation to work
![Means of transportation to work]()
- 65.6%90Drove a car alone
- 8.0%11Carpooled
- 0.7%1Bus
- 0.7%1Motorcycle
- 0.7%1Bicycle
- 0.7%1Walked
- 22.6%31Worked at home

Time leaving home to go to work
![Time leaving home to go to work]()
- 112:00 a.m. to 4:59 a.m.
- 15:30 a.m. to 5:59 a.m.
- 66:00 a.m. to 6:29 a.m.
- 106:30 a.m. to 6:59 a.m.
- 157:00 a.m. to 7:29 a.m.
- 257:30 a.m. to 7:59 a.m.
- 118:00 a.m. to 8:29 a.m.
- 138:30 a.m. to 8:59 a.m.
- 49:00 a.m. to 9:59 a.m.
- 210:00 a.m. to 10:59 a.m.
- 411:00 a.m. to 11:59 a.m.
- 212:00 p.m. to 3:59 p.m.
- 44:00 p.m. to 11:59 p.m.

Occupations of males:
- Percentage of males in management occupations (except farmers):
Here: 11.3% city: 10.3%
- Percentage of males in business and financial operations occupations:
Here: 14.5% city: 5.4%
- Percentage of males in computer and mathematical occupations:
Here: 7.5% city: 4.6%
- Percentage of males in architecture and engineering occupations:
Here: 5.4% city: 2.6%
- Percentage of males in community and social services occupations:
Here: 2.6% city: 1.3%
- Percentage of males in arts, design, entertainment, sports, and media occupations:
Here: 2.3% city: 1.9%
- Percentage of males in healthcare practitioners and technical occupations:
Here: 5.6% city: 2.7%
- Percentage of males in service occupations:
Here: 17.4% city: 12.5%
- Percentage of males in sales and office occupations:
Here: 13.4% city: 15.6%
- Percentage of males in construction, extraction, and maintenance occupations:
Here: 6.3% city: 7.9%
- Percentage of males in production occupations:
Here: 1.1% city: 9.0%
- Percentage of males in transportation occupations:
Here: 7.5% city: 6.4%
Occupations of females:
- Percentage of females in management occupations (except farmers):
Here: 9.8% city: 8.6%
- Percentage of females in business and financial operations occupations:
Here: 17.8% city: 6.9%
- Percentage of females in computer and mathematical occupations:
Here: 1.6% city: 2.0%
- Percentage of females in community and social services occupations:
Here: 1.0% city: 2.8%
- Percentage of females in legal occupations:
Here: 1.6% city: 1.3%
- Percentage of females in education, training, and library occupations:
Here: 8.6% city: 7.5%
- Percentage of females in arts, design, entertainment, sports, and media occupations:
Here: 5.6% city: 2.1%
- Percentage of females in healthcare practitioners and technical occupations:
Here: 9.3% city: 10.8%
- Percentage of females in service occupations:
Here: 16.8% city: 18.5%
- Percentage of females in sales and office occupations:
Here: 26.0% city: 26.4%
- Percentage of females in production occupations:
Here: 1.8% city: 4.5%
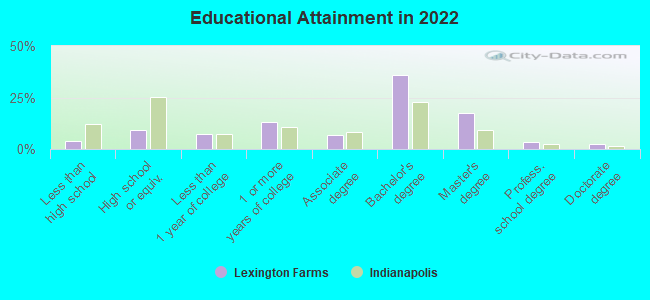
Education in this neighborhood (subdivision or community):
- Percentage of people 3 years and older in K-12 schools:
Lexington Farms: 14.9% Indianapolis: 17.3%
- Percentage of people 3 years and older in undergraduate colleges:
Lexington Farms: 3.3% Indianapolis: 4.5%
- Percentage of people 3 years and older in grad. or professional schools:
Lexington Farms: 0.8% Indianapolis: 1.9%
- Percentage of students K-12 enrolled in private schools:
Lexington Farms: 13.9% Indianapolis: 14.8%
Percentage of population below poverty level:
| Lexington Farms: | 6.0% |
| Indianapolis: | 15.9% |
Median year owner moved in (as recorded in 2022):
| Lexington Farms: | 2008 |
| Indianapolis: | 2012 |
Percentage of married-couple families with both working:
| Lexington Farms: | 89.5% |
| Indianapolis: | 72.1% |
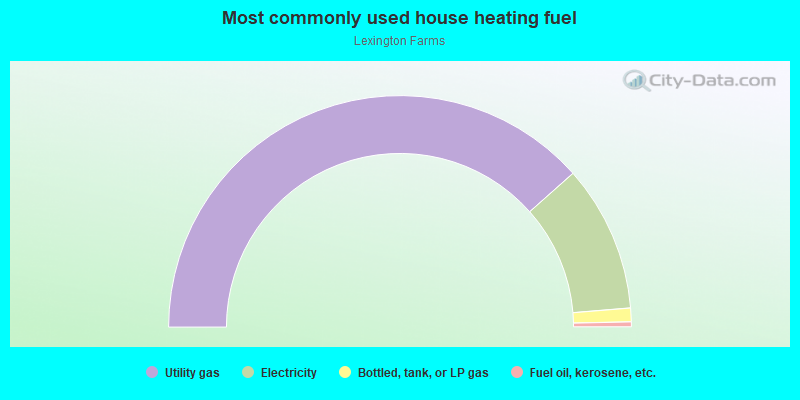
- 76.9%Utility gas
- 20.5%Electricity
- 1.9%Bottled, tank, or LP gas
- 0.7%Fuel oil, kerosene, etc.
Roads and streets:
Lexington Dr
Length: 0.53 miles
Directions: N-S, SE-NW, SW-NE
Address range: 10671 to 10877
Directions: N-S, SE-NW, SW-NE
Address range: 10671 to 10877
Pimlico Cir
Length: 0.47 miles
Directions: E-W, N-S, SE-NW, SW-NE
Address range: 1069 to 10813
Directions: E-W, N-S, SE-NW, SW-NE
Address range: 1069 to 10813
Belmont Cir
Length: 0.41 miles
Directions: E-W, N-S, SE-NW, SW-NE
Address range: 1008 to 10899
Directions: E-W, N-S, SE-NW, SW-NE
Address range: 1008 to 10899
Saratoga Cir
Length: 0.40 miles
Directions: E-W, N-S, SE-NW, SW-NE
Address range: 1000 to 1099
Directions: E-W, N-S, SE-NW, SW-NE
Address range: 1000 to 1099
Belair Dr
Length: 0.24 miles
Directions: E-W, N-S, SE-NW, SW-NE
Address range: 10732 to 10864
Directions: E-W, N-S, SE-NW, SW-NE
Address range: 10732 to 10864
E 106th St
Length: 0.20 miles
Direction: E-W
Address range: 1036 to 1235
Direction: E-W
Address range: 1036 to 1235
Aqueduct Way
Length: 0.19 miles
Directions: E-W, N-S, SE-NW, SW-NE
Address range: 1100 to 1161
Directions: E-W, N-S, SE-NW, SW-NE
Address range: 1100 to 1161
Latonia Ln
Length: 0.11 miles
Directions: N-S, SW-NE
Address range: 1714 to 11092
Directions: N-S, SW-NE
Address range: 1714 to 11092
Churchill Ct
Length: 0.09 miles
Directions: E-W, SW-NE
Address range: 1025 to 1068
Directions: E-W, SW-NE
Address range: 1025 to 1068
Keeneland Ct
Length: 0.09 miles
Directions: E-W, SE-NW
Address range: 1100 to 1137
Directions: E-W, SE-NW
Address range: 1100 to 1137
Clairborne Ct
Length: 0.07 miles
Directions: E-W, SE-NW
Address range: 1100 to 1141
Directions: E-W, SE-NW
Address range: 1100 to 1141
Hialea Ct
Length: 0.06 miles
Directions: E-W, SW-NE
Address range: 1113 to 1141
Directions: E-W, SW-NE
Address range: 1113 to 1141
Arlington Ct
Length: 0.06 miles
Direction: E-W
Address range: 1000 to 1199
Direction: E-W
Address range: 1000 to 1199
Santa Anita Ct
Length: 0.05 miles
Directions: N-S, SW-NE
Address range: 10873 to 10921
Directions: N-S, SW-NE
Address range: 10873 to 10921