Estimated zip code population in 2022: 7,396 Zip code population in 2010: 6,793 Zip code population in 2000: 6,338
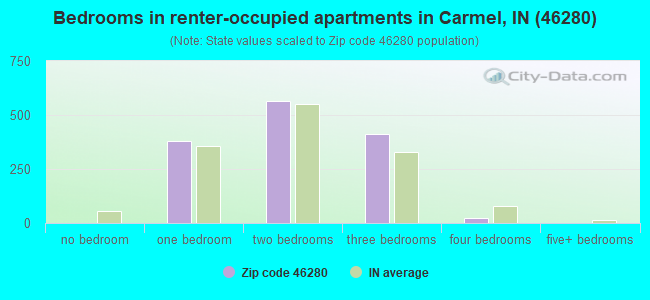
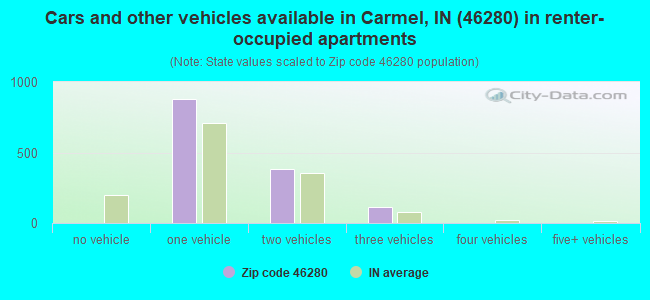
Houses and condos: 3,954 Renter-occupied apartments: 1,376
% of renters here:
38%
State:
29%
March 2022 cost of living index in zip code 46280: 90.2 (less than average, U.S. average is 100)
Land area: 4.3 sq. mi. Water area: 0.2 sq. mi.
Population density: 1,733 people per square mile
(low).
OSM Map
General Map
Google Map
MSN Map
OSM Map
General Map
Google Map
MSN Map
OSM Map
General Map
Google Map
MSN Map
OSM Map
General Map
Google Map
MSN Map
Please wait while loading the map...
Real estate property taxes paid for housing units in 2022:
This zip code:
0.7% ($2,189)
Indiana:
0.7% ($1,467)
Median real estate property taxes paid for housing units with mortgages in 2022: $2,045 (0.7%) Median real estate property taxes paid for housing units with no mortgage in 2022: $2,447 (0.8%)
Estimated median house/condo value in 2022: $305,207
46280:
$305,207
Indiana:
$208,700
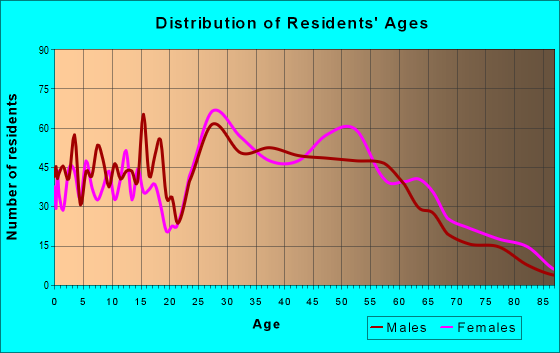
Median resident age:
This zip code:
42.9 years
Indiana median age:
38.2 years
Average household size:
This zip code:
2.0 people
Indiana:
2.4 people
Averages for the 2020 tax year for zip code 46280, filed in 2021:
Average Adjusted Gross Income (AGI) in 2020: $86,695 (Individual Income Tax Returns)
Here:
$86,695
State:
$64,978
Salary/wage: $68,110 (reported on 83.8% of returns)
Here:
$68,110
State:
$55,245
(% of AGI for various income ranges: 1170.9% for AGIs below $25k, 3619.6% for AGIs $25k-50k, 7120.5% for AGIs $50k-75k, 10017.1% for AGIs $75k-100k, 20826.4% for AGIs $100k-200k, 81234.3% for AGIs over 200k)
Taxable interest for individuals: $2,030 (reported on 33.9% of returns)
This zip code:
$2,030
Indiana:
$1,351
(% of AGI for various income ranges: 16.9% for AGIs below $25k, 23.2% for AGIs $25k-50k, 35.2% for AGIs $50k-75k, 48.9% for AGIs $75k-100k, 137.7% for AGIs $100k-200k, 2584.3% for AGIs over 200k)
Ordinary dividends: $5,689 (reported on 26.2% of returns)
Here:
$5,689
State:
$5,827
(% of AGI for various income ranges: 42.0% for AGIs below $25k, 57.1% for AGIs $25k-50k, 111.8% for AGIs $50k-75k, 131.7% for AGIs $75k-100k, 371.8% for AGIs $100k-200k, 4624.3% for AGIs over 200k)
Net capital gain/loss in AGI: +$28,525 (reported on 23.7% of returns)
Here:
+$28,525
State:
+$17,730
(% of AGI for various income ranges: 9.9% for AGIs below $25k, 28.0% for AGIs $25k-50k, 148.6% for AGIs $50k-75k, 174.0% for AGIs $75k-100k, 693.1% for AGIs $100k-200k, 36035.7% for AGIs over 200k)
Profit/loss from business: +$14,074 (reported on 16.9% of returns)
Here:
+$14,074
State:
+$12,144
(% of AGI for various income ranges: 178.9% for AGIs below $25k, 198.0% for AGIs $25k-50k, 262.1% for AGIs $50k-75k, 423.7% for AGIs $75k-100k, 524.1% for AGIs $100k-200k, 3588.6% for AGIs over 200k)
Taxable individual retirement arrangement distribution: $18,043 (reported on 10.0% of returns)
46280:
$18,043
Indiana:
$18,302
(% of AGI for various income ranges: 122.4% for AGIs below $25k, 108.6% for AGIs $25k-50k, 214.8% for AGIs $50k-75k, 345.7% for AGIs $75k-100k, 649.2% for AGIs $100k-200k, 1741.4% for AGIs over 200k)
Self-employed (Keogh) retirement plans: $20,600 (reported on 0.7% of returns)
46280:
$20,600
Indiana:
$27,160
(% of AGI for various income ranges: 176.6% for AGIs $75k-100k)
Total itemized deductions: $46,841 (reported on 7.3% of returns)
Here:
$46,841
State:
$35,601
(% of AGI for various income ranges: 114.2% for AGIs below $25k, 167.3% for AGIs $50k-75k, 230.6% for AGIs $75k-100k, 769.2% for AGIs $100k-200k, 13428.6% for AGIs over 200k)
Charity contributions: $18,559 (reported on 6.2% of returns)
Here:
$18,559
State:
$15,596
(% of AGI for various income ranges: 10.0% for AGIs below $25k, 23.4% for AGIs $50k-75k, 62.0% for AGIs $75k-100k, 202.8% for AGIs $100k-200k, 5425.7% for AGIs over 200k)
Taxes paid: $7,647 (reported on 7.3% of returns)
46280:
$7,647
State:
$7,542
(% of AGI for various income ranges: 14.3% for AGIs below $25k, 39.6% for AGIs $50k-75k, 64.0% for AGIs $75k-100k, 251.5% for AGIs $100k-200k, 1305.7% for AGIs over 200k)
Earned income credit: $1,860 (reported on 9.1% of returns)
Here:
$1,860
State:
$2,298
(% of AGI for various income ranges: 60.0% for AGIs below $25k, 37.5% for AGIs $25k-50k)
Percentage of individuals using paid preparers for their 2020 taxes: 92.7%
Here:
93%
State:
94%
(% for various income ranges: 90.7% for AGIs below $25k, 93.1% for AGIs $25k-50k, 93.7% for AGIs $50k-75k, 94.1% for AGIs $75k-100k, 93.4% for AGIs $100k-200k, 92.0% for AGIs over 200k)
Averages for the 2012 tax year for zip code 46280, filed in 2013:
Average Adjusted Gross Income (AGI) in 2012: $67,148 (Individual Income Tax Returns)
Here:
$67,148
State:
$52,932
Salary/wage: $52,627 (reported on 85.1% of returns)
Here:
$52,627
State:
$45,173
(% of AGI for various income ranges: 70.5% for AGIs below $25k, 80.1% for AGIs $25k-50k, 80.2% for AGIs $50k-75k, 81.6% for AGIs $75k-100k, 79.8% for AGIs $100k-200k, 30.9% for AGIs over 200k)
Taxable interest for individuals: $2,203 (reported on 35.0% of returns)
This zip code:
$2,203
Indiana:
$1,311
(% of AGI for various income ranges: 1.3% for AGIs below $25k, 0.4% for AGIs $25k-50k, 0.5% for AGIs $50k-75k, 0.7% for AGIs $75k-100k, 0.4% for AGIs $100k-200k, 2.9% for AGIs over 200k)
Ordinary dividends: $5,096 (reported on 24.5% of returns)
Here:
$5,096
State:
$4,690
(% of AGI for various income ranges: 2.5% for AGIs below $25k, 1.5% for AGIs $25k-50k, 0.8% for AGIs $50k-75k, 1.3% for AGIs $75k-100k, 2.0% for AGIs $100k-200k, 2.7% for AGIs over 200k)
Net capital gain/loss in AGI: +$21,109 (reported on 19.3% of returns)
Here:
+$21,109
State:
+$10,406
(% of AGI for various income ranges: 0.3% for AGIs $25k-50k, 0.7% for AGIs $50k-75k, 0.5% for AGIs $75k-100k, 1.6% for AGIs $100k-200k, 20.8% for AGIs over 200k)
Profit/loss from business: +$11,329 (reported on 17.4% of returns)
Here:
+$11,329
State:
+$11,105
(% of AGI for various income ranges: 10.8% for AGIs below $25k, 3.8% for AGIs $25k-50k, 3.9% for AGIs $50k-75k, 2.4% for AGIs $75k-100k, 3.5% for AGIs $100k-200k)
Taxable individual retirement arrangement distribution: $13,512 (reported on 11.6% of returns)
46280:
$13,512
Indiana:
$13,841
(% of AGI for various income ranges: 4.8% for AGIs below $25k, 2.8% for AGIs $25k-50k, 3.4% for AGIs $50k-75k, 2.4% for AGIs $75k-100k, 3.3% for AGIs $100k-200k)
Self-employment retirement plans: $14,567 (reported on 0.8% of returns)
46280:
$14,567
Indiana:
$21,482
Total itemized deductions: $21,428 (17% of AGI, reported on 34.4% of returns)
Here:
$21,428
State:
$20,913
Here:
17.4% of AGI
State:
18.2% of AGI
(% of AGI for various income ranges: 9.9% for AGIs below $25k, 7.7% for AGIs $25k-50k, 10.1% for AGIs $50k-75k, 10.8% for AGIs $75k-100k, 12.6% for AGIs $100k-200k, 12.1% for AGIs over 200k)
Charity contributions: $4,386 (reported on 28.1% of returns)
Here:
$4,386
State:
$4,697
(% of AGI for various income ranges: 0.9% for AGIs below $25k, 0.8% for AGIs $25k-50k, 1.4% for AGIs $50k-75k, 1.9% for AGIs $75k-100k, 2.3% for AGIs $100k-200k, 2.4% for AGIs over 200k)
Taxes paid: $7,741 (reported on 34.4% of returns)
46280:
$7,741
State:
$7,456
(% of AGI for various income ranges: 1.5% for AGIs below $25k, 1.8% for AGIs $25k-50k, 2.9% for AGIs $50k-75k, 3.4% for AGIs $75k-100k, 4.5% for AGIs $100k-200k, 6.1% for AGIs over 200k)
Earned income credit: $1,945 (reported on 12.9% of returns)
Here:
$1,945
State:
$2,265
(% of AGI for various income ranges: 5.0% for AGIs below $25k, 0.8% for AGIs $25k-50k)
Percentage of individuals using paid preparers for their 2012 taxes: 44.4%
Here:
44%
State:
53%
(% for various income ranges: 41.2% for AGIs below $25k, 42.7% for AGIs $25k-50k, 44.9% for AGIs $50k-75k, 43.2% for AGIs $75k-100k, 51.1% for AGIs $100k-200k, 66.7% for AGIs over 200k)
Averages for the 2004 tax year for zip code 46280, filed in 2005:
Average Adjusted Gross Income (AGI) in 2004: $53,167 (Individual Income Tax Returns)
Here:
$53,167
State:
$44,790
Salary/wage: $45,592 (reported on 87.0% of returns)
Here:
$45,592
State:
$39,615
(% of AGI for various income ranges: 221.8% for AGIs below $10k, 78.7% for AGIs $10k-25k, 83.9% for AGIs $25k-50k, 82.9% for AGIs $50k-75k, 82.6% for AGIs $75k-100k, 58.7% for AGIs over 100k)
Taxable interest for individuals: $1,517 (reported on 48.0% of returns)
This zip code:
$1,517
Indiana:
$1,535
(% of AGI for various income ranges: 12.3% for AGIs below $10k, 2.8% for AGIs $10k-25k, 1.2% for AGIs $25k-50k, 1.1% for AGIs $50k-75k, 1.2% for AGIs $75k-100k, 1.3% for AGIs over 100k)
Taxable dividends: $2,794 (reported on 30.5% of returns)
Here:
$2,794
State:
$2,998
(% of AGI for various income ranges: 13.9% for AGIs below $10k, 1.7% for AGIs $10k-25k, 1.0% for AGIs $25k-50k, 1.2% for AGIs $50k-75k, 1.1% for AGIs $75k-100k, 2.1% for AGIs over 100k)
Net capital gain/loss: +$7,268 (reported on 23.4% of returns)
Here:
+$7,268
State:
+$8,619
(% of AGI for various income ranges: -1.1% for AGIs below $10k, -0.9% for AGIs $10k-25k, 0.2% for AGIs $25k-50k, 0.6% for AGIs $50k-75k, 0.9% for AGIs $75k-100k, 8.0% for AGIs over 100k)
Profit/loss from business: +$12,455 (reported on 16.2% of returns)
Here:
+$12,455
State:
+$10,071
(% of AGI for various income ranges: -9.2% for AGIs below $10k, 6.9% for AGIs $10k-25k, 3.8% for AGIs $25k-50k, 3.7% for AGIs $50k-75k, 4.7% for AGIs $75k-100k, 3.1% for AGIs over 100k)
IRA payment deduction: $2,906 (reported on 3.3% of returns)
46280:
$2,906
Indiana:
$2,840
(% of AGI for various income ranges: 0.4% for AGIs $10k-25k, 0.2% for AGIs $25k-50k, 0.2% for AGIs $50k-75k, 0.2% for AGIs $75k-100k, 0.1% for AGIs over 100k)
Self-employed pension: $8,455 (reported on 0.9% of returns)
Here:
$8,455
Indiana:
$15,305
Total itemized deductions: $16,044 (19% of AGI, reported on 42.1% of returns)
Here:
$16,044
State:
$17,065
Here:
19.0% of AGI
State:
19.5% of AGI
(% of AGI for various income ranges: 42.4% for AGIs below $10k, 13.1% for AGIs $10k-25k, 12.0% for AGIs $25k-50k, 13.7% for AGIs $50k-75k, 14.2% for AGIs $75k-100k, 11.2% for AGIs over 100k)
Charity contributions deductions: $3,277 (4% of AGI, reported on 36.3% of returns)
Here:
$3,277
State:
$3,550
Here:
3.7% of AGI
State:
3.8% of AGI
(% of AGI for various income ranges: 1.5% for AGIs below $10k, 1.5% for AGIs $10k-25k, 1.4% for AGIs $25k-50k, 1.8% for AGIs $50k-75k, 2.4% for AGIs $75k-100k, 2.9% for AGIs over 100k)
Total tax: $8,496 (reported on 80.7% of returns)
46280:
$8,496
State:
$6,914
(% of AGI for various income ranges: 7.5% for AGIs below $10k, 4.6% for AGIs $10k-25k, 8.1% for AGIs $25k-50k, 10.5% for AGIs $50k-75k, 11.5% for AGIs $75k-100k, 18.7% for AGIs over 100k)
Earned income credit: $1,591 (reported on 9.3% of returns)
Here:
$1,591
State:
$1,685
Percentage of individuals using paid preparers for their 2004 taxes: 48.7%
Here:
49%
State:
59%
(% for various income ranges: 40.8% for AGIs below $10k, 49.5% for AGIs $10k-25k, 48.9% for AGIs $25k-50k, 47.8% for AGIs $50k-75k, 48.9% for AGIs $75k-100k, 61.1% for AGIs over 100k)
Household received Food Stamps/SNAP in the past 12 months: 157 Household did not receive Food Stamps/SNAP in the past 12 months: 3,505
Women who had a birth in the past 12 months: 55 (59 now married, 0 unmarried) Women who did not have a birth in the past 12 months: 1,887 (778 now married, 1,108 unmarried)
Housing units in zip code 46280 with a mortgage: 1,225 (147 second mortgage, 152 both second mortgage and home equity loan) Houses without a mortgage: 34
Median monthly owner costs for units with a mortgage: $1,444 Median monthly owner costs for units without a mortgage: $536
Residents with income below the poverty level in 2022:
This zip code:
6.2%
Whole state:
12.6%
Residents with income below 50% of the poverty level in 2022:
This zip code:
2.2%
Whole state:
6.3%
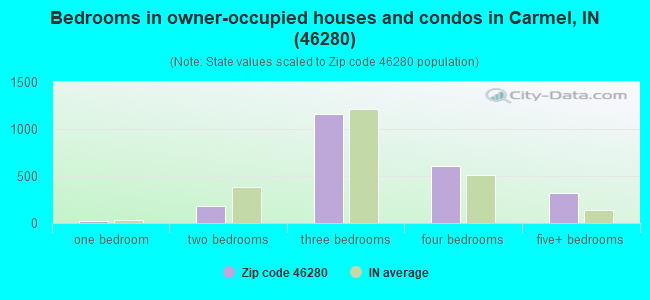
Median number of rooms in houses and condos:
Here:
7.3
State:
6.6
Median number of rooms in apartments:
Here:
4.3
State:
4.3
Notable locations in this zip code not listed on our city pages
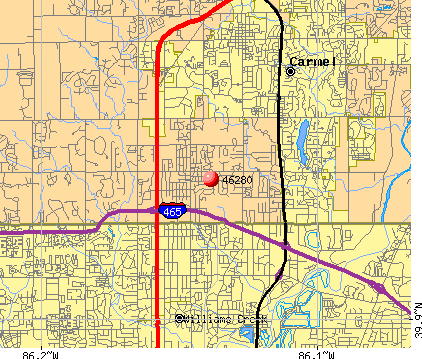
Notable locations in zip code 46280: Nelson Office Park (A), Sunrise Golf Course (B), Meridian Corporate Plaza (C), Carmel Fire Department Station 45 (D). Display/hide their locations on the map
Churches in zip code 46280 include: Lighthouse Tabernacle (A), Home Place Church (B), Hope Christian and Missionary Alliance Church (C), Pleasant Grove Church (D). Display/hide their locations on the map
In group quarters: 19 (-1 institutionalized population)
Size of family households: 826 2-persons, 657 3-persons, 248 4-persons, 170 5-persons, 9 6-persons
Size of nonfamily households: 1,294 1-person, 406 2-persons, 56 3-persons
948 married couples with children.
279 single-parent households (29 men, 250 women).
89.7% of residents of 46280 zip code speak English at home.
5.5% of residents speak Spanish at home (86% very well, 14% well).
0.8% of residents speak other Indo-European language at home (100% very well).
0.7% of residents speak Asian or Pacific Island language at home (100% very well).
4.3% of residents speak other language at home (63% very well, 37% well).
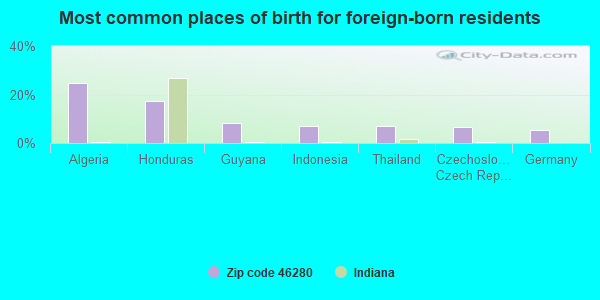
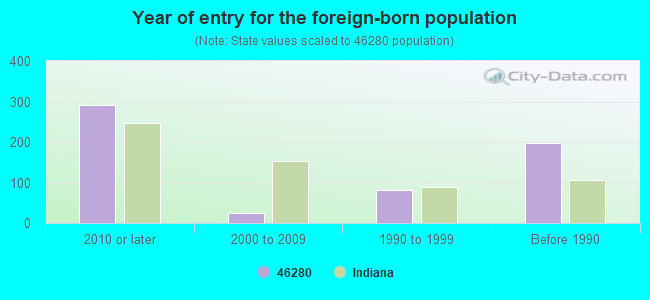
Foreign born population: 523 (7.1%) (78.0% of them are naturalized citizens)
This zip code:
7.1%
Whole state:
6.1%
25%Algeria
18%Honduras
8%Guyana
7%Indonesia
7%Thailand
6%Czechoslovakia (includes Czech Republic and Slovakia)
Facilities with environmental interests located in this zip code:
DELTA FAUCET CO (55 E 111TH ST in INDIANAPOLIS, IN)
ENFORCEMENT/COMPLIANCE ACTIVITY (Integrated Compliance Information System) - ICIS-HQ-2001-3072, FORMAL ENFORCEMENT ACTION (Integrated Compliance Information System) - ICIS-HQ-2001-3072, FORMAL ENFORCEMENT ACTION STATE MASTER (Indiana facility tracking)
CARMEL WASTEWATER TREATMENT PLANT (9609 NORTH RIVER ROAD in INDIANAPOLIS, IN)
STATE MASTER (Indiana facility tracking) - UST-10078, UNDERGROUND STORAGE TANK PROGRAM, CRTK-1380, EPCRA National Pollutant Discharge Elimination System MAJOR (Tracking pollutant discharge elimination systems) - permit Business SIC classification: SEWERAGE SYSTEMS Organizations: JORDAN J KLEINSMITH 15515 (CONTACT/OPERATOR)
, CARMEL CITY HALL (CONTACT/OWNER)
Alternative names: CARMEL MUNICIPAL STP, CARMEL MUNICIPAL WWTP
LIGHTHOUSE TABERNACLE INC (2599 E 98TH ST in INDIANAPOLIS, IN)
STATE MASTER (Indiana facility tracking) - UST-12215, UNDERGROUND STORAGE TANK PROGRAM COMPLIANCE ACTIVITY (Tracking inspections of insecticide, fungicide, and rodenticide, and toxic substances) Alternative names: TABERNACLE CHRISTIAN ACADEMY 29
BRUKS PROPERTY (11173 HAZEL DELL PKWY in INDIANAPOLIS, IN)
STATE MASTER (Indiana facility tracking) (Resource Conservation and Recovery Act (tracking hazardous waste))
AMERICAN AGGREGATES CORP (11010 N RIVER RD in INDIANAPOLIS, IN)
AIR MINOR (AIRS/AFS) STATE MASTER (Indiana facility tracking) Business SIC classification: CONSTRUCTION SAND AND GRAVEL
CARMAX #7144 (9750 N GRAY RD in INDIANAPOLIS, IN)
STATE MASTER (Indiana facility tracking) Small Quantity Generators, between 100 kg and 1000 kg of hazardous waste/month (Resource Conservation and Recovery Act (tracking hazardous waste)) Organizations: CARMAX AUTO SUPERSTORES INC (CONTACT/OPERATOR)
DAY NURS ASSN INDPLS PL 32 (11218 W WASHINGTON ST in INDIANAPOLIS, IN)
STATE MASTER (Indiana facility tracking) COMPLIANCE ACTIVITY (Tracking inspections of insecticide, fungicide, and rodenticide, and toxic substances)
Housing units lacking complete kitchen facilities: 1.2%
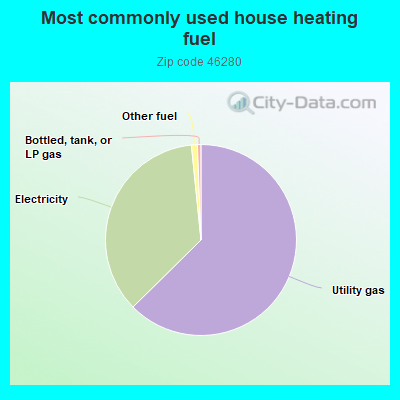
62.5%Utility gas
35.7%Electricity
1.0%Other fuel
0.6%Bottled, tank, or LP gas
Population in 1990: 5,281. Population change in the 1990s: +1,057 (+20.0%).
Place of birth for U.S.-born residents:
This state: 4,545
Northeast: 399
Midwest: 1,107
South: 458
West: 315
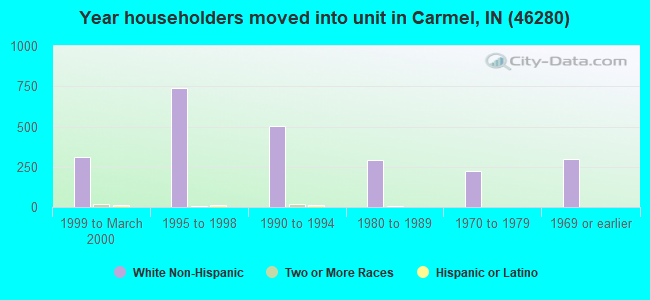
57% of the 46280 zip code residents lived in the same house 5 years ago. Out of people who lived in different houses, 26% lived in this county. Out of people who lived in different counties, 50% lived in Indiana.
91% of the 46280 zip code residents lived in the same house 1 year ago. Out of people who lived in different houses, 29% moved from this county. Out of people who lived in different houses, 56% moved from different county within same state. Out of people who lived in different houses, 18% moved from different state.
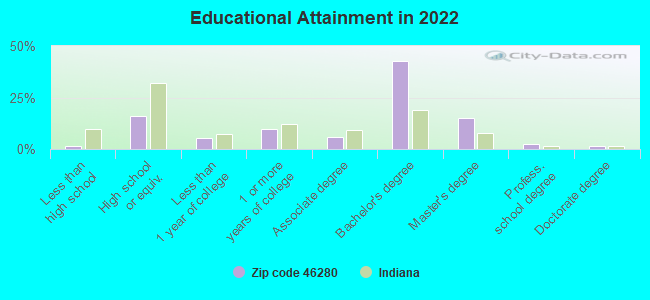
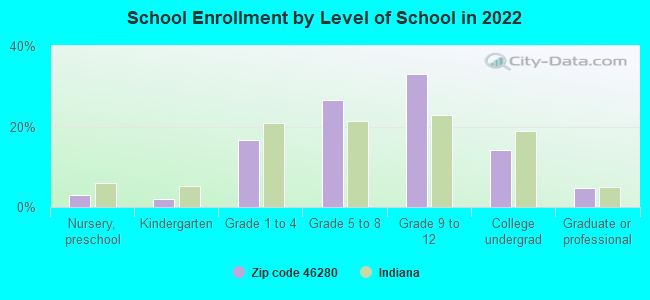
Private vs. public school enrollment:
Students in private schools in grades 1 to 8 (elementary and middle school): 70
Here:
11.4%
Indiana:
14.9%
Students in private schools in grades 9 to 12 (high school): 40
Here:
8.5%
Indiana:
11.4%
Students in private undergraduate colleges: 52
Here:
26.0%
Indiana:
22.3%
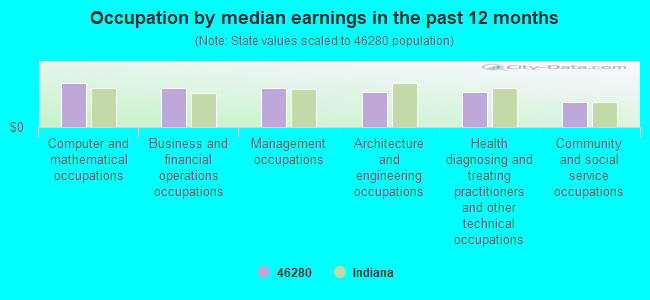
Occupation by median earnings in the past 12 months ($)
105,202Computer and mathematical occupations
93,496Business and financial operations occupations
93,371Management occupations
84,365Architecture and engineering occupations
83,592Health diagnosing and treating practitioners and other technical occupations
60,863Community and social service occupations
Companies with federal contracts located in this zip code:
ENTERPRISE LEASING CO OF INDIA (9799 ENTERPRISE DR in INDIANAPOLIS, IN) : $108,587 in 13 contractsfrom 2001 to 2005
Contracts for Lease or Rental of Equipment -- Ground Effect Vehicles, Motor Vehicles, Trailers, and Cycles, Motor Passenger Services by Air Force, Army, Navy Signed by year:2000: $0; 2001: $86,721; 2002: $0; 2003: $0; 2004: $19,605; 2005: $2,261; 2006: $0.
Biggest contracts:
$34,883 with Air Force for Lease or Rental of Equipment -- Ground Effect Vehicles, Motor Vehicles, Trailers, and Cycles. Signed on 2001-11-30. Completion date: 2002-01-31.
$25,919, same as above.Signed on 2001-10-03. Completion date: 2001-10-31.
$25,919, same as above.Signed on 2001-10-30. Completion date: 2001-11-30.
$8,765 with Army for Motor Passenger Services. Signed on 2004-09-21. Completion date: 2004-09-30.
INTERNATIONAL MARINE SYSTEMS, (9655 BAUER DR in INDIANAPOLIS, IN; small business) : $72,000 in 2 contractsin 2001
$38,400 with Navy for Ship and Boat Propulsion Components. Signed on 2001-04-17. Completion date: 2001-06-18.
$33,600, same as above.Signed on 2001-01-31. Completion date: 2001-06-29.
BASTIAN MATERIAL HANDLING LLC (9820 ASSOCIATION CT in INDIANAPOLIS, IN; small business)
$5,295 with Navy for Hardware, Commercial. Signed on 2005-09-23. Completion date: 2005-11-01.
Top industries in this zip code by the number of employees in 2005:
Professional, Scientific, and Technical Services: Administrative Management and General Management Consulting Services (500-999 employees: 1 establishment, 5-9 employees: 1 establishment, 1-4 employees: 3 establishments)
Real Estate and Rental and Leasing: Passenger Car Rental (500-999: 1, 1-4: 2)
Management of Companies and Enterprises: Corporate, Subsidiary, and Regional Managing Offices (250-499: 1, 5-9: 1)
Health Care and Social Assistance: Home Health Care Services (100-249: 2)
Construction: Commercial and Institutional Building Construction (100-249: 1, 50-99: 1, 1-4: 2)
Administrative and Support and Waste Management and Remediation Services: Office Administrative Services (100-249: 1, 20-49: 1, 5-9: 1, 1-4: 2)
Health Care and Social Assistance: Residential Mental Retardation Facilities (100-249: 1, 10-19: 1)
Health Care and Social Assistance: Offices of Physicians (except Mental Health Specialists) (50-99: 1, 10-19: 3, 5-9: 1, 1-4: 5)
Finance and Insurance: Direct Life Insurance Carriers (50-99: 1, 20-49: 1, 1-4: 1)
People in group quarters in 2010:
94 people in residential schools for people with disabilities
8 people in group homes intended for adults
People in group quarters in 2000:
8 people in hospitals/wards and hospices for chronically ill
8 people in other hospitals or wards for chronically ill
Fatal accident statistics in 2014:
Fatal accident count: 1
Vehicles involved in fatal accidents: 1
Fatal accidents caused by drunken drivers: 0
Fatalities: 1
Persons involved in fatal accidents: 1
Pedestrians involved in fatal accidents: 0
Home Mortgage Disclosure Act Aggregated Statistics For Year 2009 (Based on 4 partial tracts)
A) FHA, FSA/RHS & VA Home Purchase Loans
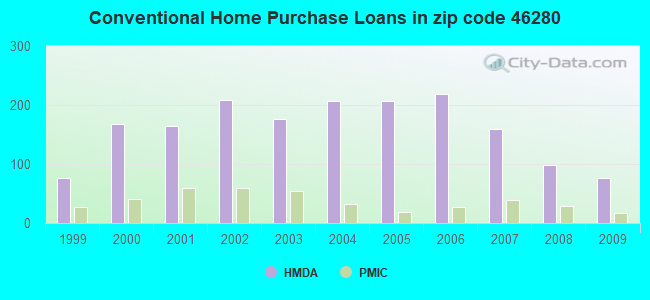
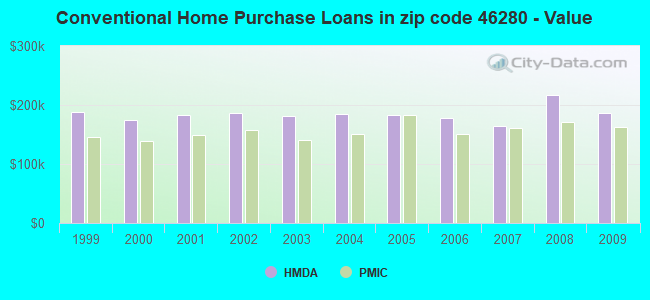
B) Conventional Home Purchase Loans
C) Refinancings
D) Home Improvement Loans
F) Non-occupant Loans on < 5 Family Dwellings (A B C & D)
Number
Average Value
Number
Average Value
Number
Average Value
Number
Average Value
Number
Average Value
LOANS ORIGINATED
44
$153,183
77
$186,419
322
$192,447
7
$48,061
14
$153,668
APPLICATIONS APPROVED, NOT ACCEPTED
2
$161,645
8
$281,675
22
$201,213
2
$7,755
1
$35,300
APPLICATIONS DENIED
6
$120,700
7
$129,311
85
$218,410
9
$92,848
8
$93,201
APPLICATIONS WITHDRAWN
9
$140,130
9
$245,168
50
$196,163
1
$68,250
4
$101,135
FILES CLOSED FOR INCOMPLETENESS
1
$67,080
2
$195,645
14
$281,679
1
$57,070
1
$138,270
Aggregated Statistics For Year 2008 (Based on 4 partial tracts)
A) FHA, FSA/RHS & VA Home Purchase Loans
B) Conventional Home Purchase Loans
C) Refinancings
D) Home Improvement Loans
F) Non-occupant Loans on < 5 Family Dwellings (A B C & D)
Number
Average Value
Number
Average Value
Number
Average Value
Number
Average Value
Number
Average Value
LOANS ORIGINATED
22
$144,599
99
$216,358
142
$188,191
19
$94,238
26
$122,902
APPLICATIONS APPROVED, NOT ACCEPTED
3
$163,433
7
$375,623
17
$182,956
3
$10,383
1
$129,450
APPLICATIONS DENIED
4
$135,340
13
$245,770
57
$171,872
16
$77,960
10
$109,669
APPLICATIONS WITHDRAWN
2
$151,095
6
$238,040
23
$217,457
3
$408,743
0
$0
FILES CLOSED FOR INCOMPLETENESS
0
$0
2
$265,215
9
$126,041
1
$252,510
1
$55,310
Aggregated Statistics For Year 2007 (Based on 4 partial tracts)
A) FHA, FSA/RHS & VA Home Purchase Loans
B) Conventional Home Purchase Loans
C) Refinancings
D) Home Improvement Loans
E) Loans on Dwellings For 5+ Families
F) Non-occupant Loans on < 5 Family Dwellings (A B C & D)
G) Loans On Manufactured Home Dwelling (A B C & D)
Number
Average Value
Number
Average Value
Number
Average Value
Number
Average Value
Number
Average Value
Number
Average Value
Number
Average Value
LOANS ORIGINATED
11
$143,807
160
$163,592
145
$193,368
22
$37,567
1
$84,350
28
$121,966
0
$0
APPLICATIONS APPROVED, NOT ACCEPTED
1
$139,390
18
$181,937
27
$196,690
5
$105,898
0
$0
2
$129,955
0
$0
APPLICATIONS DENIED
3
$125,720
26
$138,004
94
$186,589
17
$100,565
0
$0
13
$117,872
1
$23,540
APPLICATIONS WITHDRAWN
0
$0
21
$173,495
35
$224,621
4
$166,142
0
$0
4
$211,765
0
$0
FILES CLOSED FOR INCOMPLETENESS
1
$57,900
4
$188,910
11
$204,045
1
$1,068,600
0
$0
2
$237,715
0
$0
Aggregated Statistics For Year 2006 (Based on 4 partial tracts)
A) FHA, FSA/RHS & VA Home Purchase Loans
B) Conventional Home Purchase Loans
C) Refinancings
D) Home Improvement Loans
F) Non-occupant Loans on < 5 Family Dwellings (A B C & D)
Number
Average Value
Number
Average Value
Number
Average Value
Number
Average Value
Number
Average Value
LOANS ORIGINATED
10
$145,477
218
$177,129
150
$186,961
33
$71,979
39
$111,796
APPLICATIONS APPROVED, NOT ACCEPTED
0
$0
29
$202,336
24
$148,950
5
$20,504
3
$116,413
APPLICATIONS DENIED
4
$140,842
34
$174,780
102
$176,396
12
$50,438
11
$110,512
APPLICATIONS WITHDRAWN
2
$173,320
28
$180,955
50
$208,223
5
$40,720
11
$104,293
FILES CLOSED FOR INCOMPLETENESS
2
$158,975
4
$142,958
21
$216,260
1
$116,510
1
$133,090
Aggregated Statistics For Year 2005 (Based on 4 partial tracts)
A) FHA, FSA/RHS & VA Home Purchase Loans
B) Conventional Home Purchase Loans
C) Refinancings
D) Home Improvement Loans
F) Non-occupant Loans on < 5 Family Dwellings (A B C & D)
G) Loans On Manufactured Home Dwelling (A B C & D)
Number
Average Value
Number
Average Value
Number
Average Value
Number
Average Value
Number
Average Value
Number
Average Value
LOANS ORIGINATED
15
$149,924
207
$183,463
229
$192,372
26
$85,424
38
$117,311
1
$8,830
APPLICATIONS APPROVED, NOT ACCEPTED
2
$117,385
19
$255,542
28
$134,626
4
$28,182
7
$117,310
0
$0
APPLICATIONS DENIED
2
$113,660
32
$159,632
105
$173,773
17
$50,675
11
$116,805
0
$0
APPLICATIONS WITHDRAWN
1
$145,920
23
$133,453
54
$207,702
9
$123,873
9
$147,308
1
$167,980
FILES CLOSED FOR INCOMPLETENESS
0
$0
4
$164,605
34
$190,065
1
$8,830
2
$153,635
0
$0
Aggregated Statistics For Year 2004 (Based on 4 partial tracts)
A) FHA, FSA/RHS & VA Home Purchase Loans
B) Conventional Home Purchase Loans
C) Refinancings
D) Home Improvement Loans
F) Non-occupant Loans on < 5 Family Dwellings (A B C & D)
G) Loans On Manufactured Home Dwelling (A B C & D)
Number
Average Value
Number
Average Value
Number
Average Value
Number
Average Value
Number
Average Value
Number
Average Value
LOANS ORIGINATED
14
$114,683
207
$184,735
290
$179,651
22
$59,790
32
$114,214
0
$0
APPLICATIONS APPROVED, NOT ACCEPTED
1
$75,050
20
$189,924
43
$196,806
3
$49,520
6
$143,028
1
$12,870
APPLICATIONS DENIED
2
$115,915
30
$147,828
96
$143,873
18
$51,833
9
$166,944
1
$22,360
APPLICATIONS WITHDRAWN
2
$120,850
14
$128,623
61
$153,645
4
$81,605
2
$67,770
0
$0
FILES CLOSED FOR INCOMPLETENESS
1
$159,460
6
$116,327
32
$163,932
1
$13,030
1
$108,270
0
$0
Aggregated Statistics For Year 2003 (Based on 4 partial tracts)
A) FHA, FSA/RHS & VA Home Purchase Loans
B) Conventional Home Purchase Loans
C) Refinancings
D) Home Improvement Loans
F) Non-occupant Loans on < 5 Family Dwellings (A B C & D)
Number
Average Value
Number
Average Value
Number
Average Value
Number
Average Value
Number
Average Value
LOANS ORIGINATED
26
$126,008
177
$181,623
744
$182,468
14
$51,031
53
$113,012
APPLICATIONS APPROVED, NOT ACCEPTED
7
$108,884
18
$197,904
71
$171,862
4
$14,335
6
$72,330
APPLICATIONS DENIED
4
$106,930
11
$307,155
111
$158,643
12
$28,829
9
$92,874
APPLICATIONS WITHDRAWN
3
$108,327
10
$235,921
86
$157,011
1
$12,150
3
$106,153
FILES CLOSED FOR INCOMPLETENESS
0
$0
6
$339,795
19
$230,606
1
$32,580
1
$67,080
Aggregated Statistics For Year 2002 (Based on 4 partial tracts)
A) FHA, FSA/RHS & VA Home Purchase Loans
B) Conventional Home Purchase Loans
C) Refinancings
D) Home Improvement Loans
F) Non-occupant Loans on < 5 Family Dwellings (A B C & D)
Number
Average Value
Number
Average Value
Number
Average Value
Number
Average Value
Number
Average Value
LOANS ORIGINATED
46
$132,422
209
$185,605
565
$183,773
10
$26,886
39
$123,378
APPLICATIONS APPROVED, NOT ACCEPTED
4
$109,590
17
$138,911
60
$142,995
4
$21,900
3
$86,887
APPLICATIONS DENIED
3
$139,313
16
$198,222
91
$107,862
7
$13,960
4
$110,052
APPLICATIONS WITHDRAWN
1
$164,710
13
$185,534
49
$162,883
0
$0
2
$130,100
FILES CLOSED FOR INCOMPLETENESS
2
$85,025
7
$148,941
31
$137,328
1
$17,870
2
$100,175
Aggregated Statistics For Year 2001 (Based on 4 partial tracts)
A) FHA, FSA/RHS & VA Home Purchase Loans
B) Conventional Home Purchase Loans
C) Refinancings
D) Home Improvement Loans
F) Non-occupant Loans on < 5 Family Dwellings (A B C & D)
Number
Average Value
Number
Average Value
Number
Average Value
Number
Average Value
Number
Average Value
LOANS ORIGINATED
48
$119,866
165
$182,602
382
$152,356
30
$39,439
25
$142,436
APPLICATIONS APPROVED, NOT ACCEPTED
2
$178,900
10
$172,738
39
$121,240
9
$26,797
3
$113,180
APPLICATIONS DENIED
3
$101,173
9
$213,932
66
$128,536
13
$18,795
6
$82,768
APPLICATIONS WITHDRAWN
1
$109,140
5
$249,834
40
$137,910
3
$17,180
3
$73,943
FILES CLOSED FOR INCOMPLETENESS
1
$146,260
4
$156,922
20
$138,726
2
$27,220
1
$94,360
Aggregated Statistics For Year 2000 (Based on 4 partial tracts)
A) FHA, FSA/RHS & VA Home Purchase Loans
B) Conventional Home Purchase Loans
C) Refinancings
D) Home Improvement Loans
F) Non-occupant Loans on < 5 Family Dwellings (A B C & D)
Number
Average Value
Number
Average Value
Number
Average Value
Number
Average Value
Number
Average Value
LOANS ORIGINATED
19
$120,228
167
$174,410
83
$122,115
31
$28,941
11
$137,078
APPLICATIONS APPROVED, NOT ACCEPTED
4
$110,778
13
$135,254
24
$96,432
15
$21,263
1
$213,650
APPLICATIONS DENIED
1
$111,780
12
$117,163
46
$96,214
24
$19,662
6
$123,862
APPLICATIONS WITHDRAWN
0
$0
10
$207,913
16
$106,249
3
$53,697
2
$102,035
FILES CLOSED FOR INCOMPLETENESS
1
$54,720
4
$68,608
8
$189,265
0
$0
1
$51,780
Aggregated Statistics For Year 1999 (Based on 2 partial tracts)
A) FHA, FSA/RHS & VA Home Purchase Loans
B) Conventional Home Purchase Loans
C) Refinancings
D) Home Improvement Loans
F) Non-occupant Loans on < 5 Family Dwellings (A B C & D)
Detailed PMIC statistics for the following Tracts:1110.06
, 1111.02
2003 - 2018 National Fire Incident Reporting System (NFIRS) incidents
According to the data from the years 2003 - 2018 the average number of fire incidents per year is 11. The highest number of fire incidents - 23 took place in 2007, and the least - 0 in 2015. The data has a decreasing trend.
When looking into fire subcategories, the most reports belonged to: Outside Fires (43.6%), and Structure Fires (36.6%).
Fire incident types reported to NFIRS in Zip Code 46280
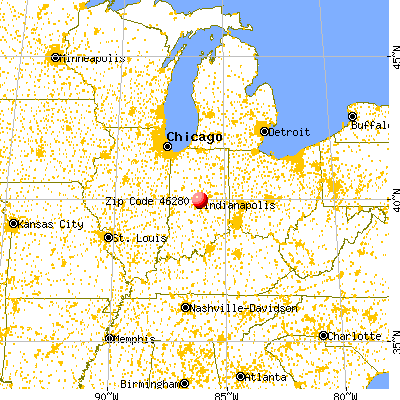


 Nearest zip codes: 46240, 46290, 46032, 46260, 46033, 46220.
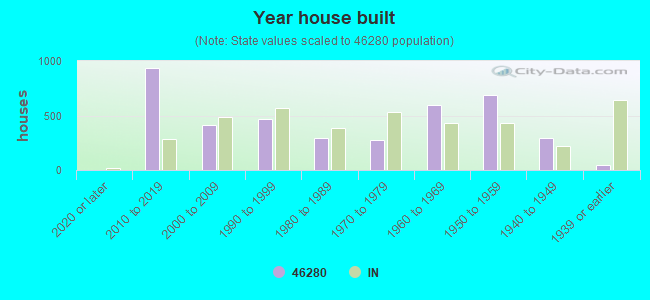


 According to the data from the years 2003 - 2018 the average number of fire incidents per year is 11. The highest number of fire incidents - 23 took place in 2007, and the least - 0 in 2015. The data has a decreasing trend.
 When looking into fire subcategories, the most reports belonged to: Outside Fires (43.6%), and Structure Fires (36.6%).