Maple Hill neighborhood in Overland Park, Kansas (KS), 66212, 66214 detailed profile
Settings
X

Business Search - 14 Million verified businesses
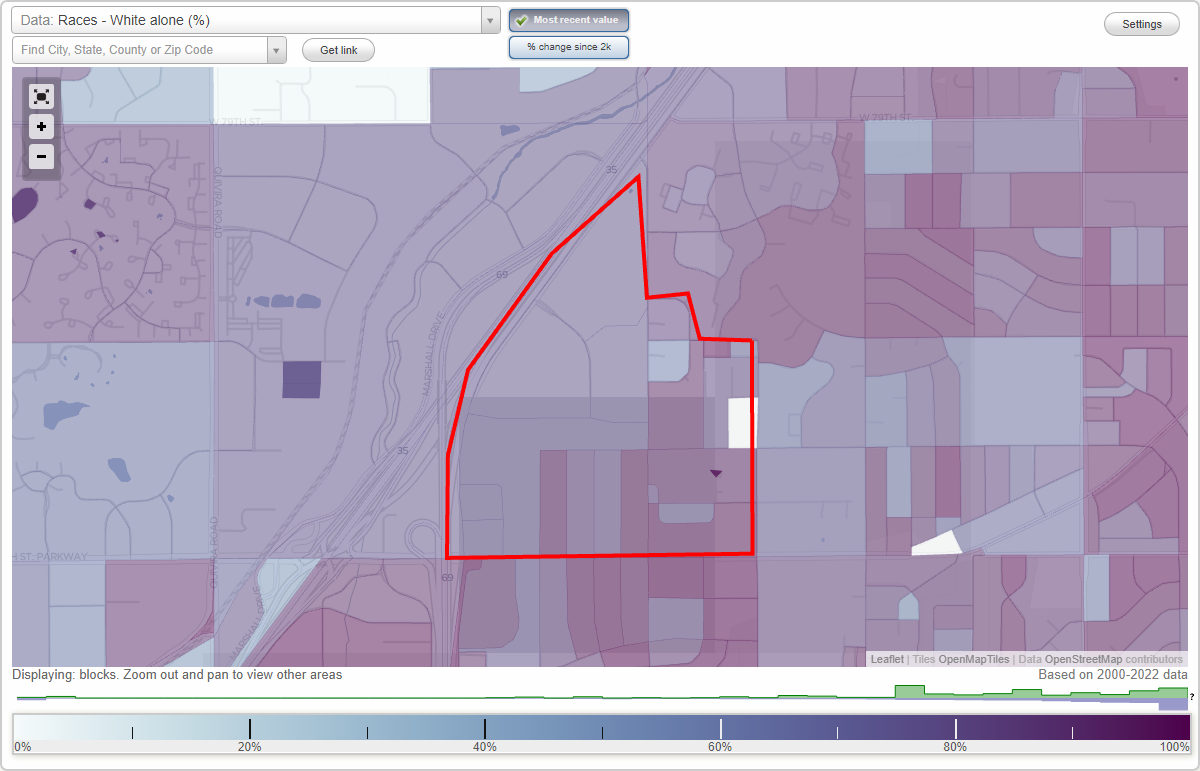
Area: 0.428 square miles
Population: 2,808
Population density:
| Maple Hill: | 6,567 people per square mile |
| Overland Park: | 3,485 people per square mile |

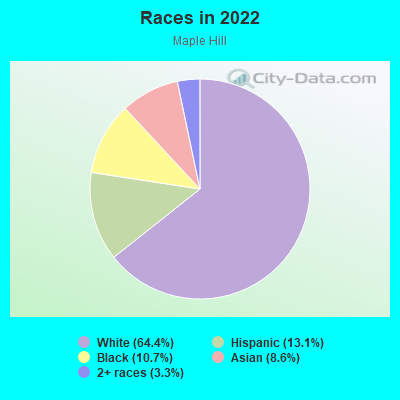
- 1,80864.4%White
- 36713.1%Hispanic or Latino
- 29910.7%Black
- 2408.6%Asian
- 933.3%Two or more races
Median household income in 2022:
| Maple Hill: | $59,464 |
| Overland Park: | $96,694 |
Distribution of median household income
![Distribution of median household income]()
- 57Less than $10,000
- 258$10,000 to $19,999
- 76$20,000 to $29,999
- 91$30,000 to $39,999
- 182$40,000 to $49,999
- 54$50,000 to $59,999
- 74$60,000 to $74,999
- 251$75,000 to $99,999
- 194$100,000 to $124,999
- 35$125,000 to $149,999
- 74$150,000 to $199,999
- 76$200,000 or more

Distribution of owner-occupied house/condo value
![Distribution of owner-occupied house/condo value]()
- 69$50,000 to $99,999
- 27$100,000 to $149,999
- 150$150,000 to $199,999
- 148$200,000 to $249,999
- 19$250,000 to $299,999
- 79$300,000 to $399,999

Distribution of rent paid by renters
![Distribution of rent paid by renters]()
- 20Less than $100
- 123$100 to $199
- 84$200 to $299
- 62$300 to $399
- 73$400 to $499
- 99$500 to $599
- 54$600 to $699
- 8$700 to $799
- 19$800 to $899
- 54$900 to $999
- 219$1,000 to $1,249
- 84$1,250 to $1,499
- 86$1,500 to $1,999

Median rent in 2022:
| Maple Hill: | $620 |
| Overland Park: | $1,194 |
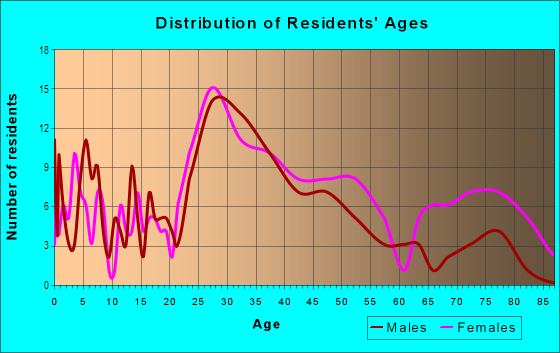
| Males: | 1,419 |
| Females: | 1,389 |
Males:
| This neighborhood: | 33.0 years |
| Whole city: | 37.7 years |
| This neighborhood: | 45.8 years |
| Whole city: | 38.8 years |
Average household size:
| Maple Hill: | 2.0 people |
| Overland Park: | 2.3 people |
Percentage of family households:
| Maple Hill: | 45.3% |
| Overland Park: | 42.1% |
| Here: | 23.7% |
| Overland Park: | 48.0% |
Percentage of married-couple families with children (among all households):
| Maple Hill: | 19.3% |
| Overland Park: | 37.4% |
Percentage of single-mother households (among all households):
| Maple Hill: | 14.1% |
| Overland Park: | 4.2% |
Percentage of never married males 15 years old and over:
Percentage of never married females 15 years old and over:
| Maple Hill: | 21.0% |
| Overland Park: | 17.2% |
Percentage of never married females 15 years old and over:
| Maple Hill: | 13.2% |
| city: | 15.1% |
Percentage of people that speak English not well or not at all:
| Maple Hill: | 0.5% |
| Overland Park: | 1.4% |
Percentage of people born in this state:
Percentage of people born in another U.S. state:
Percentage of native residents but born outside the U.S.:
Percentage of foreign born residents:
| Here: | 43.9% |
| Overland Park: | 37.4% |
Percentage of people born in another U.S. state:
| Maple Hill: | 40.3% |
| Overland Park: | 50.4% |
Percentage of native residents but born outside the U.S.:
| Here: | 1.3% |
| city: | 0.9% |
Percentage of foreign born residents:
| Here: | 14.5% |
| Overland Park: | 11.3% |
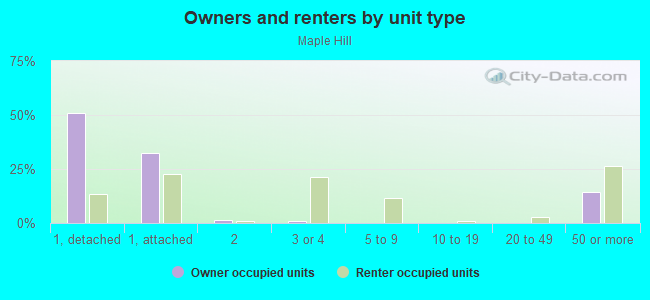
Owner-occupied
Renter-occupied

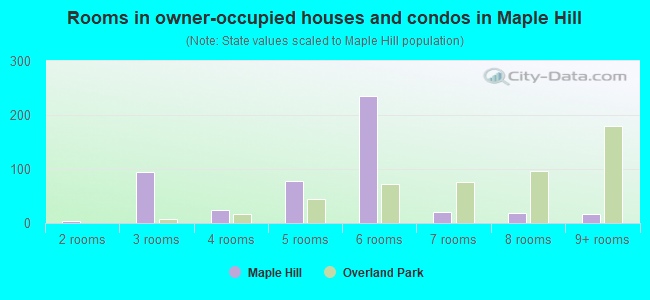
- Rooms in owner-occupied houses and condos in Maple Hill
- 01 room
- 42 rooms
- 953 rooms
- 244 rooms
- 785 rooms
- 2356 rooms
- 217 rooms
- 198 rooms
- 179+ rooms
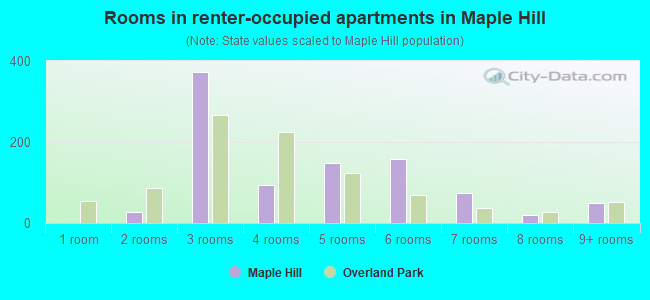
- Rooms in renter-occupied apartments in Maple Hill
- 01 room
- 262 rooms
- 3723 rooms
- 934 rooms
- 1495 rooms
- 1596 rooms
- 757 rooms
- 198 rooms
- 499+ rooms
Owner-occupied
Renter-occupied
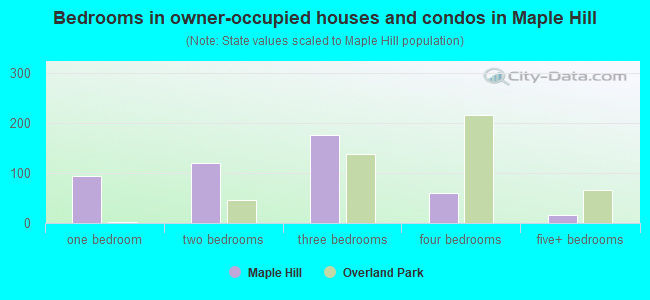
- Bedrooms in owner-occupied houses and condos in Maple Hill
- 0no bedroom
- 951 bedroom
- 1202 bedrooms
- 1763 bedrooms
- 614 bedrooms
- 175+ bedrooms
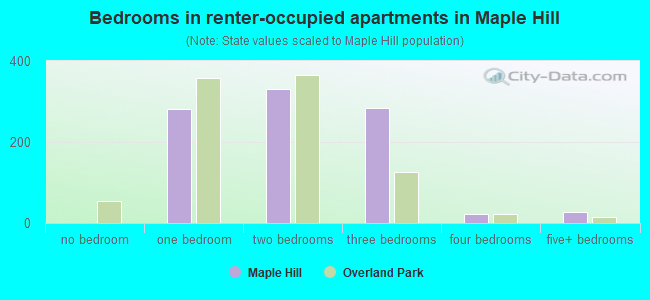
- Bedrooms in renter-occupied apartments in Maple Hill
- 0no bedroom
- 2811 bedroom
- 3302 bedrooms
- 2843 bedrooms
- 224 bedrooms
- 265+ bedrooms
Average number of cars or other vehicles available in houses/condos:
Average number of cars or other vehicles available in apartments:
| This neighborhood: | 2.1 |
| Overland Park: | 2.0 |
Average number of cars or other vehicles available in apartments:
| Here: | 1.3 |
| city: | 1.3 |
Percentage of units with a mortgage:
| Maple Hill: | 69.3% |
| Overland Park: | 67.7% |
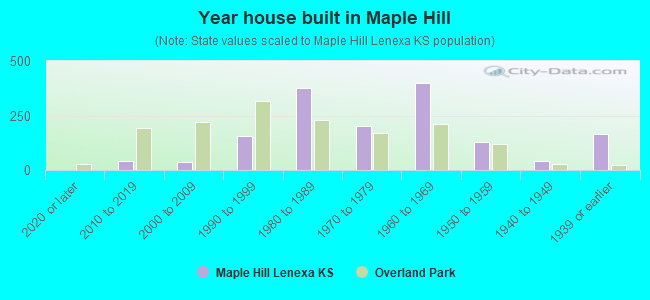
- Year house built in Maple Hill
- 02020 or later
- 412010 to 2019
- 362000 to 2009
- 1541990 to 1999
- 3771980 to 1989
- 2031970 to 1979
- 3991960 to 1969
- 1281950 to 1959
- 391940 to 1949
- 1641939 or earlier
City-data.com crime index for city in 2020 (higher means more crime):
| City: | 154.8 |
| U.S. average: | 219.5 |
Travel time to work (commute)
![Travel time to work (commute)]()
- 59Less than 5 minutes
- 435 to 9 minutes
- 23110 to 14 minutes
- 34115 to 19 minutes
- 29720 to 24 minutes
- 7125 to 29 minutes
- 9930 to 34 minutes
- 2240 to 44 minutes
- 2945 to 59 minutes
- 2990 or more minutes

Means of transportation to work
![Means of transportation to work]()
- 79.3%1,044Drove a car alone
- 1.8%24Carpooled
- 14.9%196Walked
- 0.9%12Other means
- 3.0%39Worked at home

Time leaving home to go to work
![Time leaving home to go to work]()
- 2112:00 a.m. to 4:59 a.m.
- 405:30 a.m. to 5:59 a.m.
- 1246:00 a.m. to 6:29 a.m.
- 1106:30 a.m. to 6:59 a.m.
- 2167:00 a.m. to 7:29 a.m.
- 2517:30 a.m. to 7:59 a.m.
- 1888:00 a.m. to 8:29 a.m.
- 48:30 a.m. to 8:59 a.m.
- 159:00 a.m. to 9:59 a.m.
- 4610:00 a.m. to 10:59 a.m.
- 1311:00 a.m. to 11:59 a.m.
- 7912:00 p.m. to 3:59 p.m.
- 1114:00 p.m. to 11:59 p.m.

Occupations of males:
- Percentage of males in management occupations (except farmers):
Here: 1.1% city: 17.2%
- Percentage of males in computer and mathematical occupations:
Here: 16.2% city: 11.2%
- Percentage of males in architecture and engineering occupations:
Here: 11.2% city: 5.0%
- Percentage of males in healthcare practitioners and technical occupations:
Here: 14.1% city: 4.1%
- Percentage of males in service occupations:
Here: 5.1% city: 9.7%
- Percentage of males in sales and office occupations:
Here: 19.6% city: 19.9%
- Percentage of males in construction, extraction, and maintenance occupations:
Here: 5.8% city: 2.8%
- Percentage of males in production occupations:
Here: 11.2% city: 2.3%
- Percentage of males in transportation occupations:
Here: 2.5% city: 3.0%
- Percentage of males in material moving occupations:
Here: 21.3% city: 2.7%
Occupations of females:
- Percentage of females in management occupations (except farmers):
Here: 18.1% city: 10.8%
- Percentage of females in business and financial operations occupations:
Here: 2.7% city: 10.2%
- Percentage of females in computer and mathematical occupations:
Here: 1.2% city: 4.6%
- Percentage of females in life, physical, and social science occupations:
Here: 3.5% city: 1.2%
- Percentage of females in community and social services occupations:
Here: 8.1% city: 2.4%
- Percentage of females in legal occupations:
Here: 3.2% city: 1.6%
- Percentage of females in education, training, and library occupations:
Here: 1.1% city: 10.8%
- Percentage of females in arts, design, entertainment, sports, and media occupations:
Here: 3.0% city: 2.8%
- Percentage of females in healthcare practitioners and technical occupations:
Here: 3.1% city: 12.1%
- Percentage of females in service occupations:
Here: 40.8% city: 13.8%
- Percentage of females in sales and office occupations:
Here: 18.5% city: 25.2%
- Percentage of females in production occupations:
Here: 5.4% city: 2.0%
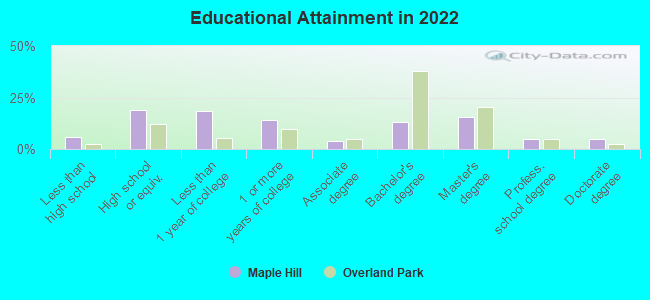
Education in this neighborhood (subdivision or community):
- Percentage of people 3 years and older in K-12 schools:
Maple Hill: 19.7% Overland Park: 15.4%
- Percentage of people 3 years and older in undergraduate colleges:
Maple Hill: 7.5% Overland Park: 3.4%
- Percentage of people 3 years and older in grad. or professional schools:
Maple Hill: 0.8% Overland Park: 2.3%
- Percentage of students K-12 enrolled in private schools:
Maple Hill: 8.8% Overland Park: 14.1%
Percentage of population below poverty level:
| Maple Hill: | 8.6% |
| Overland Park: | 5.0% |
Median year owner moved in (as recorded in 2022):
Median year renter moved in (as recorded in 2022):
| Maple Hill: | 2013 |
| Overland Park: | 2013 |
Median year renter moved in (as recorded in 2022):
| Maple Hill: | 2015 |
| Overland Park: | 2021 |
Percentage of married-couple families with both working:
| Maple Hill: | 67.3% |
| Overland Park: | 75.4% |
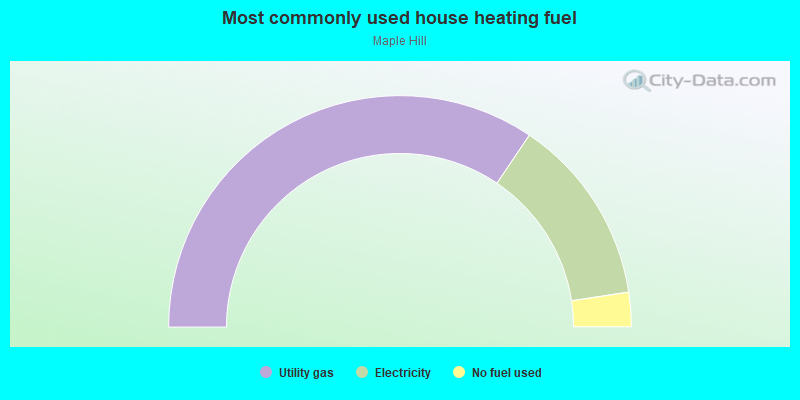
- 68.9%Utility gas
- 26.3%Electricity
- 4.8%No fuel used
Roads and streets:
Lenexa Dr
Length: 0.67 miles
Directions: N-S, SW-NE
Address range: 8300 to 8699
Directions: N-S, SW-NE
Address range: 8300 to 8699
Melrose Dr
Length: 0.62 miles
Directions: E-W, N-S, SE-NW, SW-NE
Address range: 8200 to 8499
Directions: E-W, N-S, SE-NW, SW-NE
Address range: 8200 to 8499
W 85th St
Length: 0.60 miles
Directions: E-W, N-S, SW-NE
Address range: 9913 to 10599
Directions: E-W, N-S, SW-NE
Address range: 9913 to 10599
Switzer Rd (Switzer St)
Length: 0.56 miles
Directions: E-W, N-S
Address range: 8236 to 8599
Directions: E-W, N-S
Address range: 8236 to 8599
W 84th Ter
Length: 0.53 miles
Direction: E-W
Address range: 10300 to 10999
Direction: E-W
Address range: 10300 to 10999
Wedd St
Length: 0.37 miles
Directions: E-W, N-S, SE-NW, SW-NE
Address range: 8300 to 8580
Directions: E-W, N-S, SE-NW, SW-NE
Address range: 8300 to 8580
W 86th St
Length: 0.33 miles
Directions: E-W, SE-NW
Address range: 10072 to 10999
Directions: E-W, SE-NW
Address range: 10072 to 10999
W 86th Ter
Length: 0.31 miles
Directions: E-W, N-S, SE-NW, SW-NE
Address range: 10001 to 10241
Directions: E-W, N-S, SE-NW, SW-NE
Address range: 10001 to 10241
Perry St
Length: 0.28 miles
Directions: E-W, N-S, SE-NW, SW-NE
Address range: 8500 to 10298
Directions: E-W, N-S, SE-NW, SW-NE
Address range: 8500 to 10298
Mastin St
Length: 0.24 miles
Direction: N-S
Address range: 8300 to 8499
Direction: N-S
Address range: 8300 to 8499
W 84th St
Length: 0.21 miles
Directions: E-W, N-S, SE-NW, SW-NE
Address range: 10125 to 10199
Directions: E-W, N-S, SE-NW, SW-NE
Address range: 10125 to 10199
Bluejacket St
Length: 0.16 miles
Directions: N-S, SE-NW
Address range: 8500 to 8699
Directions: N-S, SE-NW
Address range: 8500 to 8699
W 83rd St
Length: 0.16 miles
Direction: E-W
Address range: 10088 to 10299
Direction: E-W
Address range: 10088 to 10299
W 83rd Ter
Length: 0.08 miles
Direction: E-W
Address range: 10005 to 10099
Direction: E-W
Address range: 10005 to 10099
86th St
Length: 0.08 miles
Direction: N-S
Direction: N-S
W 87th Street Pkwy (W 87th St)
Length: 0.05 miles
Direction: E-W
Address range: 10900 to 10999
Direction: E-W
Address range: 10900 to 10999