Mid-Broadway District neighborhood in Chula Vista, California (CA), 91910, 91911 detailed profile
Settings
X


Business Search - 14 Million verified businesses
Area: 0.456 square miles
Population: 5,010
Population density:
| Mid-Broadway District: | 10,980 people per square mile |
| Chula Vista: | 5,711 people per square mile |

- 4,21582.1%Hispanic or Latino
- 60211.7%White
- 1352.6%Black
- 671.3%Asian
- 480.9%Two or more races
- 400.8%American Indian
- 240.5%Native Hawaiian and Other
Pacific Islander

Median household income in 2022:
| Mid-Broadway District: | $70,717 |
| Chula Vista: | $101,190 |
Distribution of median household income
![Distribution of median household income]()
- 203Less than $10,000
- 175$10,000 to $19,999
- 191$20,000 to $29,999
- 336$30,000 to $39,999
- 212$40,000 to $49,999
- 119$50,000 to $59,999
- 152$60,000 to $74,999
- 385$75,000 to $99,999
- 122$100,000 to $124,999
- 184$125,000 to $149,999
- 121$150,000 to $199,999
- 144$200,000 or more

Distribution of owner-occupied house/condo value
![Distribution of owner-occupied house/condo value]()
- 81Less than $50,000
- 57$50,000 to $99,999
- 103$150,000 to $199,999
- 43$250,000 to $299,999
- 135$300,000 to $399,999
- 188$400,000 to $499,999
- 383$500,000 to $749,999
- 181$750,000 to $999,999
- 27$1,000,000 or more

Distribution of rent paid by renters
![Distribution of rent paid by renters]()
- 75$200 to $299
- 129$300 to $399
- 7$500 to $599
- 13$600 to $699
- 212$800 to $899
- 181$1,000 to $1,249
- 224$1,250 to $1,499
- 384$1,500 to $1,999
- 444$2,000 or more

Median rent in 2022:
| Mid-Broadway District: | $1,587 |
| Chula Vista: | $1,879 |
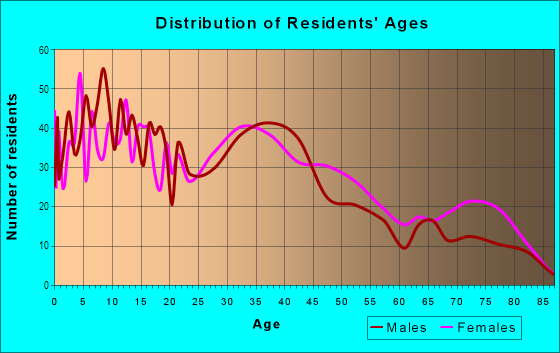
| Males: | 2,508 |
| Females: | 2,501 |
Males:
| This neighborhood: | 35.0 years |
| Whole city: | 34.8 years |
| This neighborhood: | 40.3 years |
| Whole city: | 37.4 years |
Average household size:
| Mid-Broadway District: | 3.1 people |
| Chula Vista: | 3.2 people |
Percentage of family households:
| Mid-Broadway District: | 60.2% |
| Chula Vista: | 57.2% |
| Here: | 51.4% |
| Chula Vista: | 54.5% |
Percentage of married-couple families with children (among all households):
| Mid-Broadway District: | 18.0% |
| Chula Vista: | 22.9% |
Percentage of single-mother households (among all households):
| Mid-Broadway District: | 17.0% |
| Chula Vista: | 5.5% |
Percentage of never married males 15 years old and over:
Percentage of never married females 15 years old and over:
| Mid-Broadway District: | 21.4% |
| Chula Vista: | 19.8% |
Percentage of never married females 15 years old and over:
| Mid-Broadway District: | 14.3% |
| city: | 16.5% |
Percentage of people that speak English not well or not at all:
| Mid-Broadway District: | 8.4% |
| Chula Vista: | 8.7% |
Percentage of people born in this state:
Percentage of people born in another U.S. state:
Percentage of native residents but born outside the U.S.:
Percentage of foreign born residents:
| Here: | 54.9% |
| Chula Vista: | 56.5% |
Percentage of people born in another U.S. state:
| Mid-Broadway District: | 11.4% |
| Chula Vista: | 13.1% |
Percentage of native residents but born outside the U.S.:
| Here: | 1.2% |
| city: | 2.8% |
Percentage of foreign born residents:
| Here: | 32.6% |
| Chula Vista: | 27.6% |

Owner-occupied
Renter-occupied


- Rooms in owner-occupied houses and condos in Mid-Broadway District
- 551 room
- 32 rooms
- 303 rooms
- 1644 rooms
- 2695 rooms
- 1836 rooms
- 797 rooms
- 758 rooms
- 1089+ rooms

- Rooms in renter-occupied apartments in Mid-Broadway District
- 161 room
- 662 rooms
- 4453 rooms
- 2704 rooms
- 1605 rooms
- 1206 rooms
- 07 rooms
- 258 rooms
- 09+ rooms
Owner-occupied
Renter-occupied

- Bedrooms in owner-occupied houses and condos in Mid-Broadway District
- 55no bedroom
- 281 bedroom
- 1772 bedrooms
- 4703 bedrooms
- 1234 bedrooms
- 575+ bedrooms

- Bedrooms in renter-occupied apartments in Mid-Broadway District
- 16no bedroom
- 1431 bedroom
- 4632 bedrooms
- 2943 bedrooms
- 1134 bedrooms
- 05+ bedrooms
Average number of cars or other vehicles available in houses/condos:
Average number of cars or other vehicles available in apartments:
| This neighborhood: | 2.1 |
| Chula Vista: | 2.4 |
Average number of cars or other vehicles available in apartments:
| Here: | 2.1 |
| city: | 1.7 |
Percentage of units with a mortgage:
| Mid-Broadway District: | 68.5% |
| Chula Vista: | 76.0% |
Average estimated value of detached houses in 2022 (57.1% of all units):
| Mid-Broadway District: | $568,108 |
| California: | $988,808 |

- Year house built in Mid-Broadway District
- 02020 or later
- 1112010 to 2019
- 1142000 to 2009
- 1321990 to 1999
- 241980 to 1989
- 961970 to 1979
- 3011960 to 1969
- 1,0171950 to 1959
- 2271940 to 1949
- 361939 or earlier

City-data.com crime index for city in 2020 (higher means more crime):
| City: | 159.8 |
| U.S. average: | 219.5 |
Travel time to work (commute)
![Travel time to work (commute)]()
- 965 to 9 minutes
- 31010 to 14 minutes
- 25115 to 19 minutes
- 20220 to 24 minutes
- 17225 to 29 minutes
- 23130 to 34 minutes
- 4135 to 39 minutes
- 3740 to 44 minutes
- 42445 to 59 minutes
- 10060 to 89 minutes
- 3290 or more minutes

Means of transportation to work
![Means of transportation to work]()
- 77.0%1,824Drove a car alone
- 7.3%172Carpooled
- 1.6%37Bus
- 4.4%104Subway or elevated rail
- 5.3%126Light rail, streetcar or trolley
- 0.0%1Taxi
- 6.1%145Bicycle
- 4.1%98Walked
- 1.1%27Other means
- 10.7%254Worked at home

Time leaving home to go to work
![Time leaving home to go to work]()
- 19512:00 a.m. to 4:59 a.m.
- 565:00 a.m. to 5:29 a.m.
- 1045:30 a.m. to 5:59 a.m.
- 1956:00 a.m. to 6:29 a.m.
- 1546:30 a.m. to 6:59 a.m.
- 2177:00 a.m. to 7:29 a.m.
- 1347:30 a.m. to 7:59 a.m.
- 1538:00 a.m. to 8:29 a.m.
- 958:30 a.m. to 8:59 a.m.
- 1459:00 a.m. to 9:59 a.m.
- 4510:00 a.m. to 10:59 a.m.
- 1911:00 a.m. to 11:59 a.m.
- 7412:00 p.m. to 3:59 p.m.
- 664:00 p.m. to 11:59 p.m.

Occupations of males:
- Percentage of males in management occupations (except farmers):
Here: 6.9% city: 9.9%
- Percentage of males in computer and mathematical occupations:
Here: 1.7% city: 4.9%
- Percentage of males in architecture and engineering occupations:
Here: 3.0% city: 4.8%
- Percentage of males in legal occupations:
Here: 1.9% city: 1.0%
- Percentage of males in service occupations:
Here: 19.2% city: 18.4%
- Percentage of males in sales and office occupations:
Here: 24.0% city: 16.0%
- Percentage of males in construction, extraction, and maintenance occupations:
Here: 18.9% city: 9.2%
- Percentage of males in production occupations:
Here: 3.5% city: 5.7%
- Percentage of males in transportation occupations:
Here: 5.9% city: 5.1%
- Percentage of males in material moving occupations:
Here: 7.6% city: 3.7%
Occupations of females:
- Percentage of females in management occupations (except farmers):
Here: 1.9% city: 8.6%
- Percentage of females in business and financial operations occupations:
Here: 3.0% city: 5.6%
- Percentage of females in computer and mathematical occupations:
Here: 1.1% city: 1.2%
- Percentage of females in community and social services occupations:
Here: 7.7% city: 3.1%
- Percentage of females in education, training, and library occupations:
Here: 4.4% city: 7.6%
- Percentage of females in healthcare practitioners and technical occupations:
Here: 9.9% city: 10.6%
- Percentage of females in service occupations:
Here: 28.5% city: 22.6%
- Percentage of females in sales and office occupations:
Here: 35.7% city: 29.5%
- Percentage of females in transportation occupations:
Here: 3.3% city: 1.1%
- Percentage of females in material moving occupations:
Here: 3.2% city: 1.7%
Percentage of people 16-64 in Armed Forces:
| Mid-Broadway District: | 0.7% |
| Chula Vista: | 4.1% |
Education in this neighborhood (subdivision or community):
- Percentage of people 3 years and older in K-12 schools:
Mid-Broadway District: 23.5% Chula Vista: 22.0%
- Percentage of people 3 years and older in undergraduate colleges:
Mid-Broadway District: 7.5% Chula Vista: 7.6%
- Percentage of people 3 years and older in grad. or professional schools:
Mid-Broadway District: 1.5% Chula Vista: 1.2%
- Percentage of students K-12 enrolled in private schools:
Mid-Broadway District: 7.8% Chula Vista: 7.0%
Percentage of population below poverty level:
| Mid-Broadway District: | 12.5% |
| Chula Vista: | 10.1% |
Median year owner moved in (as recorded in 2022):
Median year renter moved in (as recorded in 2022):
| Mid-Broadway District: | 2003 |
| Chula Vista: | 2011 |
Median year renter moved in (as recorded in 2022):
| Mid-Broadway District: | 2014 |
| Chula Vista: | 2018 |
Percentage of married-couple families with both working:
| Mid-Broadway District: | 98.8% |
| Chula Vista: | 69.2% |

- 62.7%Utility gas
- 19.7%Electricity
- 7.3%No fuel used
- 6.0%Bottled, tank, or LP gas
- 3.1%Solar energy
- 1.2%Wood
Roads and streets:
K St
Length: 0.67 miles
Direction: E-W
Address range: 500 to 731
Direction: E-W
Address range: 500 to 731
J St
Length: 0.67 miles
Directions: E-W, SW-NE
Address range: 500 to 731
Directions: E-W, SW-NE
Address range: 500 to 731
5th Ave
Length: 0.63 miles
Direction: N-S
Address range: 649 to 899
Direction: N-S
Address range: 649 to 899
Sierra Way
Length: 0.58 miles
Directions: E-W, SE-NW, SW-NE
Address range: 500 to 731
Directions: E-W, SE-NW, SW-NE
Address range: 500 to 731
Broadway
Length: 0.51 miles
Direction: N-S
Address range: 650 to 849
Direction: N-S
Address range: 650 to 849
Woodlawn Ave
Length: 0.51 miles
Directions: N-S, SE-NW
Address range: 650 to 849
Directions: N-S, SE-NW
Address range: 650 to 849
Colorado Ave
Length: 0.51 miles
Directions: N-S, SE-NW
Address range: 701 to 848
Directions: N-S, SE-NW
Address range: 701 to 848
Jefferson Ave
Length: 0.38 miles
Directions: N-S, SE-NW
Address range: 700 to 849
Directions: N-S, SE-NW
Address range: 700 to 849
Oaklawn Ave
Length: 0.38 miles
Direction: N-S
Address range: 700 to 849
Direction: N-S
Address range: 700 to 849
Madison Ave
Length: 0.38 miles
Direction: N-S
Address range: 700 to 851
Direction: N-S
Address range: 700 to 851
Halsey St
Length: 0.38 miles
Direction: E-W
Address range: 500 to 731
Direction: E-W
Address range: 500 to 731
Ash Ave
Length: 0.38 miles
Directions: E-W, N-S, SE-NW, SW-NE
Address range: 620 to 799
Directions: E-W, N-S, SE-NW, SW-NE
Address range: 620 to 799
Beech Ave
Length: 0.37 miles
Direction: N-S
Address range: 618 to 799
Direction: N-S
Address range: 618 to 799
Date Ave
Length: 0.35 miles
Direction: N-S
Address range: 725 to 899
Direction: N-S
Address range: 725 to 899
Cedar Ave
Length: 0.31 miles
Direction: N-S
Address range: 650 to 849
Direction: N-S
Address range: 650 to 849
Kearney St
Length: 0.29 miles
Directions: E-W, SW-NE
Address range: 639 to 731
Directions: E-W, SW-NE
Address range: 639 to 731
Riverlawn Ave
Length: 0.24 miles
Direction: N-S
Address range: 719 to 849
Direction: N-S
Address range: 719 to 849
James St
Length: 0.21 miles
Direction: E-W
Address range: 500 to 599
Direction: E-W
Address range: 500 to 599
W Manor Dr
Length: 0.21 miles
Directions: E-W, N-S, SE-NW, SW-NE
Address range: 600 to 699
Directions: E-W, N-S, SE-NW, SW-NE
Address range: 600 to 699
E Manor Dr
Length: 0.21 miles
Directions: E-W, N-S, SE-NW, SW-NE
Address range: 600 to 699
Directions: E-W, N-S, SE-NW, SW-NE
Address range: 600 to 699
E Park Ln
Length: 0.19 miles
Direction: N-S
Address range: 600 to 699
Direction: N-S
Address range: 600 to 699
J Esplanade
Length: 0.04 miles
Direction: N-S
Address range: 691 to 699
Direction: N-S
Address range: 691 to 699