Valley View Heights neighborhood in Coralville, Iowa (IA), 52241 detailed profile
Settings
X


Business Search - 14 Million verified businesses
Area: 0.244 square miles
Population: 803
Population density:
| Valley View Heights: | 3,287 people per square mile |
| Coralville: | 2,207 people per square mile |

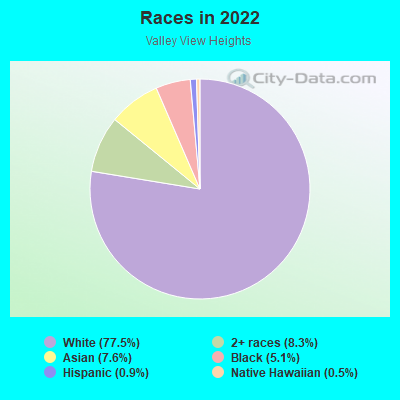
- 68077.5%White
- 738.3%Two or more races
- 677.6%Asian
- 455.1%Black
- 80.9%Hispanic or Latino
- 40.5%Native Hawaiian and Other
Pacific Islander
Median household income in 2022:
| Valley View Heights: | $46,845 |
| Coralville: | $67,691 |
Distribution of median household income
![Distribution of median household income]()
- 24Less than $10,000
- 45$10,000 to $19,999
- 41$20,000 to $29,999
- 43$30,000 to $39,999
- 61$40,000 to $49,999
- 59$50,000 to $59,999
- 25$60,000 to $74,999
- 76$75,000 to $99,999
- 28$100,000 to $124,999
- 37$125,000 to $149,999
- 3$150,000 to $199,999
- 11$200,000 or more

Distribution of owner-occupied house/condo value
![Distribution of owner-occupied house/condo value]()
- 3Less than $50,000
- 3$50,000 to $99,999
- 34$100,000 to $149,999
- 143$150,000 to $199,999
- 65$200,000 to $249,999
- 60$250,000 to $299,999
- 5$300,000 to $399,999

Distribution of rent paid by renters
![Distribution of rent paid by renters]()
- 1$100 to $199
- 2$400 to $499
- 12$500 to $599
- 7$600 to $699
- 31$700 to $799
- 64$800 to $899
- 18$900 to $999
- 29$1,000 to $1,249
- 25$1,250 to $1,499
- 16$1,500 to $1,999
- 3$2,000 or more

Median rent in 2022:
| Valley View Heights: | $1,057 |
| Coralville: | $907 |
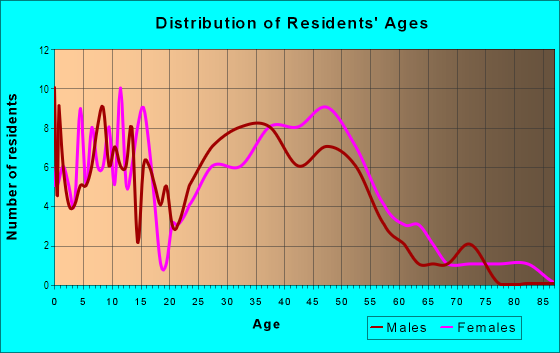
| Males: | 411 |
| Females: | 392 |
Males:
| This neighborhood: | 33.6 years |
| Whole city: | 32.8 years |
| This neighborhood: | 32.3 years |
| Whole city: | 32.3 years |
Average household size:
| Valley View Heights: | 1.9 people |
| Coralville: | 2.2 people |
Percentage of family households:
| Valley View Heights: | 27.7% |
| Coralville: | 41.6% |
| Here: | 34.0% |
| Coralville: | 39.7% |
Percentage of married-couple families with children (among all households):
| Valley View Heights: | 31.8% |
| Coralville: | 31.3% |
Percentage of single-mother households (among all households):
| Valley View Heights: | 15.6% |
| Coralville: | 9.4% |
Percentage of never married males 15 years old and over:
Percentage of never married females 15 years old and over:
| Valley View Heights: | 25.7% |
| Coralville: | 23.3% |
Percentage of never married females 15 years old and over:
| Valley View Heights: | 17.5% |
| city: | 17.9% |
Percentage of people that speak English not well or not at all:
| Valley View Heights: | 2.0% |
| Coralville: | 2.4% |
Percentage of people born in this state:
Percentage of people born in another U.S. state:
Percentage of native residents but born outside the U.S.:
Percentage of foreign born residents:
| Here: | 54.5% |
| Coralville: | 50.4% |
Percentage of people born in another U.S. state:
| Valley View Heights: | 26.7% |
| Coralville: | 33.0% |
Percentage of native residents but born outside the U.S.:
| Here: | 0.8% |
| city: | 1.3% |
Percentage of foreign born residents:
| Here: | 18.0% |
| Coralville: | 15.3% |
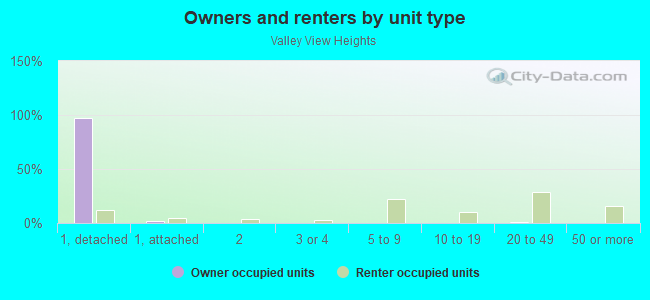
Owner-occupied
Renter-occupied

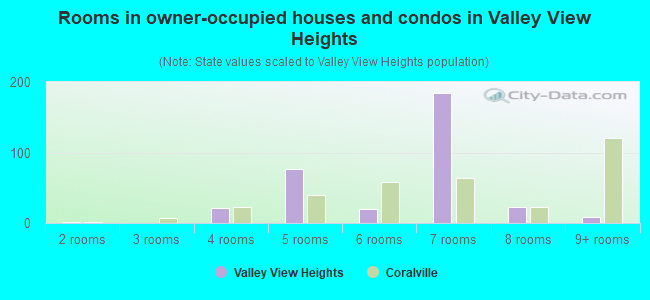
- Rooms in owner-occupied houses and condos in Valley View Heights
- 01 room
- 22 rooms
- 03 rooms
- 214 rooms
- 765 rooms
- 206 rooms
- 1857 rooms
- 238 rooms
- 89+ rooms
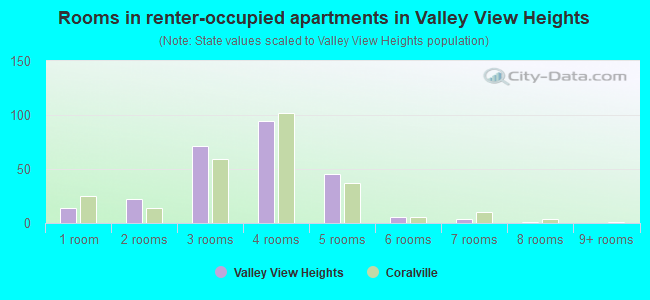
- Rooms in renter-occupied apartments in Valley View Heights
- 141 room
- 222 rooms
- 713 rooms
- 944 rooms
- 455 rooms
- 66 rooms
- 47 rooms
- 18 rooms
- 09+ rooms
Owner-occupied
Renter-occupied
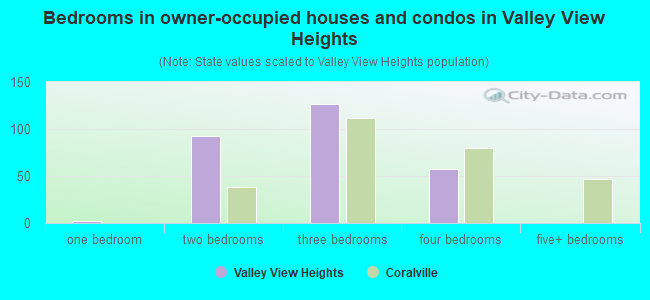
- Bedrooms in owner-occupied houses and condos in Valley View Heights
- 0no bedroom
- 21 bedroom
- 932 bedrooms
- 1273 bedrooms
- 574 bedrooms
- 05+ bedrooms
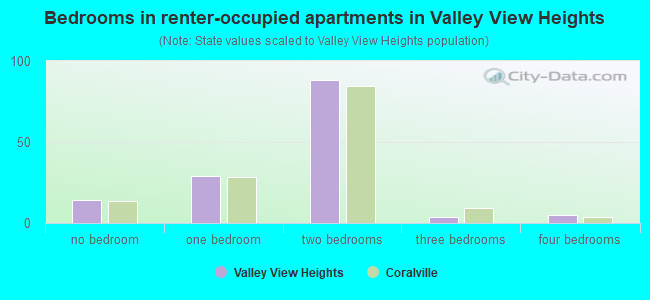
- Bedrooms in renter-occupied apartments in Valley View Heights
- 14no bedroom
- 291 bedroom
- 882 bedrooms
- 43 bedrooms
- 54 bedrooms
- 05+ bedrooms
Average number of cars or other vehicles available in houses/condos:
Average number of cars or other vehicles available in apartments:
| This neighborhood: | 1.8 |
| Coralville: | 1.9 |
Average number of cars or other vehicles available in apartments:
| Here: | 1.0 |
| city: | 1.3 |
Percentage of units with a mortgage:
| Valley View Heights: | 62.2% |
| Coralville: | 64.5% |
Average estimated value of detached houses in 2022 (75.4% of all units):
| Valley View Heights: | $210,079 |
| Iowa: | $245,224 |
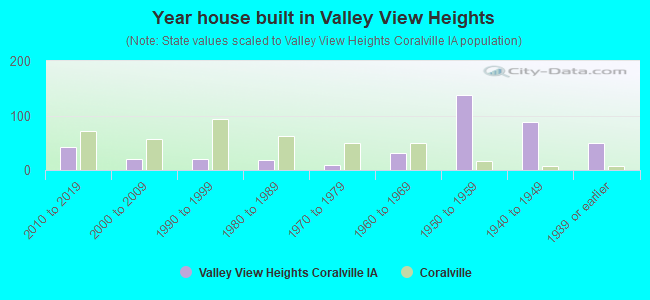
- Year house built in Valley View Heights
- 02020 or later
- 422010 to 2019
- 202000 to 2009
- 211990 to 1999
- 181980 to 1989
- 91970 to 1979
- 321960 to 1969
- 1371950 to 1959
- 881940 to 1949
- 501939 or earlier
City-data.com crime index for city in 2020 (higher means more crime):
| City: | 237.9 |
| U.S. average: | 219.5 |
Travel time to work (commute)
![Travel time to work (commute)]()
- 14Less than 5 minutes
- 745 to 9 minutes
- 11710 to 14 minutes
- 7715 to 19 minutes
- 4520 to 24 minutes
- 725 to 29 minutes
- 3230 to 34 minutes
- 235 to 39 minutes
- 1240 to 44 minutes
- 1745 to 59 minutes
- 2660 to 89 minutes
- 690 or more minutes

Means of transportation to work
![Means of transportation to work]()
- 78.7%338Drove a car alone
- 6.8%29Carpooled
- 9.1%39Bus
- 3.7%16Bicycle
- 4.4%19Walked
- 1.9%8Other means
- 1.2%5Worked at home

Time leaving home to go to work
![Time leaving home to go to work]()
- 312:00 a.m. to 4:59 a.m.
- 105:00 a.m. to 5:29 a.m.
- 85:30 a.m. to 5:59 a.m.
- 76:00 a.m. to 6:29 a.m.
- 376:30 a.m. to 6:59 a.m.
- 767:00 a.m. to 7:29 a.m.
- 657:30 a.m. to 7:59 a.m.
- 248:00 a.m. to 8:29 a.m.
- 88:30 a.m. to 8:59 a.m.
- 299:00 a.m. to 9:59 a.m.
- 910:00 a.m. to 10:59 a.m.
- 111:00 a.m. to 11:59 a.m.
- 6012:00 p.m. to 3:59 p.m.
- 814:00 p.m. to 11:59 p.m.

Occupations of males:
- Percentage of males in management occupations (except farmers):
Here: 16.2% city: 9.8%
- Percentage of males in business and financial operations occupations:
Here: 11.2% city: 5.2%
- Percentage of males in computer and mathematical occupations:
Here: 8.6% city: 5.7%
- Percentage of males in architecture and engineering occupations:
Here: 1.3% city: 2.5%
- Percentage of males in life, physical, and social science occupations:
Here: 2.1% city: 3.3%
- Percentage of males in community and social services occupations:
Here: 11.0% city: 2.3%
- Percentage of males in education, training, and library occupations:
Here: 8.9% city: 9.1%
- Percentage of males in arts, design, entertainment, sports, and media occupations:
Here: 5.3% city: 1.7%
- Percentage of males in healthcare practitioners and technical occupations:
Here: 16.0% city: 10.0%
- Percentage of males in service occupations:
Here: 3.3% city: 13.7%
- Percentage of males in sales and office occupations:
Here: 11.3% city: 12.1%
- Percentage of males in production occupations:
Here: 1.8% city: 9.7%
- Percentage of males in transportation occupations:
Here: 1.5% city: 3.0%
- Percentage of males in material moving occupations:
Here: 1.7% city: 6.6%
Occupations of females:
- Percentage of females in management occupations (except farmers):
Here: 11.5% city: 11.2%
- Percentage of females in business and financial operations occupations:
Here: 8.0% city: 4.1%
- Percentage of females in computer and mathematical occupations:
Here: 6.4% city: 1.1%
- Percentage of females in architecture and engineering occupations:
Here: 2.0% city: 0.5%
- Percentage of females in community and social services occupations:
Here: 2.5% city: 3.1%
- Percentage of females in education, training, and library occupations:
Here: 9.2% city: 8.7%
- Percentage of females in healthcare practitioners and technical occupations:
Here: 13.7% city: 15.8%
- Percentage of females in service occupations:
Here: 36.6% city: 18.0%
- Percentage of females in sales and office occupations:
Here: 8.4% city: 23.0%
- Percentage of females in transportation occupations:
Here: 3.8% city: 0.2%
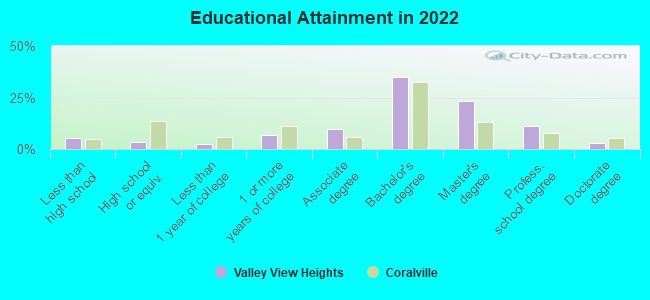
Education in this neighborhood (subdivision or community):
- Percentage of people 3 years and older in K-12 schools:
Valley View Heights: 11.8% Coralville: 12.3%
- Percentage of people 3 years and older in undergraduate colleges:
Valley View Heights: 7.2% Coralville: 6.5%
- Percentage of people 3 years and older in grad. or professional schools:
Valley View Heights: 6.6% Coralville: 4.6%
- Percentage of students K-12 enrolled in private schools:
Valley View Heights: 0.0% Coralville: 7.1%
Percentage of population below poverty level:
| Valley View Heights: | 28.0% |
| Coralville: | 10.7% |
Median year owner moved in (as recorded in 2022):
Median year renter moved in (as recorded in 2022):
| Valley View Heights: | 2011 |
| Coralville: | 2012 |
Median year renter moved in (as recorded in 2022):
| Valley View Heights: | 2017 |
| Coralville: | 2018 |
Percentage of married-couple families with both working:
| Valley View Heights: | 98.7% |
| Coralville: | 86.7% |
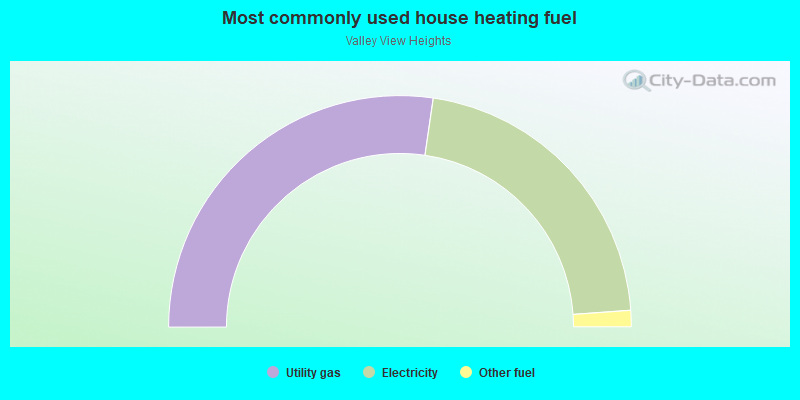
- 54.6%Utility gas
- 43.1%Electricity
- 2.3%Other fuel
Limited-access highways (interstate or state) in this neighborhood:
I- 80
Length: 0.22 miles
Direction: E-W
Direction: E-W
Roads and streets:
Valley View Dr
Length: 0.63 miles
Directions: E-W, N-S, SE-NW, SW-NE
Address range: 1400 to 1499
Directions: E-W, N-S, SE-NW, SW-NE
Address range: 1400 to 1499
13th St
Length: 0.57 miles
Directions: E-W, N-S, SE-NW, SW-NE
Address range: 1400 to 1861
Directions: E-W, N-S, SE-NW, SW-NE
Address range: 1400 to 1861
10th St
Length: 0.44 miles
Direction: E-W
Address range: 1200 to 1899
Direction: E-W
Address range: 1200 to 1899
11th St
Length: 0.39 miles
Directions: E-W, N-S, SE-NW, SW-NE
Address range: 1400 to 1799
Directions: E-W, N-S, SE-NW, SW-NE
Address range: 1400 to 1799
12th Ave
Length: 0.23 miles
Directions: E-W, N-S, SW-NE
Address range: 1000 to 1244
Directions: E-W, N-S, SW-NE
Address range: 1000 to 1244
19th Ave
Length: 0.20 miles
Directions: N-S, SE-NW
Address range: 1000 to 1199
Directions: N-S, SE-NW
Address range: 1000 to 1199
16th Ave
Length: 0.18 miles
Directions: E-W, N-S, SW-NE
Address range: 1000 to 1099
Directions: E-W, N-S, SW-NE
Address range: 1000 to 1099
17th Ave
Length: 0.16 miles
Directions: N-S, SE-NW
Address range: 1000 to 1199
Directions: N-S, SE-NW
Address range: 1000 to 1199
Cole Rd
Length: 0.16 miles
Direction: E-W
Address range: 700 to 799
Direction: E-W
Address range: 700 to 799
Southview Cir
Length: 0.12 miles
Direction: SW-NE
Address range: 1300 to 1399
Direction: SW-NE
Address range: 1300 to 1399
Valley View Cir
Length: 0.05 miles
Direction: E-W
Address range: 1400 to 1499
Direction: E-W
Address range: 1400 to 1499
Railroad features:
Cedar Rapids and Iowa City RR
Length: 0.03 miles
Direction: N-S
Direction: N-S