Estimated zip code population in 2022: 22,576 Zip code population in 2010: 18,911 Zip code population in 2000: 15,177
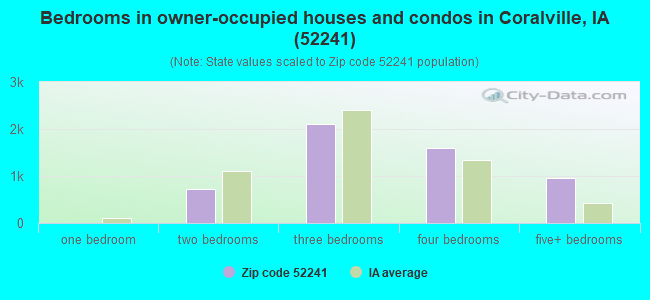
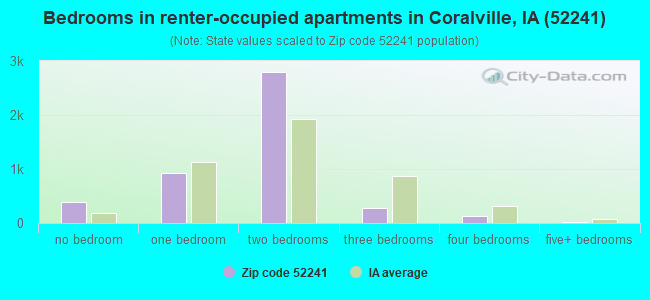
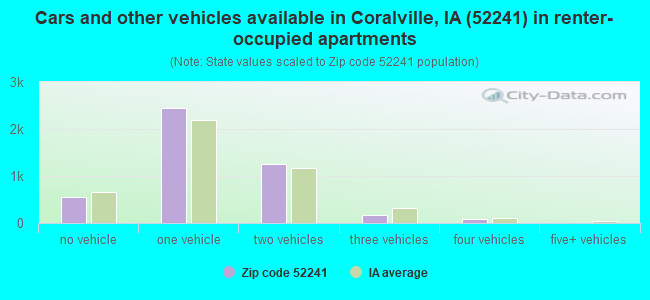
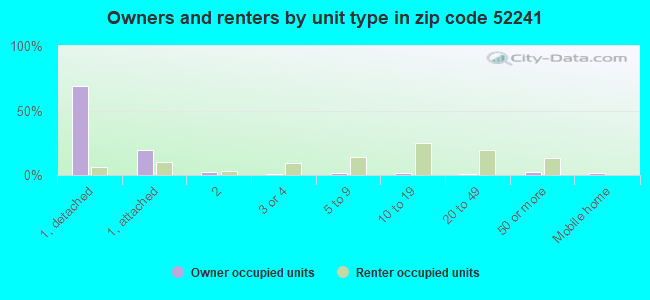
Houses and condos: 10,137 Renter-occupied apartments: 4,473
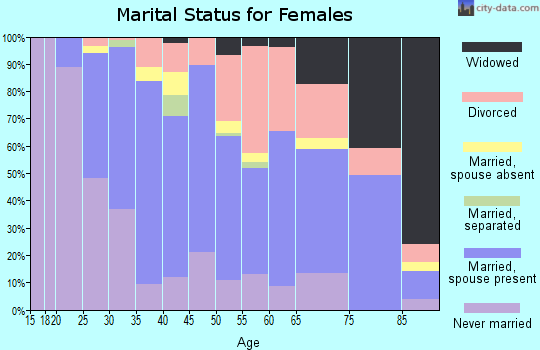
% of renters here:
45%
State:
28%
March 2022 cost of living index in zip code 52241: 91.4 (less than average, U.S. average is 100)
Land area: 11.9 sq. mi. Water area: 0.0 sq. mi.
Population density: 1,900 people per square mile
(low).
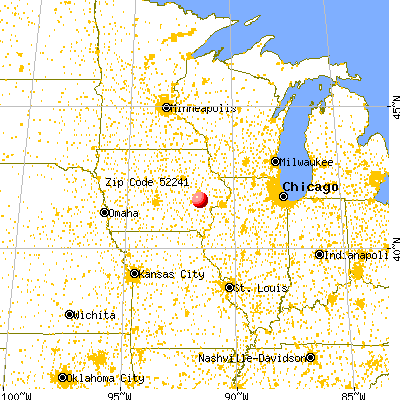
OSM Map
General Map
Google Map
MSN Map
OSM Map
General Map
Google Map
MSN Map
OSM Map
General Map
Google Map
MSN Map
OSM Map
General Map
Google Map
MSN Map
Please wait while loading the map...
Real estate property taxes paid for housing units in 2022:
This zip code:
1.6% ($4,666)
Iowa:
1.4% ($2,724)
Median real estate property taxes paid for housing units with mortgages in 2022: $4,342 (1.5%) Median real estate property taxes paid for housing units with no mortgage in 2022: $5,429 (1.8%)
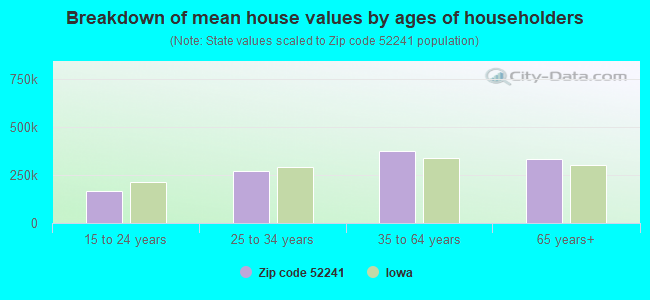
Estimated median house/condo value in 2022: $291,257
52241:
$291,257
Iowa:
$194,600
According to our research of Iowa and other state lists, there were 47 registered sex offenders living in 52241 zip code as of May 15, 2024. The ratio of all residents to sex offenders in zip code 52241 is 434 to 1. The ratio of registered sex offenders to all residents in this zip code is near the state average.
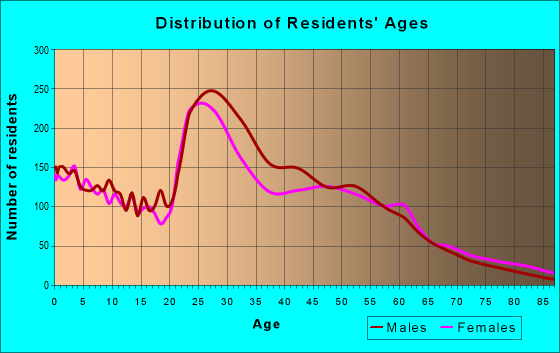
Median resident age:
This zip code:
33.0 years
Iowa median age:
38.9 years
Average household size:
This zip code:
2.2 people
Iowa:
2.3 people
Averages for the 2020 tax year for zip code 52241, filed in 2021:
Average Adjusted Gross Income (AGI) in 2020: $88,314 (Individual Income Tax Returns)
Here:
$88,314
State:
$71,087
Salary/wage: $64,693 (reported on 86.6% of returns)
Here:
$64,693
State:
$57,361
(% of AGI for various income ranges: 1262.1% for AGIs below $25k, 3567.2% for AGIs $25k-50k, 6398.0% for AGIs $50k-75k, 8733.3% for AGIs $75k-100k, 16856.9% for AGIs $100k-200k, 65683.5% for AGIs over 200k)
Taxable interest for individuals: $2,540 (reported on 39.4% of returns)
This zip code:
$2,540
Iowa:
$1,633
(% of AGI for various income ranges: 14.3% for AGIs below $25k, 21.6% for AGIs $25k-50k, 55.5% for AGIs $50k-75k, 89.2% for AGIs $75k-100k, 265.5% for AGIs $100k-200k, 2043.5% for AGIs over 200k)
Ordinary dividends: $6,638 (reported on 24.8% of returns)
Here:
$6,638
State:
$5,432
(% of AGI for various income ranges: 19.4% for AGIs below $25k, 34.0% for AGIs $25k-50k, 83.0% for AGIs $50k-75k, 190.2% for AGIs $75k-100k, 509.3% for AGIs $100k-200k, 3149.0% for AGIs over 200k)
Net capital gain/loss in AGI: +$21,333 (reported on 23.0% of returns)
Here:
+$21,333
State:
+$15,243
(% of AGI for various income ranges: 13.3% for AGIs below $25k, 30.0% for AGIs $25k-50k, 106.7% for AGIs $50k-75k, 252.4% for AGIs $75k-100k, 781.5% for AGIs $100k-200k, 13594.2% for AGIs over 200k)
Profit/loss from business: +$15,039 (reported on 13.1% of returns)
Here:
+$15,039
State:
+$11,763
(% of AGI for various income ranges: 45.4% for AGIs below $25k, 64.3% for AGIs $25k-50k, 135.9% for AGIs $50k-75k, 316.7% for AGIs $75k-100k, 525.8% for AGIs $100k-200k, 3314.8% for AGIs over 200k)
Taxable individual retirement arrangement distribution: $25,972 (reported on 8.9% of returns)
52241:
$25,972
Iowa:
$17,324
(% of AGI for various income ranges: 31.6% for AGIs below $25k, 70.4% for AGIs $25k-50k, 180.4% for AGIs $50k-75k, 428.7% for AGIs $75k-100k, 898.5% for AGIs $100k-200k, 3046.5% for AGIs over 200k)
Self-employed (Keogh) retirement plans: $21,510 (reported on 0.9% of returns)
52241:
$21,510
Iowa:
$22,144
(% of AGI for various income ranges: 48.7% for AGIs $100k-200k, 554.2% for AGIs over 200k)
Total itemized deductions: $34,720 (reported on 9.6% of returns)
Here:
$34,720
State:
$33,775
(% of AGI for various income ranges: 63.1% for AGIs below $25k, 94.8% for AGIs $25k-50k, 296.4% for AGIs $50k-75k, 628.7% for AGIs $75k-100k, 883.0% for AGIs $100k-200k, 5361.6% for AGIs over 200k)
Charity contributions: $14,943 (reported on 7.1% of returns)
Here:
$14,943
State:
$13,075
(% of AGI for various income ranges: 2.8% for AGIs below $25k, 9.7% for AGIs $25k-50k, 34.1% for AGIs $50k-75k, 84.1% for AGIs $75k-100k, 191.0% for AGIs $100k-200k, 2752.3% for AGIs over 200k)
Taxes paid: $8,326 (reported on 9.2% of returns)
52241:
$8,326
State:
$7,704
(% of AGI for various income ranges: 8.1% for AGIs below $25k, 19.8% for AGIs $25k-50k, 84.4% for AGIs $50k-75k, 181.6% for AGIs $75k-100k, 264.4% for AGIs $100k-200k, 986.1% for AGIs over 200k)
Earned income credit: $2,126 (reported on 11.9% of returns)
Here:
$2,126
State:
$2,195
(% of AGI for various income ranges: 68.8% for AGIs below $25k, 44.8% for AGIs $25k-50k)
Percentage of individuals using paid preparers for their 2020 taxes: 94.8%
Here:
95%
State:
95%
(% for various income ranges: 93.6% for AGIs below $25k, 96.0% for AGIs $25k-50k, 95.3% for AGIs $50k-75k, 94.4% for AGIs $75k-100k, 94.8% for AGIs $100k-200k, 95.1% for AGIs over 200k)
Averages for the 2012 tax year for zip code 52241, filed in 2013:
Average Adjusted Gross Income (AGI) in 2012: $66,957 (Individual Income Tax Returns)
Here:
$66,957
State:
$58,860
Salary/wage: $56,378 (reported on 90.6% of returns)
Here:
$56,378
State:
$46,659
(% of AGI for various income ranges: 86.9% for AGIs below $25k, 88.4% for AGIs $25k-50k, 82.6% for AGIs $50k-75k, 79.4% for AGIs $75k-100k, 78.9% for AGIs $100k-200k, 63.3% for AGIs over 200k)
Taxable interest for individuals: $1,367 (reported on 46.1% of returns)
This zip code:
$1,367
Iowa:
$1,537
(% of AGI for various income ranges: 1.2% for AGIs below $25k, 0.6% for AGIs $25k-50k, 1.0% for AGIs $50k-75k, 0.8% for AGIs $75k-100k, 0.9% for AGIs $100k-200k, 1.0% for AGIs over 200k)
Ordinary dividends: $4,155 (reported on 24.9% of returns)
Here:
$4,155
State:
$4,542
(% of AGI for various income ranges: 1.2% for AGIs below $25k, 0.8% for AGIs $25k-50k, 1.2% for AGIs $50k-75k, 1.2% for AGIs $75k-100k, 1.4% for AGIs $100k-200k, 2.3% for AGIs over 200k)
Net capital gain/loss in AGI: +$10,120 (reported on 19.2% of returns)
Here:
+$10,120
State:
+$11,802
(% of AGI for various income ranges: 0.7% for AGIs below $25k, 0.3% for AGIs $25k-50k, 0.7% for AGIs $50k-75k, 0.6% for AGIs $75k-100k, 1.4% for AGIs $100k-200k, 7.3% for AGIs over 200k)
Profit/loss from business: +$14,348 (reported on 13.3% of returns)
Here:
+$14,348
State:
+$10,509
(% of AGI for various income ranges: 4.0% for AGIs below $25k, 2.1% for AGIs $25k-50k, 1.7% for AGIs $50k-75k, 2.4% for AGIs $75k-100k, 2.9% for AGIs $100k-200k, 3.4% for AGIs over 200k)
Taxable individual retirement arrangement distribution: $18,308 (reported on 8.0% of returns)
52241:
$18,308
Iowa:
$11,773
(% of AGI for various income ranges: 1.4% for AGIs below $25k, 1.6% for AGIs $25k-50k, 1.9% for AGIs $50k-75k, 2.9% for AGIs $75k-100k, 2.6% for AGIs $100k-200k, 2.2% for AGIs over 200k)
Self-employment retirement plans: $20,870 (reported on 1.1% of returns)
52241:
$20,870
Iowa:
$18,614
(% of AGI for various income ranges: 0.3% for AGIs $25k-50k, 0.2% for AGIs $100k-200k, 0.8% for AGIs over 200k)
Total itemized deductions: $23,565 (18% of AGI, reported on 36.2% of returns)
Here:
$23,565
State:
$21,278
Here:
17.9% of AGI
State:
18.9% of AGI
(% of AGI for various income ranges: 7.5% for AGIs below $25k, 7.5% for AGIs $25k-50k, 11.5% for AGIs $50k-75k, 14.3% for AGIs $75k-100k, 15.8% for AGIs $100k-200k, 13.5% for AGIs over 200k)
Charity contributions: $3,767 (reported on 29.4% of returns)
Here:
$3,767
State:
$4,044
(% of AGI for various income ranges: 0.4% for AGIs below $25k, 0.6% for AGIs $25k-50k, 1.1% for AGIs $50k-75k, 1.6% for AGIs $75k-100k, 2.1% for AGIs $100k-200k, 2.2% for AGIs over 200k)
Taxes paid: $11,222 (reported on 36.1% of returns)
52241:
$11,222
State:
$8,846
(% of AGI for various income ranges: 1.4% for AGIs below $25k, 2.4% for AGIs $25k-50k, 4.4% for AGIs $50k-75k, 6.2% for AGIs $75k-100k, 7.8% for AGIs $100k-200k, 7.7% for AGIs over 200k)
Earned income credit: $1,956 (reported on 13.7% of returns)
Here:
$1,956
State:
$2,098
(% of AGI for various income ranges: 4.6% for AGIs below $25k, 0.7% for AGIs $25k-50k)
Percentage of individuals using paid preparers for their 2012 taxes: 47.8%
Here:
48%
State:
65%
(% for various income ranges: 40.1% for AGIs below $25k, 44.1% for AGIs $25k-50k, 52.0% for AGIs $50k-75k, 54.5% for AGIs $75k-100k, 55.4% for AGIs $100k-200k, 75.5% for AGIs over 200k)
Averages for the 2004 tax year for zip code 52241, filed in 2005:
Average Adjusted Gross Income (AGI) in 2004: $49,594 (Individual Income Tax Returns)
Here:
$49,594
State:
$43,875
Salary/wage: $43,438 (reported on 91.9% of returns)
Here:
$43,438
State:
$38,265
(% of AGI for various income ranges: 115.0% for AGIs below $10k, 87.5% for AGIs $10k-25k, 90.0% for AGIs $25k-50k, 86.4% for AGIs $50k-75k, 86.7% for AGIs $75k-100k, 69.3% for AGIs over 100k)
Taxable interest for individuals: $1,229 (reported on 47.9% of returns)
This zip code:
$1,229
Iowa:
$1,768
(% of AGI for various income ranges: 3.3% for AGIs below $10k, 1.7% for AGIs $10k-25k, 1.1% for AGIs $25k-50k, 1.3% for AGIs $50k-75k, 0.6% for AGIs $75k-100k, 1.2% for AGIs over 100k)
Taxable dividends: $1,937 (reported on 27.8% of returns)
Here:
$1,937
State:
$2,510
(% of AGI for various income ranges: 2.3% for AGIs below $10k, 0.7% for AGIs $10k-25k, 0.8% for AGIs $25k-50k, 1.0% for AGIs $50k-75k, 1.0% for AGIs $75k-100k, 1.3% for AGIs over 100k)
Net capital gain/loss: +$8,376 (reported on 21.9% of returns)
Here:
+$8,376
State:
+$6,139
(% of AGI for various income ranges: -1.6% for AGIs below $10k, 0.3% for AGIs $10k-25k, 0.2% for AGIs $25k-50k, 0.6% for AGIs $50k-75k, 0.8% for AGIs $75k-100k, 8.3% for AGIs over 100k)
Profit/loss from business: +$15,605 (reported on 12.3% of returns)
Here:
+$15,605
State:
+$8,574
(% of AGI for various income ranges: 3.9% for AGIs below $10k, 3.0% for AGIs $10k-25k, 2.3% for AGIs $25k-50k, 2.3% for AGIs $50k-75k, 2.6% for AGIs $75k-100k, 5.7% for AGIs over 100k)
IRA payment deduction: $2,689 (reported on 2.3% of returns)
52241:
$2,689
Iowa:
$2,970
(% of AGI for various income ranges: 0.2% for AGIs $10k-25k, 0.2% for AGIs $25k-50k, 0.2% for AGIs $50k-75k, 0.2% for AGIs $75k-100k, 0.0% for AGIs over 100k)
Self-employed pension: $11,782 (reported on 1.4% of returns)
Here:
$11,782
Iowa:
$11,928
Total itemized deductions: $18,271 (20% of AGI, reported on 37.9% of returns)
Here:
$18,271
State:
$16,976
Here:
19.7% of AGI
State:
20.8% of AGI
(% of AGI for various income ranges: 8.0% for AGIs below $10k, 6.7% for AGIs $10k-25k, 10.0% for AGIs $25k-50k, 15.8% for AGIs $50k-75k, 17.4% for AGIs $75k-100k, 15.6% for AGIs over 100k)
Charity contributions deductions: $3,080 (3% of AGI, reported on 32.6% of returns)
Here:
$3,080
State:
$3,089
Here:
3.1% of AGI
State:
3.6% of AGI
(% of AGI for various income ranges: 0.3% for AGIs below $10k, 0.7% for AGIs $10k-25k, 1.1% for AGIs $25k-50k, 1.6% for AGIs $50k-75k, 1.9% for AGIs $75k-100k, 3.0% for AGIs over 100k)
Total tax: $7,515 (reported on 79.9% of returns)
52241:
$7,515
State:
$6,177
(% of AGI for various income ranges: 2.1% for AGIs below $10k, 4.6% for AGIs $10k-25k, 8.0% for AGIs $25k-50k, 9.3% for AGIs $50k-75k, 9.9% for AGIs $75k-100k, 17.6% for AGIs over 100k)
Earned income credit: $1,373 (reported on 10.9% of returns)
Here:
$1,373
State:
$1,540
Percentage of individuals using paid preparers for their 2004 taxes: 51.6%
Here:
52%
State:
70%
(% for various income ranges: 42.9% for AGIs below $10k, 48.6% for AGIs $10k-25k, 53.4% for AGIs $25k-50k, 55.7% for AGIs $50k-75k, 52.0% for AGIs $75k-100k, 63.2% for AGIs over 100k)
Likely homosexual households (counted as self-reported same-sex unmarried-partner households)
Lesbian couples: 0.2% of all households
Gay men: 0.0% of all households
Household received Food Stamps/SNAP in the past 12 months: 701 Household did not receive Food Stamps/SNAP in the past 12 months: 9,201
Women who had a birth in the past 12 months: 562 (459 now married, 107 unmarried) Women who did not have a birth in the past 12 months: 5,375 (2,070 now married, 3,306 unmarried)
Housing units in zip code 52241 with a mortgage: 3,440 (576 second mortgage, 36 home equity loan, 394 both second mortgage and home equity loan) Houses without a mortgage: 167
Median monthly owner costs for units with a mortgage: $1,812 Median monthly owner costs for units without a mortgage: $776
Residents with income below the poverty level in 2022:
This zip code:
10.5%
Whole state:
11.0%
Residents with income below 50% of the poverty level in 2022:
This zip code:
5.1%
Whole state:
5.5%
Median number of rooms in houses and condos:
Here:
7.2
State:
6.8
Median number of rooms in apartments:
Here:
3.8
State:
4.2
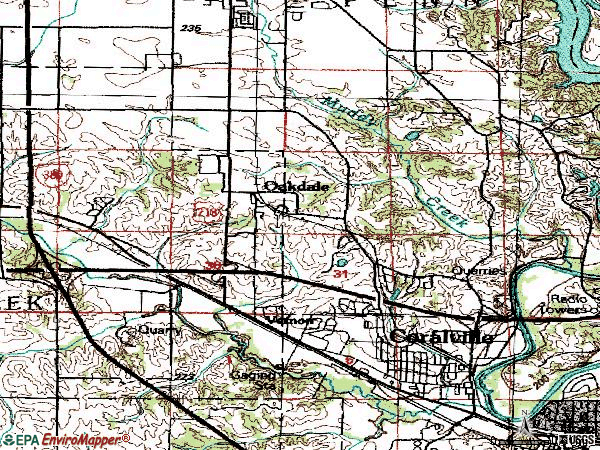
Notable locations in this zip code not listed on our city pages
Notable locations in zip code 52241: Oakdale (A), Coralville Edgewater Campground (B), Coralville (C), Lantern Park Plaza (D), Brown Deer Golf Course (E), Hope House (F), Multi Tenant Facility (G), UroSurge Building (H), Neural Building (I), CADSI Building (J), Oakdale Research Facilities (K), Hydraulics Oakdale Annex One (L), Physiology Research Lab (M), Institute for Rural and Environmental Health (N), Iowa Geological Survey Building (O), Oakdale Research Building (P), Hydraulics Oakdale Annex Two (Q), Oakdale Apartments (R), Technology Inovation Center (S), Oakdale Hall (T). Display/hide their locations on the map
Churches in zip code 52241 include: Tabernacle Baptist Church (A), Solid Rock Christian Church (B), Prince of Peace Lutheran Church (C), New Horizons Church (D), Celebration Assembly of God Church (E), New Life Community Church (F), Coralville United Methodist Church (G), New Song Episcopal Church (H), Grace United Church of Christ (I). Display/hide their locations on the map
Parks in zip code 52241 include: Nathaniel Fellows Historical Marker (1), Site of Mormon Handcart Brigade Camp Historical Marker (2), Auburn Hills Park (3), North Ridge Park (4), Morrison Park (5), Samuel Jordan Kirkwood State Historical Marker (6), Central Park (7), Edgewater Park (8). Display/hide their locations on the map
3,183 married couples with children.
1,046 single-parent households (200 men, 846 women).
79.3% of residents of 52241 zip code speak English at home.
2.2% of residents speak Spanish at home (75% very well, 21% well, 4% not well).
6.3% of residents speak other Indo-European language at home (67% very well, 24% well, 5% not well, 4% not at all).
5.5% of residents speak Asian or Pacific Island language at home (70% very well, 20% well, 5% not well, 5% not at all).
6.1% of residents speak other language at home (38% very well, 41% well, 22% not well).
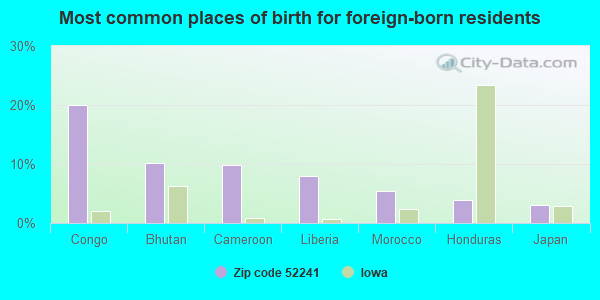
Foreign born population: 3,656 (16.2%) (34.0% of them are naturalized citizens)
This zip code:
16.2%
Whole state:
6.0%
20%Congo
10%Bhutan
10%Cameroon
8%Liberia
5%Morocco
4%Honduras
3%Japan
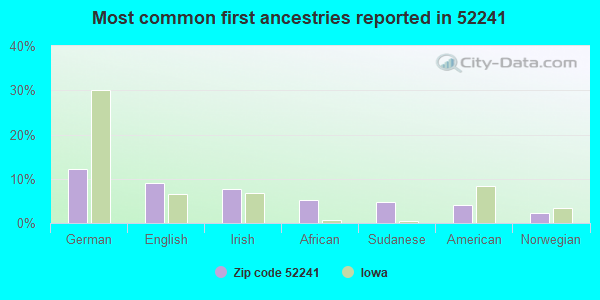
12%German
9%English
8%Irish
5%African
5%Sudanese
4%American
2%Norwegian
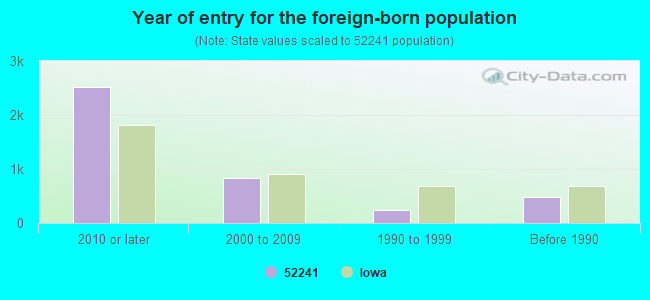
Year of entry for the foreign-born population
2,5192010 or later
8422000 to 2009
2331990 to 1999
477Before 1990
Major facilities with environmental interests located in this zip code:
HOBBY LOBBY (2050 8TH ST in CORALVILLE, IA)
(Resource Conservation and Recovery Act (tracking hazardous waste)) - ICIS-, ENFORCEMENT/COMPLIANCE ACTIVITY Organizations: SHOPKO (CONTACT/OWNER)
Alternative names: SHOPKO #0168
DELIMART (506 2ND in CORALVILLE, IA)
(Resource Conservation and Recovery Act (tracking hazardous waste)) - ICIS-, ENFORCEMENT/COMPLIANCE ACTIVITY Organizations: WARE & MCDONALD OIL CO (CONTACT/OWNER)
Alternative names: WARECO SERVICE STATION #663
TRUCK SHOP (120 E 9TH ST in CORALVILLE, IA)
Conditionally Exempt Small Quantity Generators, less than 100 kg/month of hazardous waste (Resource Conservation and Recovery Act (tracking hazardous waste)) - ICIS-, ENFORCEMENT/COMPLIANCE ACTIVITY Business NAICS classification: ALL OTHER AUTOMOTIVE REPAIR AND MAINTENANCE. Organizations: TREBRON TRUCK REFINISHING (CONTACT/OPERATOR)
Alternative names: TREBRON TRUCK REFINISHING
NORTHWEST JUNIOR HIGH SCHOOL (1507 8TH ST in CORALVILLE, IA)
ENFORCEMENT/COMPLIANCE ACTIVITY (Integrated Compliance Information System) (National Center for Education Statistics) - STATE ID-523141 213 Organizations: IOWA CITY COMM SCHOOL DISTRICT (SCHOOL DISTRICT)
Alternative names: NORTHWEST JR HIGH SCHOOL
CENTRAL ELEMENTARY SCHOOL (501 6TH ST in CORALVILLE, IA)
(National Center for Education Statistics) - STATE ID-523141 403 Organizations: IOWA CITY COMM SCHOOL DISTRICT (SCHOOL DISTRICT)
ROCKWELL COLLINS INC. - CORALVILLE OPERATIONS (2855 HEARTLAND DRIVE in CORALVILLE, IA)
AIR SYNTHETIC MINOR (AIRS/AFS) CRITERIA AND HAZARDOUS AIR POLLUTANT INVENTORY (Inventory of air pollution sources) PERFORMANCE TRACK (National Environmental Performance Track) HAZARDOUS WASTE BIENNIAL REPORTER (Resource Conservation and Recovery Act (tracking hazardous waste)) Small Quantity Generators, between 100 kg and 1000 kg of hazardous waste/month (Resource Conservation and Recovery Act (tracking hazardous waste)) - notification TRI REPORTER (Tracking of toxic chemicals releasing facilities) Business SIC classification: RADIO AND TELEVISION BROADCASTING AND COMMUNICATIONS EQUIPMENT; COMMUNICATIONS EQUIPMENT Business NAICS classification: PRINTED CIRCUIT ASSEMBLY (ELECTRONIC ASSEMBLY) MANUFACTURING. Organizations: HEARTLAND EXPRESS (CONTACT/OWNER)
Alternative names: ROCKWELL COLLINS INC. CORALVILLE OPS.
CONCORD CUSTOM CLEANERS #6085 (89 2ND ST #2 in CORALVILLE, IA)
(Resource Conservation and Recovery Act (tracking hazardous waste))
UNIVERSITY OF IOWA OAKDALE POW (OFF HWY 218 1 MI N OF TOWN in CORALVILLE, IA)
(Integrated Compliance Information System) - ICIS-07-1980-0016, FORMAL ENFORCEMENT ACTION
UNIVERSAL CLIMATE CONTROL INC (107 10TH AVE S in CORALVILLE, IA)
(Resource Conservation and Recovery Act (tracking hazardous waste))
CONTIGROUP COMPANIES INCORPORATED WAYNE FEED DIVISION (3400 2ND STREET in CORALVILLE, IA)
AIR MINOR (AIRS/AFS) TRI REPORTER (Tracking of toxic chemicals releasing facilities) Business SIC classification: PREPARED FEEDS AND FEED INGREDIENTS FOR ANIMALS AND FOWLS, EXCEPT DOGS AND CATS; GENERAL WAREHOUSING AND STORAGE; BUSINESS SERVICES Alternative names: CLOSED FACILITY -- CONTIGROUP COMPANIES INCORPORATED WAYNE FEED DIVISION, CONTIGROUP COS. INC. WAYNE FEED DIV., CONTINENTAL GRAIN CO. IN.WAYNE FEED DIV., CONTRIGROUP COS. INC. WAYNE FEED DIV., CONTRIGROUP COS. INC. WAYNE FEED DIV. (CLOSE 9-1-01, HUBBARD FEED, INC.-ANIMAL NUTR
QUIKTRIP CORP STORE 553 (822 1ST AVE in CORALVILLE, IA)
(Resource Conservation and Recovery Act (tracking hazardous waste)) Organizations: HIPPEE OIL CO INC (CONTACT/OWNER)
ALBANY MOLECULAR RESEARCH, INC. (2660 CROSSPARK ROAD in CORALVILLE, IA)
CORALVILLE, CITY OF MS4 (1512 SEVENTH ST. in CORALVILLE, IA)
National Pollutant Discharge Elimination System NON-MAJOR (Tracking pollutant discharge elimination systems) - permit Alternative names: CABIN CREEK LTD PARTNERSHIP, CORALVILLE, IA (RLF), CORALVILLE RLF C/O CITY HALL
Housing units lacking complete kitchen facilities: 0.8%
68.7%Utility gas
27.3%Electricity
2.3%Bottled, tank, or LP gas
1.4%Other fuel
Population in 1990: 12,646. Population change in the 1990s: +2,531 (+20.0%).
Place of birth for U.S.-born residents:
This state: 11,406
Northeast: 514
Midwest: 4,284
South: 1,330
West: 1,195
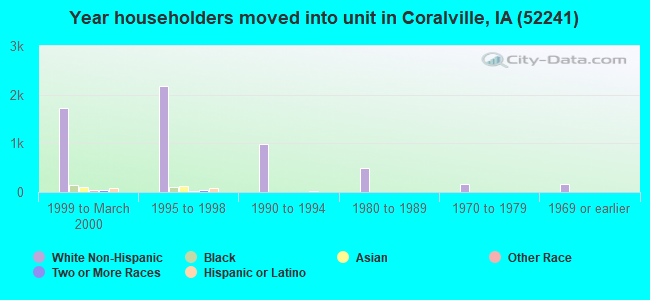
32% of the 52241 zip code residents lived in the same house 5 years ago. Out of people who lived in different houses, 39% lived in this county. Out of people who lived in different counties, 50% lived in Iowa.
78% of the 52241 zip code residents lived in the same house 1 year ago. Out of people who lived in different houses, 45% moved from this county. Out of people who lived in different houses, 39% moved from different county within same state. Out of people who lived in different houses, 13% moved from different state. Out of people who lived in different houses, 1% moved from abroad.
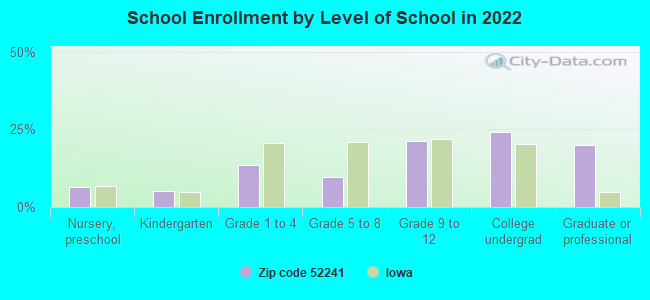
Private vs. public school enrollment:
Students in private schools in grades 1 to 8 (elementary and middle school): 127
Here:
10.2%
Iowa:
10.6%
Students in private schools in grades 9 to 12 (high school): 44
Here:
4.0%
Iowa:
7.9%
Students in private undergraduate colleges: 61
Here:
4.9%
Iowa:
23.9%
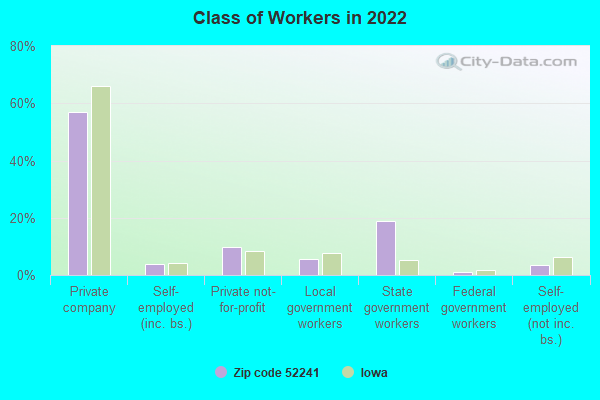
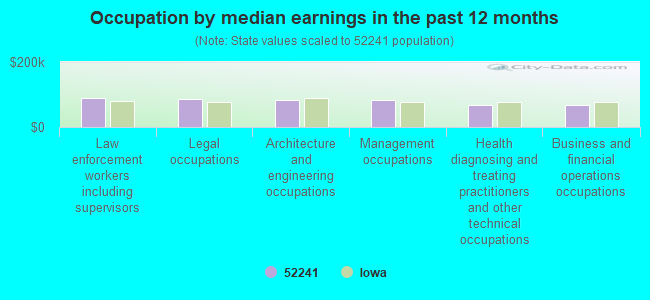
Occupation by median earnings in the past 12 months ($)
90,748Law enforcement workers including supervisors
86,106Legal occupations
83,764Architecture and engineering occupations
82,316Management occupations
69,180Health diagnosing and treating practitioners and other technical occupations
67,264Business and financial operations occupations
Companies with federal contracts located in this zip code (CORALVILLE, IA):
NATURE CARE COMPANY (212 1ST ST; small business) : $59,834 in 14 contractsfrom 2001 to 2004
Contracts for Landscaping/Groundskeeping Services by U.S. Army Corps of Engineers - civil program financing only, Army Signed by year:2000: $0; 2001: $12,999; 2002: $1,928; 2003: $14,267; 2004: $30,640; 2005: $0; 2006: $0.
Biggest contracts:
$14,284 with U.S. Army Corps of Engineers - civil program financing only for Landscaping/Groundskeeping Services. Signed on 2004-02-26. Completion date: 2002-10-31.
$14,284 with Army for Landscaping/Groundskeeping Services. Signed on 2004-02-26. Completion date: 2002-10-31.
$13,868 with U.S. Army Corps of Engineers - civil program financing only for Landscaping/Groundskeeping Services. Signed on 2003-01-15. Completion date: 2002-10-31.
$13,464, same as above.Signed on 2001-12-11. Completion date: 2002-10-31.
WEST MUSIC COMPANY, INC (1212 5TH ST; small business) : $57,621 in 14 contractsfrom 2004 to 2006
Contracts for Musical Instrument Parts and Accessories, Musical Instruments, Hospital Furniture, Equipment, Utensils, and Supplies by Department of Defense Education Activity, Navy, Air Force, Army, and others Signed by year:2000: $0; 2001: $0; 2002: $0; 2003: $0; 2004: $27,439; 2005: $17,763; 2006: $12,419.
Biggest contracts:
$14,073 with Department of Defense Education Activity for Musical Instrument Parts and Accessories. Signed on 2004-09-30. Completion date: 2004-11-25.
$12,235 with Navy for Musical Instruments. Taking place in VA. Signed on 2006-02-17. Completion date: 2006-03-06.
$10,850 with Air Force for Musical Instruments. Signed on 2005-09-29. Completion date: 2005-10-14.
$8,075 with Army for Musical Instruments. Signed on 2004-06-15. Completion date: 2004-08-13.
AQUADRILL INCORPORATED (717 EAST 2ND AVENUE; small business)
$52,770 with U.S. Army Corps of Engineers - civil program financing only for Water Quality Support Services. Taking place in NE. Signed on 2000-02-01. Completion date: 2000-04-28.
LMS COMPUTER AIDED DESIGN SIMU (2651 CROSSPARK RD; small business)
$40,000 with U.S. Army Corps of Engineers - civil program financing only for ADP Software. Signed on 2000-02-16. Completion date: 2000-04-28.
BUSINESS RADIO SALES & SERVICE (1418 5TH ST; small business) : $35,838 in 3 contractsfrom 2004 to 2005
$15,008 with Army for Radio and Television Communication Equipment, Except Airborne. Signed on 2004-09-07. Completion date: 2004-08-27.
$15,008 with U.S. Army Corps of Engineers - civil program financing only for Radio and Television Communication Equipment, Except Airborne. Signed on 2004-09-07. Completion date: 2004-08-27.
$5,822 with Army for Radio and Television Communication Equipment, Except Airborne. Signed on 2005-10-14. Completion date: 2005-10-06.
STANLEY CONSULTANTS INC (2658 CROSSPARK ROAD SUITE)
$24,990 with Army for Other Special Studies and Analyses. Taking place in IL. Signed on 2005-09-08. Completion date: 2005-09-30.
NAKATO, TATSUAKI (608 PINERIDGE RD; small business) : $21,162 in 2 contractsfrom 2002 to 2003
$17,162 with U.S. Army Corps of Engineers - civil program financing only for Environmental Studies and Assessments. Signed on 2003-01-17. Completion date: 2003-04-30.
$4,000 with U.S. Army Corps of Engineers - civil program financing only for Water Quality Studies. Signed on 2002-08-19. Completion date: 2002-09-30.
CITY TRACTOR COMPANY INC (1000 25TH AVE)
$20,590 with U.S. Army Corps of Engineers - civil program financing only for Tractors, Wheeled. Signed on 2005-09-06. Completion date: 2005-09-30.
Top industries in this zip code by the number of employees in 2005:
Information: Data Processing, Hosting, and Related Services (500-999 employees: 1 establishment, 250-499 employees: 4 establishments, 10-19 employees: 1 establishment, 1-4 employees: 1 establishment)
Accommodation and Food Services: Hotels (except Casino Hotels) and Motels (100-249: 1, 20-49: 6, 10-19: 4, 5-9: 2, 1-4: 4)
Professional, Scientific, and Technical Services: Research and Development in the Physical, Engineering, and Life Sciences (250-499: 1, 20-49: 1, 1-4: 1)
Finance and Insurance: Direct Property and Casualty Insurance Carriers (250-499: 1)
People in group quarters in 2010:
928 people in state prisons
141 people in nursing facilities/skilled-nursing facilities
53 people in correctional residential facilities
8 people in group homes for juveniles (non-correctional)
People in group quarters in 2000:
767 people in state prisons
84 people in nursing homes
8 people in homes for the physically handicapped
Fatal accident statistics in 2014:
Fatal accident count: 1
Vehicles involved in fatal accidents: 2
Fatal accidents caused by drunken drivers: 0
Fatalities: 1
Persons involved in fatal accidents: 6
Pedestrians involved in fatal accidents: 0
Fatal accident statistics in 2012:
Fatal accident count: 1
Vehicles involved in fatal accidents: 1
Fatal accidents caused by drunken drivers: 1
Fatalities: 1
Persons involved in fatal accidents: 1
Pedestrians involved in fatal accidents: 0
Home Mortgage Disclosure Act Aggregated Statistics For Year 2009 (Based on 3 full and 2 partial tracts)
A) FHA, FSA/RHS & VA Home Purchase Loans
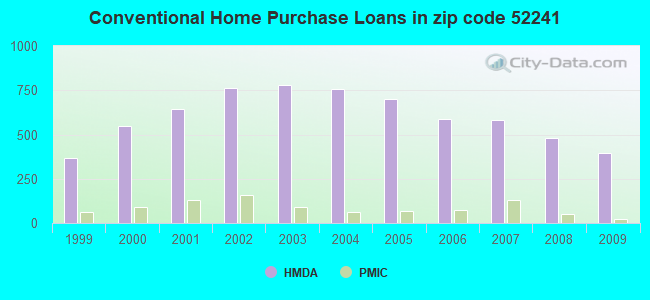
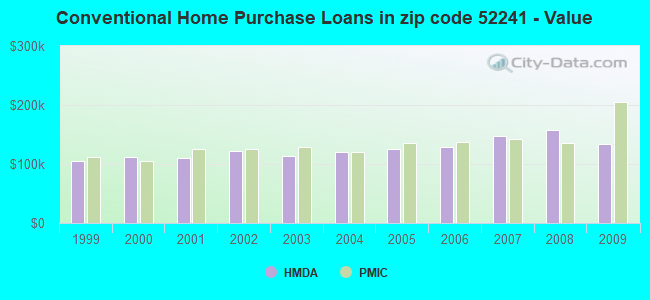
B) Conventional Home Purchase Loans
C) Refinancings
D) Home Improvement Loans
E) Loans on Dwellings For 5+ Families
F) Non-occupant Loans on < 5 Family Dwellings (A B C & D)
G) Loans On Manufactured Home Dwelling (A B C & D)
Number
Average Value
Number
Average Value
Number
Average Value
Number
Average Value
Number
Average Value
Number
Average Value
Number
Average Value
LOANS ORIGINATED
62
$160,902
397
$134,134
703
$171,067
57
$77,851
11
$1,052,091
78
$112,182
3
$50,757
APPLICATIONS APPROVED, NOT ACCEPTED
0
$0
33
$122,178
65
$163,793
0
$0
0
$0
4
$68,545
2
$31,635
APPLICATIONS DENIED
3
$101,000
27
$104,772
97
$140,730
15
$27,131
0
$0
10
$110,741
5
$22,782
APPLICATIONS WITHDRAWN
1
$143,000
18
$133,008
134
$193,682
4
$61,782
0
$0
5
$107,714
0
$0
FILES CLOSED FOR INCOMPLETENESS
2
$131,075
1
$160,000
17
$123,539
0
$0
0
$0
0
$0
0
$0
Aggregated Statistics For Year 2008 (Based on 3 full and 2 partial tracts)
A) FHA, FSA/RHS & VA Home Purchase Loans
B) Conventional Home Purchase Loans
C) Refinancings
D) Home Improvement Loans
E) Loans on Dwellings For 5+ Families
F) Non-occupant Loans on < 5 Family Dwellings (A B C & D)
G) Loans On Manufactured Home Dwelling (A B C & D)
Number
Average Value
Number
Average Value
Number
Average Value
Number
Average Value
Number
Average Value
Number
Average Value
Number
Average Value
LOANS ORIGINATED
26
$152,027
482
$157,627
369
$162,423
49
$37,106
15
$465,129
98
$129,891
3
$16,000
APPLICATIONS APPROVED, NOT ACCEPTED
2
$97,330
40
$159,885
44
$162,430
5
$71,488
2
$48,190
5
$147,524
1
$27,000
APPLICATIONS DENIED
7
$141,159
28
$118,213
53
$171,624
16
$104,165
0
$0
7
$136,960
6
$45,263
APPLICATIONS WITHDRAWN
0
$0
20
$165,752
54
$166,495
2
$30,010
0
$0
6
$78,780
0
$0
FILES CLOSED FOR INCOMPLETENESS
0
$0
0
$0
4
$220,325
0
$0
0
$0
0
$0
0
$0
Aggregated Statistics For Year 2007 (Based on 3 full and 2 partial tracts)
A) FHA, FSA/RHS & VA Home Purchase Loans
B) Conventional Home Purchase Loans
C) Refinancings
D) Home Improvement Loans
E) Loans on Dwellings For 5+ Families
F) Non-occupant Loans on < 5 Family Dwellings (A B C & D)
G) Loans On Manufactured Home Dwelling (A B C & D)
Number
Average Value
Number
Average Value
Number
Average Value
Number
Average Value
Number
Average Value
Number
Average Value
Number
Average Value
LOANS ORIGINATED
5
$140,706
582
$148,264
235
$124,630
37
$39,814
5
$398,626
81
$114,776
4
$35,282
APPLICATIONS APPROVED, NOT ACCEPTED
2
$109,500
68
$119,780
49
$107,972
3
$9,667
0
$0
10
$77,732
2
$32,445
APPLICATIONS DENIED
0
$0
44
$153,346
61
$124,137
9
$30,752
0
$0
5
$161,260
5
$33,204
APPLICATIONS WITHDRAWN
5
$118,828
23
$158,879
50
$167,719
0
$0
0
$0
9
$96,092
0
$0
FILES CLOSED FOR INCOMPLETENESS
0
$0
3
$75,183
13
$149,573
0
$0
0
$0
2
$115,985
0
$0
Aggregated Statistics For Year 2006 (Based on 3 full and 2 partial tracts)
A) FHA, FSA/RHS & VA Home Purchase Loans
B) Conventional Home Purchase Loans
C) Refinancings
D) Home Improvement Loans
E) Loans on Dwellings For 5+ Families
F) Non-occupant Loans on < 5 Family Dwellings (A B C & D)
G) Loans On Manufactured Home Dwelling (A B C & D)
Number
Average Value
Number
Average Value
Number
Average Value
Number
Average Value
Number
Average Value
Number
Average Value
Number
Average Value
LOANS ORIGINATED
27
$146,691
587
$129,561
218
$115,102
53
$28,070
6
$640,622
99
$124,672
6
$11,285
APPLICATIONS APPROVED, NOT ACCEPTED
2
$111,800
63
$153,139
53
$103,329
7
$49,313
0
$0
17
$150,906
0
$0
APPLICATIONS DENIED
2
$111,800
34
$126,994
100
$133,051
12
$20,962
0
$0
16
$178,320
3
$21,310
APPLICATIONS WITHDRAWN
2
$66,510
36
$95,255
47
$125,812
4
$60,820
0
$0
6
$60,473
2
$21,900
FILES CLOSED FOR INCOMPLETENESS
0
$0
7
$116,243
21
$127,386
0
$0
0
$0
1
$57,000
0
$0
Aggregated Statistics For Year 2005 (Based on 3 full and 2 partial tracts)
A) FHA, FSA/RHS & VA Home Purchase Loans
B) Conventional Home Purchase Loans
C) Refinancings
D) Home Improvement Loans
E) Loans on Dwellings For 5+ Families
F) Non-occupant Loans on < 5 Family Dwellings (A B C & D)
G) Loans On Manufactured Home Dwelling (A B C & D)
Number
Average Value
Number
Average Value
Number
Average Value
Number
Average Value
Number
Average Value
Number
Average Value
Number
Average Value
LOANS ORIGINATED
8
$147,775
699
$126,098
358
$136,807
43
$31,788
20
$739,817
100
$109,666
3
$17,453
APPLICATIONS APPROVED, NOT ACCEPTED
0
$0
66
$101,109
59
$151,330
3
$44,970
0
$0
7
$103,289
6
$34,952
APPLICATIONS DENIED
2
$189,795
39
$107,215
103
$135,486
13
$51,947
0
$0
3
$79,303
8
$17,730
APPLICATIONS WITHDRAWN
1
$140,000
55
$127,670
67
$137,325
7
$75,030
0
$0
12
$136,233
0
$0
FILES CLOSED FOR INCOMPLETENESS
0
$0
8
$123,925
20
$189,347
0
$0
0
$0
2
$78,070
0
$0
Aggregated Statistics For Year 2004 (Based on 3 full and 2 partial tracts)
A) FHA, FSA/RHS & VA Home Purchase Loans
B) Conventional Home Purchase Loans
C) Refinancings
D) Home Improvement Loans
E) Loans on Dwellings For 5+ Families
F) Non-occupant Loans on < 5 Family Dwellings (A B C & D)
G) Loans On Manufactured Home Dwelling (A B C & D)
Number
Average Value
Number
Average Value
Number
Average Value
Number
Average Value
Number
Average Value
Number
Average Value
Number
Average Value
LOANS ORIGINATED
8
$114,105
759
$120,248
489
$136,013
55
$30,117
15
$839,456
155
$148,796
7
$13,473
APPLICATIONS APPROVED, NOT ACCEPTED
2
$134,000
86
$112,430
53
$127,776
3
$31,490
0
$0
12
$95,292
3
$33,667
APPLICATIONS DENIED
2
$133,000
44
$99,984
103
$112,094
10
$33,001
0
$0
6
$107,000
18
$27,856
APPLICATIONS WITHDRAWN
5
$136,888
46
$122,098
79
$134,297
0
$0
0
$0
3
$133,740
0
$0
FILES CLOSED FOR INCOMPLETENESS
0
$0
10
$131,907
34
$119,707
4
$38,222
0
$0
0
$0
0
$0
Aggregated Statistics For Year 2003 (Based on 3 full and 2 partial tracts)
A) FHA, FSA/RHS & VA Home Purchase Loans
B) Conventional Home Purchase Loans
C) Refinancings
D) Home Improvement Loans
E) Loans on Dwellings For 5+ Families
F) Non-occupant Loans on < 5 Family Dwellings (A B C & D)
Number
Average Value
Number
Average Value
Number
Average Value
Number
Average Value
Number
Average Value
Number
Average Value
LOANS ORIGINATED
13
$117,161
781
$114,090
1,322
$138,072
78
$22,254
15
$568,635
150
$112,122
APPLICATIONS APPROVED, NOT ACCEPTED
6
$92,058
51
$120,717
77
$120,667
10
$25,893
2
$653,745
6
$128,358
APPLICATIONS DENIED
0
$0
45
$100,178
155
$111,033
4
$74,002
0
$0
16
$87,097
APPLICATIONS WITHDRAWN
5
$102,972
40
$140,255
125
$126,893
3
$64,963
0
$0
5
$89,064
FILES CLOSED FOR INCOMPLETENESS
0
$0
15
$137,650
21
$155,782
0
$0
0
$0
1
$105,000
Aggregated Statistics For Year 2002 (Based on 3 full and 2 partial tracts)
A) FHA, FSA/RHS & VA Home Purchase Loans
B) Conventional Home Purchase Loans
C) Refinancings
D) Home Improvement Loans
E) Loans on Dwellings For 5+ Families
F) Non-occupant Loans on < 5 Family Dwellings (A B C & D)
Number
Average Value
Number
Average Value
Number
Average Value
Number
Average Value
Number
Average Value
Number
Average Value
LOANS ORIGINATED
19
$107,102
765
$121,248
724
$135,406
41
$17,961
5
$340,984
107
$97,144
APPLICATIONS APPROVED, NOT ACCEPTED
0
$0
61
$78,856
44
$118,930
5
$12,928
0
$0
3
$101,117
APPLICATIONS DENIED
0
$0
90
$60,318
62
$111,124
11
$12,378
0
$0
3
$57,260
APPLICATIONS WITHDRAWN
1
$112,000
45
$96,918
76
$116,055
8
$55,764
0
$0
4
$85,448
FILES CLOSED FOR INCOMPLETENESS
0
$0
8
$74,188
13
$130,710
0
$0
0
$0
0
$0
Aggregated Statistics For Year 2001 (Based on 3 full and 2 partial tracts)
A) FHA, FSA/RHS & VA Home Purchase Loans
B) Conventional Home Purchase Loans
C) Refinancings
D) Home Improvement Loans
E) Loans on Dwellings For 5+ Families
F) Non-occupant Loans on < 5 Family Dwellings (A B C & D)
Number
Average Value
Number
Average Value
Number
Average Value
Number
Average Value
Number
Average Value
Number
Average Value
LOANS ORIGINATED
28
$121,103
646
$110,403
570
$124,976
76
$23,721
25
$400,385
87
$75,105
APPLICATIONS APPROVED, NOT ACCEPTED
0
$0
66
$81,236
44
$102,279
1
$18,000
2
$443,350
3
$67,050
APPLICATIONS DENIED
0
$0
99
$62,825
67
$104,237
8
$6,531
0
$0
8
$120,804
APPLICATIONS WITHDRAWN
1
$134,000
53
$118,752
62
$118,123
5
$15,990
0
$0
8
$76,422
FILES CLOSED FOR INCOMPLETENESS
0
$0
5
$122,962
21
$79,116
0
$0
0
$0
0
$0
Aggregated Statistics For Year 2000 (Based on 3 full and 2 partial tracts)
A) FHA, FSA/RHS & VA Home Purchase Loans
B) Conventional Home Purchase Loans
C) Refinancings
D) Home Improvement Loans
E) Loans on Dwellings For 5+ Families
F) Non-occupant Loans on < 5 Family Dwellings (A B C & D)
Number
Average Value
Number
Average Value
Number
Average Value
Number
Average Value
Number
Average Value
Number
Average Value
LOANS ORIGINATED
20
$106,418
550
$111,995
137
$107,616
45
$17,000
12
$450,396
40
$76,435
APPLICATIONS APPROVED, NOT ACCEPTED
2
$71,320
45
$70,138
19
$76,628
4
$9,610
0
$0
2
$47,045
APPLICATIONS DENIED
2
$113,555
91
$39,125
35
$82,651
6
$7,850
0
$0
3
$12,030
APPLICATIONS WITHDRAWN
3
$75,177
21
$84,396
26
$114,565
0
$0
0
$0
3
$46,797
FILES CLOSED FOR INCOMPLETENESS
0
$0
0
$0
10
$139,705
0
$0
0
$0
0
$0
Aggregated Statistics For Year 1999 (Based on 1 full and 2 partial tracts)
A) FHA, FSA/RHS & VA Home Purchase Loans
B) Conventional Home Purchase Loans
C) Refinancings
D) Home Improvement Loans
E) Loans on Dwellings For 5+ Families
F) Non-occupant Loans on < 5 Family Dwellings (A B C & D)
2002 - 2018 National Fire Incident Reporting System (NFIRS) incidents
Based on the data from the years 2002 - 2018 the average number of fire incidents per year is 48. The highest number of fires - 85 took place in 2003, and the least - 0 in 2007. The data has a rising trend.
When looking into fire subcategories, the most reports belonged to: Structure Fires (53.8%), and Outside Fires (24.0%).
Fire incident types reported to NFIRS in Zip Code 52241


 Nearest zip codes: 52246, 52242, 52317, 52340, 52245, 52240.


 Based on the data from the years 2002 - 2018 the average number of fire incidents per year is 48. The highest number of fires - 85 took place in 2003, and the least - 0 in 2007. The data has a rising trend.
 When looking into fire subcategories, the most reports belonged to: Structure Fires (53.8%), and Outside Fires (24.0%).