Salem, New Hampshire (NH) Poverty Rate Data
Information about poor and low-income residents

Recent posts about poverty in Salem, New Hampshire on our local forum with over 2,400,000 registered users:
 | income tax alert - HB628 (48 replies) |
| Why Isn't NH Population Booming? (110 replies) |
| Dependence on Massachusetts Post-Pandemic (19 replies) |
| Manchester NH a "city" of vacant shops, vacant stores, overpriced housing and run down infrastructure. (20 replies) |
| Hampton 104-acre project pitch: 400 apartments, 34 townhouses, retail and restaurants (33 replies) |
| Salem vs Windham (8 replies) |
Latest news about poverty in Salem, NH collected exclusively by city-data.com from local newspapers, TV, and radio stations
4.8% of Salem, NH residents had an income below the poverty level in 2022, which was 50.7% less than the poverty level of 7.2% across the entire state of New Hampshire. Taking into account residents not living in families, 7.1% of high school graduates and 24.0% of non high school graduates live in poverty. The poverty rate was 4.3% among disabled males and 12.3% among disabled females. The renting rate among poor residents was 50.1%. For comparison, it was 20.6% among residents with income above the poverty level.
Poverty rates in Salem, NH
Residents with income below the poverty level in 2022:
Residents with income below 50% of the poverty level in 2022:
Poverty rate among disabled males:
Poverty rate among disabled females:
Renting rate in this town among poor and not poor residents:
| Salem: | 4.8% |
| Whole state: | 7.2% |
| Salem: | 1.8% |
| Whole state: | 3.5% |
Poverty rate among disabled males:
| Salem: | 4.3% |
| New Hampshire: | 9.6% |
Disability rate in this town among poor males (it is 17.1% among male residents who are not classified as poor):
| Salem: | 26.7% |
| New Hampshire: | 31.9% |
Poverty rate among disabled females:
| Salem: | 12.3% |
| New Hampshire: | 14.1% |
Disability rate in this town among poor females (it is 14.6% among female residents who are not classified as poor):
| Salem: | 36.2% |
| New Hampshire: | 31.7% |
Renting rate in this town among poor and not poor residents:
| Residents below poverty level: | 50.1% |
| Residents above poverty level: | 20.6% |
Poverty by age in Salem, NH
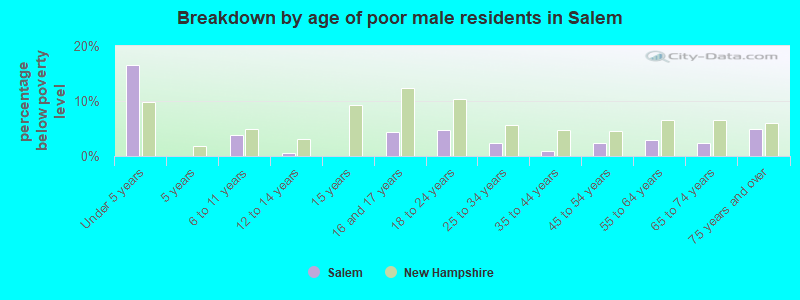
- Breakdown by age of poor male residents in Salem,NH (percentage below poverty level)
- 16.6%Under 5 years
- 0.0%5 years
- 3.8%6 to 11 years
- 0.6%12 to 14 years
- 0.0%15 years
- 4.4%16 and 17 years
- 4.7%18 to 24 years
- 2.4%25 to 34 years
- 0.9%35 to 44 years
- 2.3%45 to 54 years
- 3.0%55 to 64 years
- 2.4%65 to 74 years
- 4.9%75 years and over
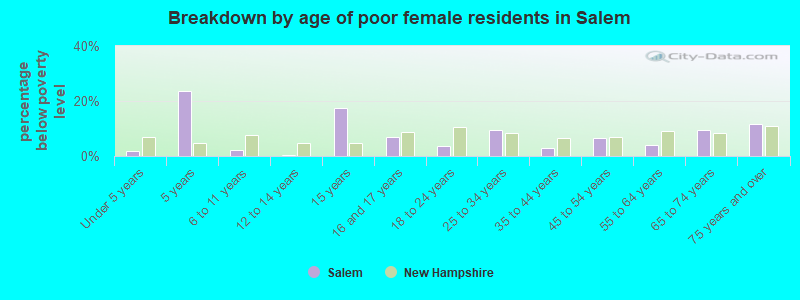
- Breakdown by age of poor female residents in Salem,NH (percentage below poverty level)
- 1.9%Under 5 years
- 23.8%5 years
- 2.3%6 to 11 years
- 0.2%12 to 14 years
- 17.6%15 years
- 7.0%16 and 17 years
- 3.7%18 to 24 years
- 9.5%25 to 34 years
- 2.9%35 to 44 years
- 6.4%45 to 54 years
- 3.9%55 to 64 years
- 9.5%65 to 74 years
- 11.8%75 years and over
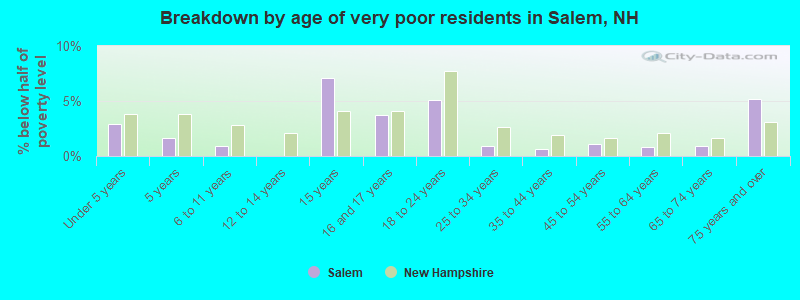
- Breakdown by age of very poor residents in Salem,NH (% below half of poverty level)
- 2.9%Under 5 years
- 1.7%5 years
- 0.9%6 to 11 years
- 0.0%12 to 14 years
- 7.1%15 years
- 3.8%16 and 17 years
- 5.1%18 to 24 years
- 0.9%25 to 34 years
- 0.7%35 to 44 years
- 1.1%45 to 54 years
- 0.8%55 to 64 years
- 0.9%65 to 74 years
- 5.1%75 years and over
Poverty by race and place of birth in Salem, NH
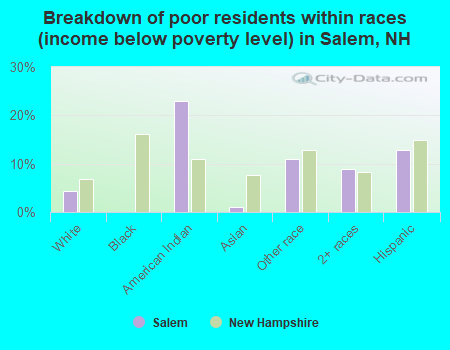
- Breakdown of poor residents within races in Salem, NH (%)
- 4.3%White
- 0.0%Black
- 23.0%American Indian
- 1.1%Asian
- 11.0%Other race
- 8.9%2+ races
- 12.9%Hispanic
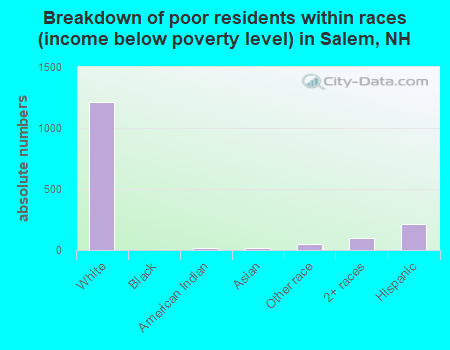
- Breakdown of poor residents within races in Salem, NH (absolute numbers)
- 1,214White
- 0Black
- 18American Indian
- 17Asian
- 47Other race
- 962+ races
- 216Hispanic
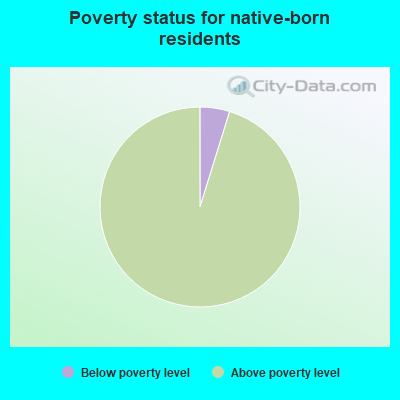
- 4.8%Below poverty level
- 95.2%Above poverty level
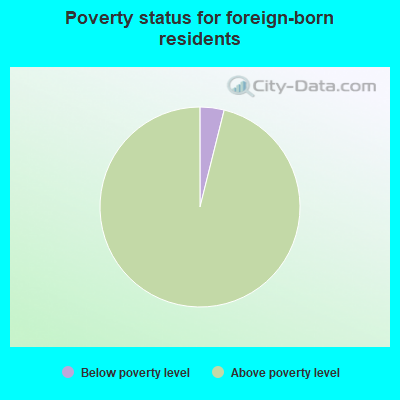
- 3.9%Below poverty level
- 96.1%Above poverty level
Poverty in families in Salem, NH
Children below poverty level:
| Salem, New Hampshire: | 4.3% |
| State: | 6.3% |
Poverty rate among high school graduates not in families:
| Salem: | 7.1% |
| New Hampshire: | 13.3% |
Poverty rate among people who did not graduate high school not in families:
| Salem: | 24.0% |
| New Hampshire: | 32.2% |
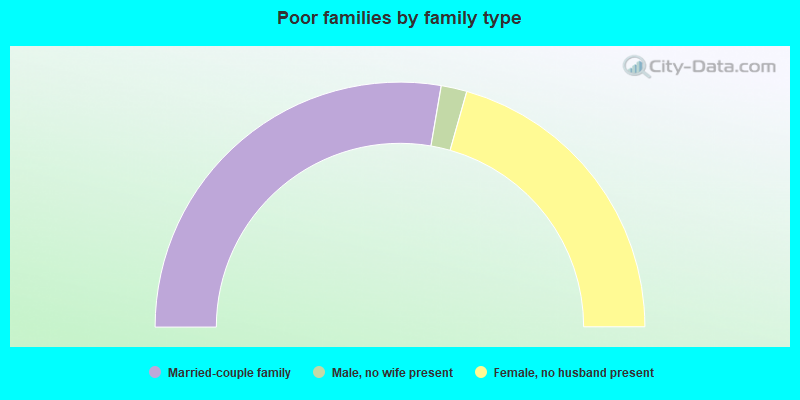
- 55.4%Married-couple family
- 3.4%Male, no wife present
- 41.2%Female, no husband present
Other data
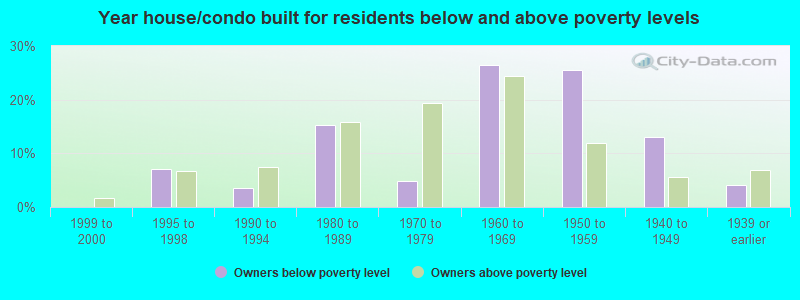
- Owners below poverty level
- 0.0%1999 to 2000
- 7.2%1995 to 1998
- 3.6%1990 to 1994
- 15.2%1980 to 1989
- 4.9%1970 to 1979
- 26.5%1960 to 1969
- 25.6%1950 to 1959
- 13.0%1940 to 1949
- 4.0%1939 or earlier
- Owners above poverty level
- 1.8%1999 to 2000
- 6.7%1995 to 1998
- 7.4%1990 to 1994
- 15.9%1980 to 1989
- 19.4%1970 to 1979
- 24.4%1960 to 1969
- 12.0%1950 to 1959
- 5.6%1940 to 1949
- 6.8%1939 or earlier