Races in Albany, New York (NY) Detailed Stats
Data:
Races - White alone (%)
Races - White alone (% change since 2000)
Races - Black alone (%)
Races - Black alone (% change since 2000)
Races - American Indian alone (%)
Races - American Indian alone (% change since 2000)
Races - Asian alone (%)
Races - Asian alone (% change since 2000)
Races - Hispanic (%)
Races - Hispanic (% change since 2000)
Races - Native Hawaiian and Other Pacific Islander alone (%)
Races - Native Hawaiian and Other Pacific Islander alone (% change since 2000)
Races - Two or more races(%)
Races - Two or more races(% change since 2000)
Races - Other race alone (%)
Races - Other race alone (% change since 2000)
Racial diversity
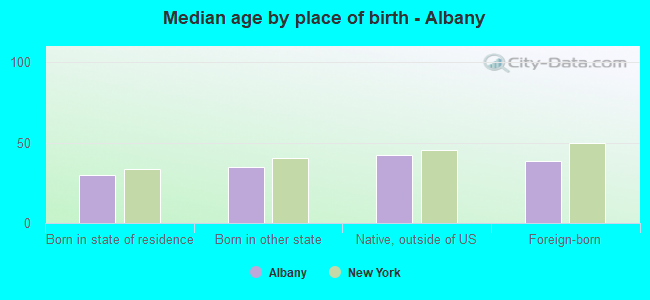
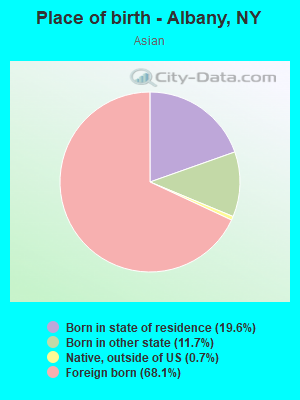
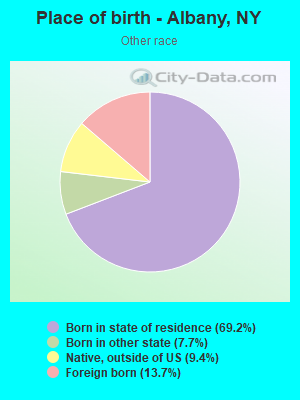
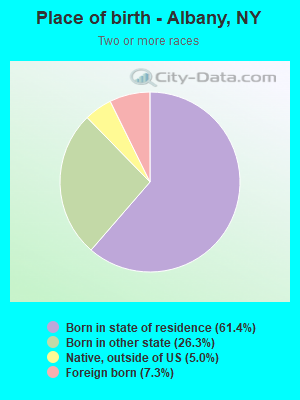
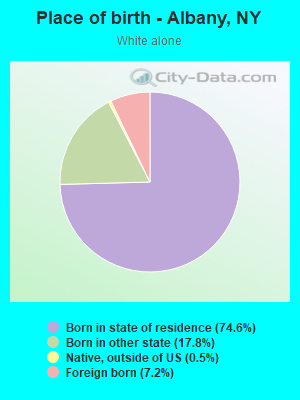
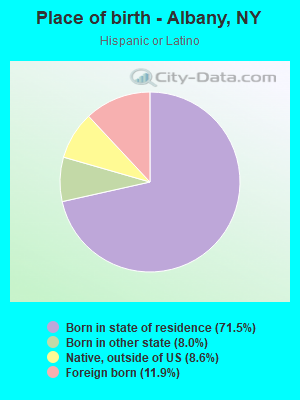
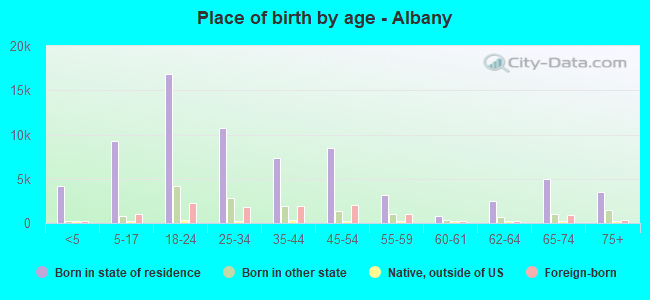
Place of birth - Born in state of residence (%)
Place of birth - Born in state of residence (%) - White
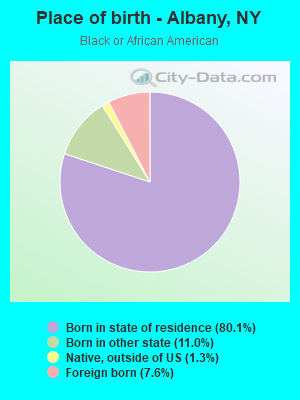
Place of birth - Born in state of residence (%) - Black or African American
Place of birth - Born in state of residence (%) - Asian
Place of birth - Born in state of residence (%) - Hispanic or Latino
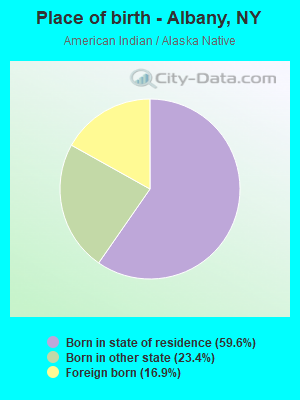
Place of birth - Born in state of residence (%) - American Indian and Alaska Native
Place of birth - Born in state of residence (%) - Multirace
Place of birth - Born in state of residence (%) - Other Race
Place of birth - Born in other state (%)
Place of birth - Born in other state (%) - White
Place of birth - Born in other state (%) - Black or African American
Place of birth - Born in other state (%) - Asian
Place of birth - Born in other state (%) - Hispanic or Latino
Place of birth - Born in other state (%) - American Indian and Alaska Native
Place of birth - Born in other state (%) - Multirace
Place of birth - Born in other state (%) - Other Race
Place of birth - Native, outside of US (%)
Place of birth - Native, outside of US (%) - White
Place of birth - Native, outside of US (%) - Black or African American
Place of birth - Native, outside of US (%) - Asian
Place of birth - Native, outside of US (%) - Hispanic or Latino
Place of birth - Native, outside of US (%) - American Indian and Alaska Native
Place of birth - Native, outside of US (%) - Multirace
Place of birth - Native, outside of US (%) - Other Race
Place of birth - Foreign born (%)
Place of birth - Foreign born (%) - White
Place of birth - Foreign born (%) - Black or African American
Place of birth - Foreign born (%) - Asian
Place of birth - Foreign born (%) - Hispanic or Latino
Place of birth - Foreign born (%) - American Indian and Alaska Native
Place of birth - Foreign born (%) - Multirace
Place of birth - Foreign born (%) - Other Race
Residents speaking English at home (%)
Residents speaking English at home - Born in the United States (%)
Residents speaking English at home - Native, born elsewhere (%)
Residents speaking English at home - Foreign born (%)
Residents speaking Spanish at home (%)
Residents speaking Spanish at home - Born in the United States (%)
Residents speaking Spanish at home - Native, born elsewhere (%)
Residents speaking Spanish at home - Foreign born (%)
Residents speaking other language at home (%)
Residents speaking other language at home - Born in the United States (%)
Residents speaking other language at home - Native, born elsewhere (%)
Residents speaking other language at home - Foreign born (%)
Marital status - Never married (%)
Marital status - Now married (%)
Marital status - Separated (%)
Marital status - Widowed (%)
Marital status - Divorced (%)
Ancestries Reported - Arab (%)
Ancestries Reported - Czech (%)
Ancestries Reported - Danish (%)
Ancestries Reported - Dutch (%)
Ancestries Reported - English (%)
Ancestries Reported - French (%)
Ancestries Reported - French Canadian (%)
Ancestries Reported - German (%)
Ancestries Reported - Greek (%)
Ancestries Reported - Hungarian (%)
Ancestries Reported - Irish (%)
Ancestries Reported - Italian (%)
Ancestries Reported - Lithuanian (%)
Ancestries Reported - Norwegian (%)
Ancestries Reported - Polish (%)
Ancestries Reported - Portuguese (%)
Ancestries Reported - Russian (%)
Ancestries Reported - Scotch-Irish (%)
Ancestries Reported - Scottish (%)
Ancestries Reported - Slovak (%)
Ancestries Reported - Subsaharan African (%)
Ancestries Reported - Swedish (%)
Ancestries Reported - Swiss (%)
Ancestries Reported - Ukrainian (%)
Ancestries Reported - United States (%)
Ancestries Reported - Welsh (%)
Ancestries Reported - West Indian (%)
Ancestries Reported - Other (%)
Geographical mobility - Same house 1 year ago (%)
Geographical mobility - Same house 1 year ago (%) - White
Geographical mobility - Same house 1 year ago (%) - Black or African American
Geographical mobility - Same house 1 year ago (%) - Asian
Geographical mobility - Same house 1 year ago (%) - Hispanic or Latino
Geographical mobility - Same house 1 year ago (%) - American Indian and Alaska Native
Geographical mobility - Same house 1 year ago (%) - Multirace
Geographical mobility - Same house 1 year ago (%) - Other Race
Geographical mobility - Moved within same county (%)
Geographical mobility - Moved within same county (%) - White
Geographical mobility - Moved within same county (%) - Black or African American
Geographical mobility - Moved within same county (%) - Asian
Geographical mobility - Moved within same county (%) - Hispanic or Latino
Geographical mobility - Moved within same county (%) - American Indian and Alaska Native
Geographical mobility - Moved within same county (%) - Multirace
Geographical mobility - Moved within same county (%) - Other Race
Geographical mobility - Moved from different county within same state (%)
Geographical mobility - Moved from different county within same state (%) - White
Geographical mobility - Moved from different county within same state (%) - Black or African American
Geographical mobility - Moved from different county within same state (%) - Asian
Geographical mobility - Moved from different county within same state (%) - Hispanic or Latino
Geographical mobility - Moved from different county within same state (%) - American Indian and Alaska Native
Geographical mobility - Moved from different county within same state (%) - Multirace
Geographical mobility - Moved from different county within same state (%) - Other Race
Geographical mobility - Moved from different state (%)
Geographical mobility - Moved from different state (%) - White
Geographical mobility - Moved from different state (%) - Black or African American
Geographical mobility - Moved from different state (%) - Asian
Geographical mobility - Moved from different state (%) - Hispanic or Latino
Geographical mobility - Moved from different state (%) - American Indian and Alaska Native
Geographical mobility - Moved from different state (%) - Multirace
Geographical mobility - Moved from different state (%) - Other Race
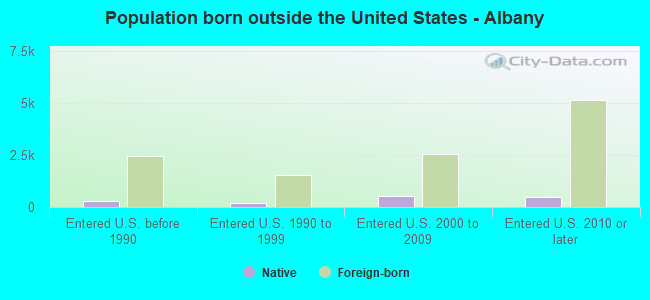
Geographical mobility - Moved from abroad (%)
Geographical mobility - Moved from abroad (%) - White
Geographical mobility - Moved from abroad (%) - Black or African American
Geographical mobility - Moved from abroad (%) - Asian
Geographical mobility - Moved from abroad (%) - Hispanic or Latino
Geographical mobility - Moved from abroad (%) - American Indian and Alaska Native
Geographical mobility - Moved from abroad (%) - Multirace
Geographical mobility - Moved from abroad (%) - Other Race
Place of birth for the foreign-born population - Ireland (%)
Place of birth for the foreign-born population - Denmark (%)
Place of birth for the foreign-born population - Norway (%)
Place of birth for the foreign-born population - Sweden (%)
Place of birth for the foreign-born population - United Kingdom (%)
Place of birth for the foreign-born population - England (%)
Place of birth for the foreign-born population - Scotland (%)
Place of birth for the foreign-born population - Other Northern Europe (%)
Place of birth for the foreign-born population - Austria (%)
Place of birth for the foreign-born population - Belgium (%)
Place of birth for the foreign-born population - France (%)
Place of birth for the foreign-born population - Germany (%)
Place of birth for the foreign-born population - Netherlands (%)
Place of birth for the foreign-born population - Switzerland (%)
Place of birth for the foreign-born population - Other Western Europe (%)
Place of birth for the foreign-born population - Greece (%)
Place of birth for the foreign-born population - Italy (%)
Place of birth for the foreign-born population - Portugal (%)
Place of birth for the foreign-born population - Spain (%)
Place of birth for the foreign-born population - Other Southern Europe (%)
Place of birth for the foreign-born population - Albania (%)
Place of birth for the foreign-born population - Belarus (%)
Place of birth for the foreign-born population - Bosnia and Herzegovina (%)
Place of birth for the foreign-born population - Bulgaria (%)
Place of birth for the foreign-born population - Croatia (%)
Place of birth for the foreign-born population - Czechoslovakia (%)
Place of birth for the foreign-born population - Hungary (%)
Place of birth for the foreign-born population - Latvia (%)
Place of birth for the foreign-born population - Lithuania (%)
Place of birth for the foreign-born population - North Macedonia (Macedonia) (%)
Place of birth for the foreign-born population - Moldova (%)
Place of birth for the foreign-born population - Poland (%)
Place of birth for the foreign-born population - Romania (%)
Place of birth for the foreign-born population - Russia (%)
Place of birth for the foreign-born population - Serbia (%)
Place of birth for the foreign-born population - Ukraine (%)
Place of birth for the foreign-born population - Other Eastern Europe (%)
Place of birth for the foreign-born population - China (%)
Place of birth for the foreign-born population - Hong Kong (%)
Place of birth for the foreign-born population - Taiwan (%)
Place of birth for the foreign-born population - Japan (%)
Place of birth for the foreign-born population - Korea (%)
Place of birth for the foreign-born population - Other Eastern Asia (%)
Place of birth for the foreign-born population - Afghanistan (%)
Place of birth for the foreign-born population - Bangladesh (%)
Place of birth for the foreign-born population - India (%)
Place of birth for the foreign-born population - Iran (%)
Place of birth for the foreign-born population - Kazakhstan (%)
Place of birth for the foreign-born population - Nepal (%)
Place of birth for the foreign-born population - Pakistan (%)
Place of birth for the foreign-born population - Sri Lanka (%)
Place of birth for the foreign-born population - Uzbekistan (%)
Place of birth for the foreign-born population - Other South Central Asia (%)
Place of birth for the foreign-born population - Burma (%)
Place of birth for the foreign-born population - Cambodia (%)
Place of birth for the foreign-born population - Indonesia (%)
Place of birth for the foreign-born population - Laos (%)
Place of birth for the foreign-born population - Malaysia (%)
Place of birth for the foreign-born population - Philippines (%)
Place of birth for the foreign-born population - Singapore (%)
Place of birth for the foreign-born population - Thailand (%)
Place of birth for the foreign-born population - Vietnam (%)
Place of birth for the foreign-born population - Other South Eastern Asia (%)
Place of birth for the foreign-born population - Armenia (%)
Place of birth for the foreign-born population - Iraq (%)
Place of birth for the foreign-born population - Israel (%)
Place of birth for the foreign-born population - Jordan (%)
Place of birth for the foreign-born population - Kuwait (%)
Place of birth for the foreign-born population - Lebanon (%)
Place of birth for the foreign-born population - Saudi Arabia (%)
Place of birth for the foreign-born population - Syria (%)
Place of birth for the foreign-born population - Turkey (%)
Place of birth for the foreign-born population - Yemen (%)
Place of birth for the foreign-born population - Other Western Asia (%)
Place of birth for the foreign-born population - Eritrea (%)
Place of birth for the foreign-born population - Ethiopia (%)
Place of birth for the foreign-born population - Kenya (%)
Place of birth for the foreign-born population - Somalia (%)
Place of birth for the foreign-born population - Uganda (%)
Place of birth for the foreign-born population - Zimbabwe (%)
Place of birth for the foreign-born population - Other Eastern Africa (%)
Place of birth for the foreign-born population - Cameroon (%)
Place of birth for the foreign-born population - Congo (%)
Place of birth for the foreign-born population - Democratic Republic of Congo (Zaire) (%)
Place of birth for the foreign-born population - Other Middle Africa (%)
Place of birth for the foreign-born population - Egypt (%)
Place of birth for the foreign-born population - Morocco (%)
Place of birth for the foreign-born population - Sudan (%)
Place of birth for the foreign-born population - Other Northern Africa (%)
Place of birth for the foreign-born population - South Africa (%)
Place of birth for the foreign-born population - Other Southern Africa (%)
Place of birth for the foreign-born population - Cabo Verde (%)
Place of birth for the foreign-born population - Ghana (%)
Place of birth for the foreign-born population - Liberia (%)
Place of birth for the foreign-born population - Nigeria (%)
Place of birth for the foreign-born population - Senegal (%)
Place of birth for the foreign-born population - Sierra Leone (%)
Place of birth for the foreign-born population - Other Western Africa (%)
Place of birth for the foreign-born population - Australia (%)
Place of birth for the foreign-born population - New Zealand (%)
Place of birth for the foreign-born population - Fiji (%)
Place of birth for the foreign-born population - Micronesia (%)
Place of birth for the foreign-born population - Bahamas (%)
Place of birth for the foreign-born population - Barbados (%)
Place of birth for the foreign-born population - Cuba (%)
Place of birth for the foreign-born population - Dominica (%)
Place of birth for the foreign-born population - Dominican Republic (%)
Place of birth for the foreign-born population - Grenada (%)
Place of birth for the foreign-born population - Haiti (%)
Place of birth for the foreign-born population - Jamaica (%)
Place of birth for the foreign-born population - St. Vincent and the Grenadines (%)
Place of birth for the foreign-born population - Trinidad and Tobago (%)
Place of birth for the foreign-born population - West Indies (%)
Place of birth for the foreign-born population - Other Caribbean (%)
Place of birth for the foreign-born population - Belize (%)
Place of birth for the foreign-born population - Costa Rica (%)
Place of birth for the foreign-born population - El Salvador (%)
Place of birth for the foreign-born population - Guatemala (%)
Place of birth for the foreign-born population - Honduras (%)
Place of birth for the foreign-born population - Mexico (%)
Place of birth for the foreign-born population - Nicaragua (%)
Place of birth for the foreign-born population - Panama (%)
Place of birth for the foreign-born population - Other Central America (%)
Place of birth for the foreign-born population - Argentina (%)
Place of birth for the foreign-born population - Bolivia (%)
Place of birth for the foreign-born population - Brazil (%)
Place of birth for the foreign-born population - Chile (%)
Place of birth for the foreign-born population - Colombia (%)
Place of birth for the foreign-born population - Ecuador (%)
Place of birth for the foreign-born population - Guyana (%)
Place of birth for the foreign-born population - Peru (%)
Place of birth for the foreign-born population - Uruguay (%)
Place of birth for the foreign-born population - Venezuela (%)
Place of birth for the foreign-born population - Other South America (%)
Place of birth for the foreign-born population - Canada (%)
Place of birth for the foreign-born population - Other Northern America (%)
Place of birth for the foreign-born population - Other (%)
Latest news about races in Albany, NY collected exclusively by city-data.com from local newspapers, TV, and radio stations
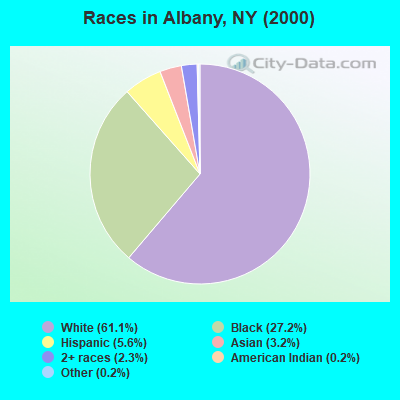
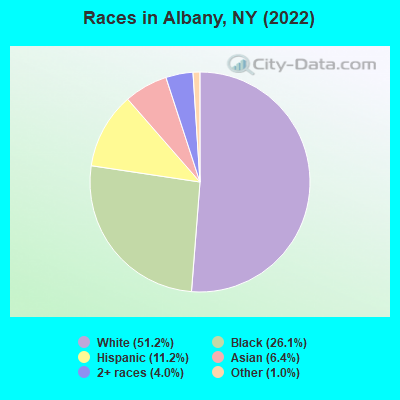
According to 2022 data, the most numerous races in Albany, NY are White alone (51,638 residents), Hispanic (11,273 residents), and Black alone (26,328 residents). 83.8% of Albany residents speak English at home. 14.6% of Albany, NY residents are foreign-born (5.8% born in Asia, 4.7% born in Latin America, 2.3% born in Europe, 1.6% born in Africa), which is 51.0% less than the foreign-born rate of 22.0% across the entire state of New York.
Race distribution in Albany
2000 2022
58,459 61.1% White alone 26,042 27.2% Black alone 5,349 5.6% Hispanic 3,089 3.2% Asian alone 2,242 2.3% Two or more races 217 0.2% Other race alone 233 0.2% American Indian alone 27 0.03% Native Hawaiian and Other
51,638 51.2% White alone 26,328 26.1% Black alone 11,273 11.2% Hispanic 6,457 6.4% Asian alone 3,995 4.0% Two or more races 1,054 1.0% Other race alone 87 0.09% American Indian alone
2000 2022
11,760,981 62.0% White alone 2,867,583 15.1% Hispanic 2,812,623 14.8% Black alone 1,035,926 5.5% Asian alone 366,116 1.9% Two or more races 75,499 0.4% Other race alone 52,499 0.3% American Indian alone 5,230 0.03% Native Hawaiian and Other
10,408,933 52.9% White alone 3,867,299 19.7% Hispanic 2,633,840 13.4% Black alone 1,776,286 9.0% Asian alone 732,670 3.7% Two or more races 216,110 1.1% Other race alone 35,082 0.2% American Indian alone 6,931 0.04% Native Hawaiian and Other
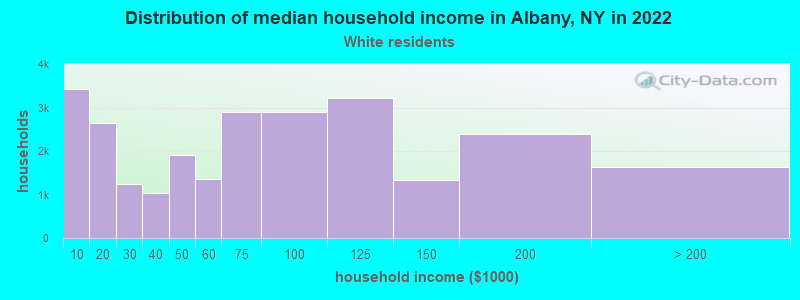
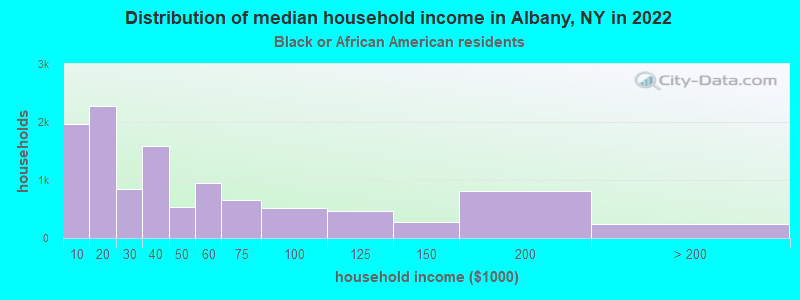
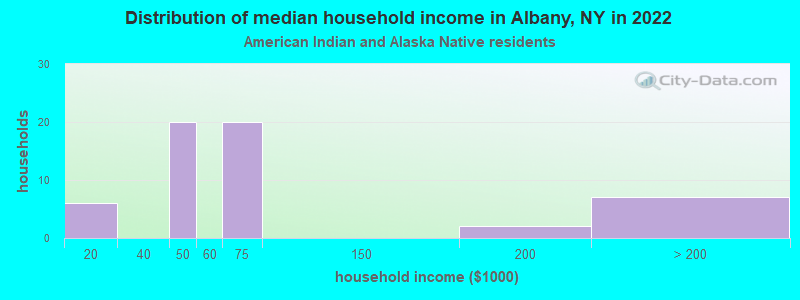
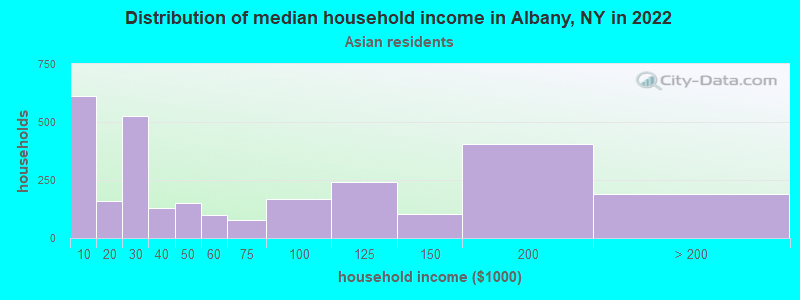
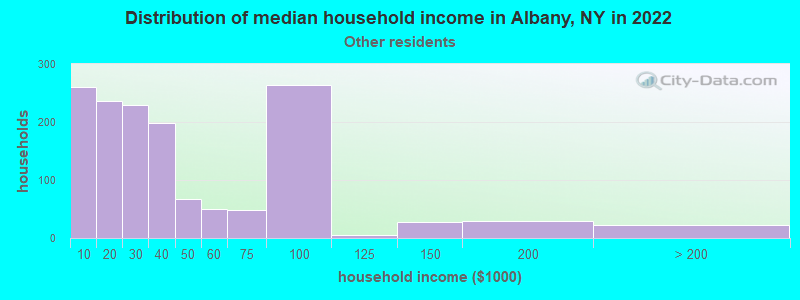
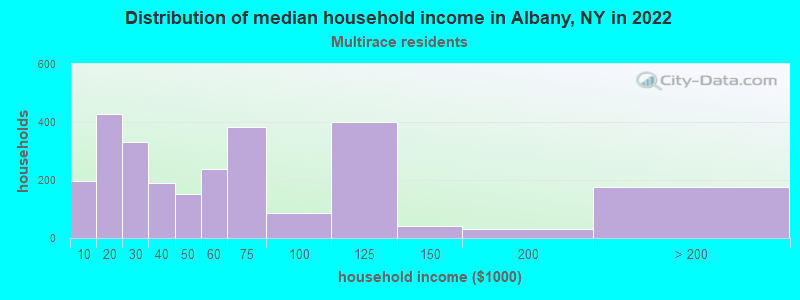
Income and house value in Albany Median household income in 2022 $65,499 White non-Hispanic householders$33,948 Black householders$47,516 American Indian and Alaska Native householders$24,310 Asian householders$29,159 Some other race householders$51,201 Two or more races householders$32,295 Hispanic or Latino race householdersMedian 2022 house value $229,305 White Non-Hispanic householders$178,475 Black or African American householders$172,321 American Indian or Alaska Native householders $305,665 Asian householders$205,144 Some other race householders$219,960 Two or more races householders$235,688 Hispanic or Latino householders
Median age by race in Albany
34.8 Median age for White residents34.8 34.9 30.7 Median age for Black or African American residents29.3 31.6 38.2 Median age for American Indian / Alaska Native residents36.9 -666,666,666.0 25.3 Median age for Asian residents29.0 24.5 -666,666,666.0 Median age for Native Hawaiian / Pacific Islander residents-666,666,666.0 -666,666,666.0 21.9 Median age for Other race residents21.0 24.2 24.0 Median age for Two or more races residents19.9 26.1 35.3 Median age for White alone residents34.8 35.6 24.8 Median age for Hispanic or Latino residents27.6 24.5
Owner/renter occupied households by race in Albany
House owners and renters - White residents 10,362 39.9% Owner occupied15,625 60.1% Renter occupiedHouse owners and renters - Black or African American residents 1,974 17.7% Owner occupied9,152 82.3% Renter occupiedHouse owners and renters - American Indian / Alaska Native residents 18 26.4% Owner occupied51 73.6% Renter occupiedHouse owners and renters - Asian residents 731 35.8% Owner occupied1,313 64.2% Renter occupiedHouse owners and renters - Native Hawaiian / Pacific Islander residents 22 100.0% Owner occupiedHouse owners and renters - Other race residents 223 14.1% Owner occupied1,355 85.9% Renter occupiedHouse owners and renters - Two or more races residents 974 45.2% Owner occupied1,179 54.8% Renter occupiedHouse owners and renters - White alone residents 10,322 40.6% Owner occupied15,131 59.4% Renter occupiedHouse owners and renters - Hispanic or Latino residents 670 17.6% Owner occupied3,131 82.4% Renter occupied
Language usage in Albany
English speakers - Total 83.8% of residents of Albany speak English at home.
7.9% of residents speak Spanish at home 4,453 58.9% Speak English very well3,111 41.1% Speak English less than very well8.3% of residents speak other language at home 5,886 73.5% Speak English very well2,117 26.5% Speak English less than very well
English speakers - Born in the United States 83.1% of residents of Albany speak English at home.
7.5% of residents speak Spanish at home 1,154 99.2% Speak English very well9 0.8% Speak English less than very well9.4% of residents speak other language at home 1,400 96.0% Speak English very well58 4.0% Speak English less than very well
English speakers - Native, born elsewhere 27.2% of residents of Albany speak English at home.
62.5% of residents speak Spanish at home 690 74.1% Speak English very well241 25.9% Speak English less than very well10.3% of residents speak other language at home 153 100.0% Speak English very well
English speakers - Foreign-born 44.0% of residents of Albany speak English at home.
11.1% of residents speak Spanish at home 612 47.7% Speak English very well672 52.3% Speak English less than very well44.9% of residents speak other language at home 3,258 62.8% Speak English very well1,928 37.2% Speak English less than very well
White (Caucasian) - Speak only English Native:
96.9% (46,425)Foreign-born:
39.9% (1,556)
White (Caucasian) - Speak another language Native:
3.1% (1,489)Foreign-born:
60.1% (2,339)
Black or African American - Speak only English Native:
91.8% (23,571)Foreign-born:
85.3% (1,869)
Black or African American - Speak another language Native:
8.2% (2,103)Foreign-born:
14.7% (321)
American Indian / Alaska Native - Speak only English Native:
26.4% (40)Foreign-born:
26.2% (9)
American Indian / Alaska Native - Speak another language Native:
79.8% (122)Foreign-born:
63.3% (21)
Asian - Speak only English Native:
51.2% (910)Foreign-born:
35.5% (1,493)
Asian - Speak another language Native:
48.8% (866)Foreign-born:
64.5% (2,707)
Other race - Speak only English Native:
48.0% (1,843)Foreign-born:
8.4% (69)
Other race - Speak another language Native:
50.7% (1,946)Foreign-born:
91.5% (753)
Two or more races - Speak only English Native:
82.3% (4,979)Foreign-born:
59.8% (569)
Two or more races - Speak another language Native:
19.2% (1,160)Foreign-born:
77.9% (741)
White alone - Speak only English Native:
97.7% (45,624)Foreign-born:
42.1% (1,556)
White alone - Speak another language Native:
2.3% (1,089)Foreign-born:
57.9% (2,140)
Hispanic or Latino - Speak only English Native:
51.6% (4,720)Foreign-born:
4.6% (62)
Hispanic or Latino - Speak another language Native:
48.4% (4,420)Foreign-born:
95.4% (1,284)
Foreign-born residents in Albany 14,560 residents are foreign born (5.8% Asia , 4.7% Latin America , 2.3% Europe , 1.6% Africa ).
This city:
14.6%New York:
22.6%
Marital status for residents in Albany Marital status - White (Caucasian) population 15 years and over
Males 63.0% Never married28.2% Now married1.4% Separated2.2% Widowed5.2% DivorcedFemales 54.8% Never married26.6% Now married0.3% Separated5.8% Widowed12.6% DivorcedWomen who gave birth in the past 12 months Now married:
56.9% (226)Unmarried:
43.1% (171)
Women who did not give birth in the past 12 months Now married:
19.1% (2,912)Unmarried:
80.9% (12,336)
Marital status - Black or African American population 15 years and over
Males 66.7% Never married19.0% Now married3.7% Separated2.2% Widowed8.4% DivorcedFemales 68.5% Never married9.3% Now married6.2% Separated5.7% Widowed10.2% DivorcedWomen who gave birth in the past 12 months Now married:
35.2% (94)Unmarried:
64.8% (173)
Women who did not give birth in the past 12 months Now married:
12.5% (956)Unmarried:
87.5% (6,721)
Marital status - American Indian / Alaska Native population 15 years and over
Males 37.5% Never married54.7% Now married0.0% Separated0.0% Widowed7.8% DivorcedFemales 88.1% Never married0.0% Now married0.0% Separated0.0% Widowed11.9% DivorcedWomen who did not give birth in the past 12 months Now married:
0.0% (0)Unmarried:
100.0% (84)
Marital status - Asian population 15 years and over
Males 51.0% Never married46.3% Now married0.0% Separated1.5% Widowed1.2% DivorcedFemales 45.9% Never married41.9% Now married0.0% Separated0.6% Widowed11.6% DivorcedWomen who gave birth in the past 12 months Now married:
100.0% (57)Unmarried:
0.0% (0)
Women who did not give birth in the past 12 months Now married:
33.2% (838)Unmarried:
66.8% (1,683)
Marital status - Other race population 15 years and over
Males 67.4% Never married21.3% Now married4.2% Separated0.9% Widowed6.1% DivorcedFemales 62.2% Never married19.3% Now married0.4% Separated5.4% Widowed12.7% DivorcedWomen who gave birth in the past 12 months Now married:
0.0% (0)Unmarried:
100.0% (49)
Women who did not give birth in the past 12 months Now married:
19.4% (227)Unmarried:
80.6% (942)
Marital status - Two or more races population 15 years and over
Males 74.7% Never married19.0% Now married1.9% Separated0.0% Widowed4.4% DivorcedFemales 62.0% Never married22.3% Now married2.5% Separated7.0% Widowed6.1% DivorcedWomen who gave birth in the past 12 months Now married:
82.2% (193)Unmarried:
17.8% (42)
Women who did not give birth in the past 12 months Now married:
22.3% (525)Unmarried:
77.7% (1,831)
Marital status - White alone, not Hispanic / Latino population 15 years and over
Males 63.6% Never married27.7% Now married1.2% Separated2.3% Widowed5.3% DivorcedFemales 54.7% Never married26.3% Now married0.3% Separated5.9% Widowed13.0% DivorcedWomen who gave birth in the past 12 months Now married:
56.9% (226)Unmarried:
43.1% (171)
Women who did not give birth in the past 12 months Now married:
18.6% (2,745)Unmarried:
81.4% (11,978)
Marital status - Hispanic or Latino population 15 years and over
Males 55.5% Never married39.0% Now married3.8% Separated0.0% Widowed1.6% DivorcedFemales 69.7% Never married20.8% Now married1.4% Separated2.9% Widowed5.3% DivorcedWomen who gave birth in the past 12 months Now married:
54.2% (181)Unmarried:
45.8% (153)
Women who did not give birth in the past 12 months Now married:
17.8% (617)Unmarried:
82.2% (2,855)
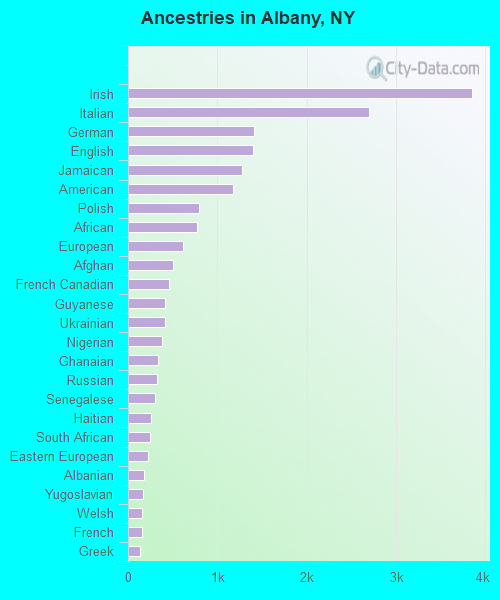
Ancestries in Albany
3,847 8.5% Irish2,697 6.0% Italian1,408 3.1% German1,396 3.1% English1,280 2.8% Jamaican1,180 2.6% American798 1.8% Polish774 1.7% African615 1.4% European502 1.1% Afghan463 1.0% French Canadian418 0.9% Guyanese413 0.9% Ukrainian384 0.9% Nigerian337 0.7% Ghanaian328 0.7% Russian299 0.7% Senegalese258 0.6% Haitian248 0.5% South African225 0.5% Eastern European179 0.4% Albanian170 0.4% Yugoslavian159 0.4% Welsh154 0.3% French133 0.3% Greek129 0.3% Scotch-Irish113 0.3% Hungarian110 0.2% Croatian100 0.2% Scandinavian100 0.2% Iraqi90 0.2% West Indian89 0.2% Trinidadian and Tobagonian80 0.2% Syrian72 0.2% Danish69 0.2% British65 0.1% Turkish64 0.1% German Russian63 0.1% Scottish54 0.1% Northern European45 0.10% Bulgarian45 0.10% Celtic42 0.09% Czech41 0.09% Brazilian38 0.08% Austrian36 0.08% Romanian36 0.08% Swedish34 0.08% Armenian33 0.07% Canadian30 0.07% Belgian30 0.07% Dutch28 0.06% Barbadian24 0.05% Israeli21 0.05% Portuguese21 0.05% Egyptian20 0.04% Finnish19 0.04% Sudanese18 0.04% Norwegian18 0.04% Slovak15 0.03% British West Indian8 0.02% Iranian7 0.02% Serbian6 0.01% Slovene6 0.01% Bahamian
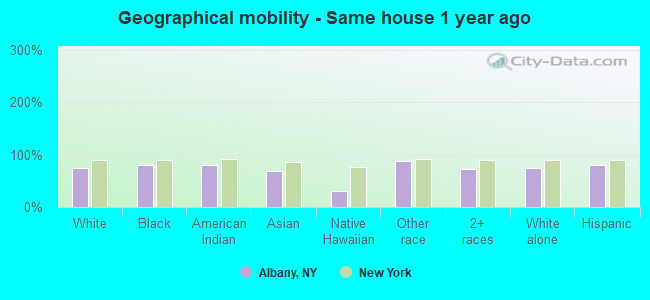
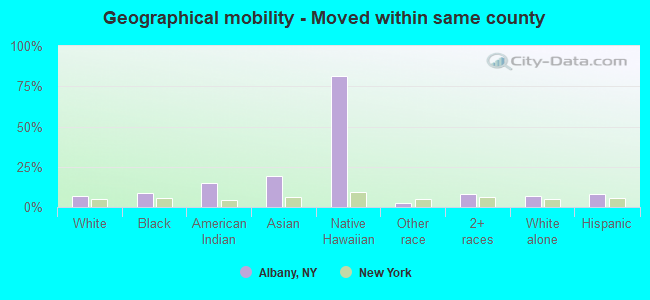
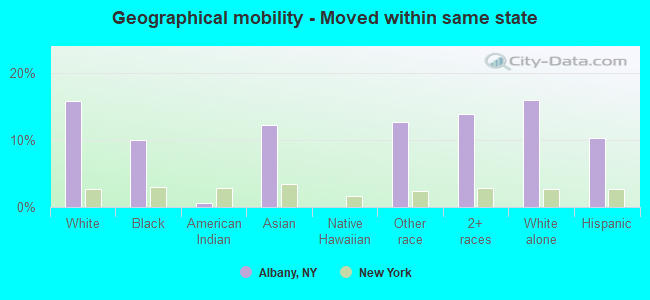
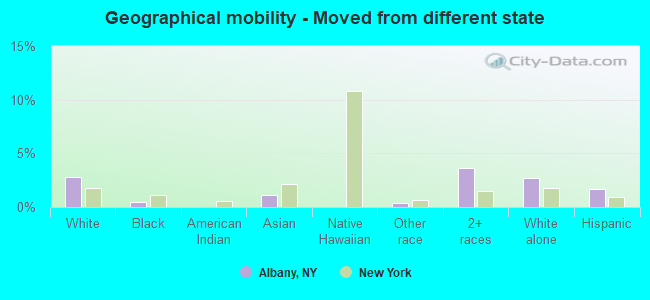
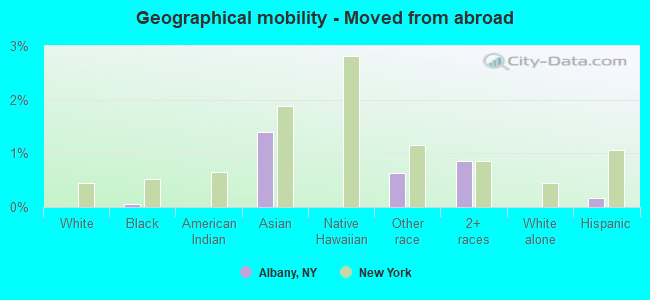
Geographical mobility in Albany Same house 1 year ago 39,321 74.6% White (Caucasian)23,406 80.8% Black or African American164 80.1% American Indian / Alaska Native5,266 69.0% Asian9 29.9% Native Hawaiian / Pacific Islander4,700 87.6% Other race5,460 72.7% Two or more races38,116 74.2% White alone, not Hispanic / Latino8,131 79.5% Hispanic or LatinoMoved within same county 3,606 6.8% White / Caucasian2,511 8.7% Black or African American30 14.6% American Indian / Alaska Native1,493 19.6% Asian24 81.5% Native Hawaiian / Pacific Islander140 2.6% Other race598 8.0% Two or more races3,606 7.0% White alone, not Hispanic / Latino844 8.3% Hispanic or LatinoMoved within same state 8,351 15.8% White / Caucasian2,892 10.0% Black or African American1 0.6% American Indian / Alaska Native929 12.2% Asian680 12.7% Other race1,046 13.9% Two or more races8,218 16.0% White alone, not Hispanic / Latino1,050 10.3% Hispanic or LatinoMoved from different state 1,460 2.8% White / Caucasian134 0.5% Black or African American84 1.1% Asian18 0.3% Other race275 3.7% Two or more races1,398 2.7% White alone, not Hispanic / Latino173 1.7% Hispanic or LatinoMoved from abroad 15 0.1% Black or African American107 1.4% Asian34 0.6% Other race64 0.9% Two or more races18 0.2% Hispanic or Latino
Children Nativity (place of birth) in Albany
Children under 6 years - Living with two parents Both parents native 1,449 100.0% NativeBoth parents foreign-born 481 88.4% Native63 11.6% Foreign-bornOne native, one foreign-born parent 591 100.0% NativeChildren under 6 years - Living with one parent Native parent 1,463 100.0% NativeForeign-born parent 277 97.2% Native8 2.8% Foreign-bornChildren 6 to 17 years - Living with two parents Both parents native 1,833 100.0% NativeBoth parents foreign-born 546 49.1% Native566 50.9% Foreign-bornOne native, one foreign-born parent 566 83.1% Native115 16.9% Foreign-bornChildren 6 to 17 years - Living with one parent Native parent 2,934 96.6% Native102 3.4% Foreign-bornForeign-born parent 675 57.9% Native491 42.1% Foreign-born
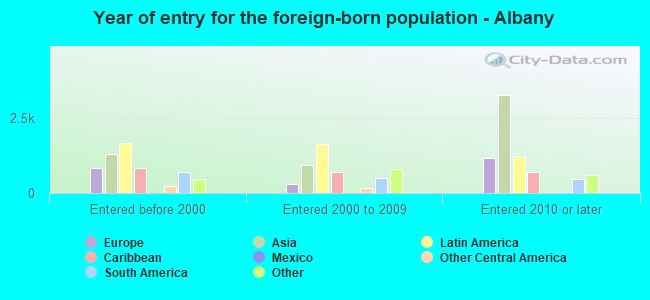
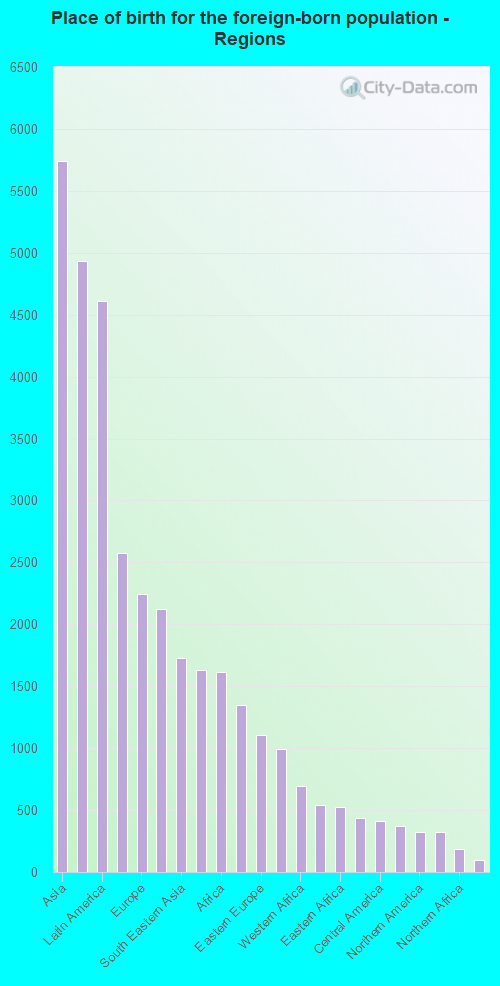
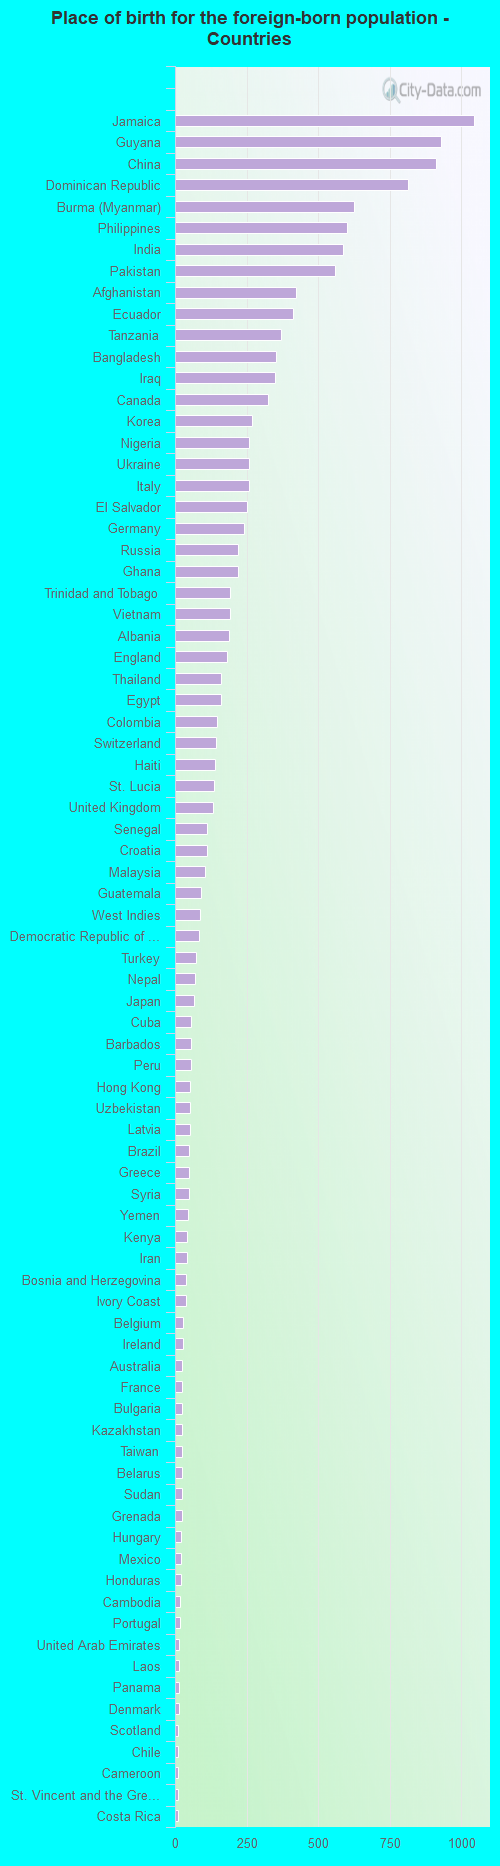
Place of birth for residents in Albany 5,739 Asia4,937 Americas4,612 Latin America2,573 Caribbean2,242 Europe2,125 South Central Asia1,724 South Eastern Asia1,628 South America1,614 Africa1,349 Eastern Asia1,109 Eastern Europe991 China698 Western Africa541 Western Asia523 Eastern Africa440 Western Europe410 Central America368 Northern Europe325 Northern America323 Southern Europe182 Northern Africa95 Middle Africa26 Oceania26 Australia and New Zealand Subregion1,044 Jamaica929 Guyana911 China815 Dominican Republic626 Burma (Myanmar)600 Philippines588 India560 Pakistan421 Afghanistan411 Ecuador370 Tanzania353 Bangladesh350 Iraq325 Canada268 Korea259 Nigeria258 Ukraine257 Italy252 El Salvador240 Germany220 Russia220 Ghana192 Trinidad and Tobago191 Vietnam188 Albania180 England160 Thailand159 Egypt148 Colombia144 Switzerland138 Haiti137 St. Lucia132 United Kingdom112 Senegal110 Croatia105 Malaysia90 Guatemala86 West Indies84 Democratic Republic of Congo (Zaire)72 Turkey70 Nepal68 Japan57 Cuba57 Barbados56 Peru54 Hong Kong53 Uzbekistan51 Latvia49 Brazil49 Greece48 Syria46 Yemen42 Kenya42 Iran39 Bosnia and Herzegovina38 Ivory Coast28 Belgium27 Ireland26 Australia26 France25 Bulgaria25 Kazakhstan24 Taiwan23 Belarus23 Sudan23 Grenada22 Hungary20 Mexico20 Honduras18 Cambodia16 Portugal15 United Arab Emirates15 Laos14 Panama13 Denmark12 Scotland12 Chile11 Cameroon11 St. Vincent and the Grenadines11 Costa Rica9 Argentina9 Sri Lanka9 Uruguay8 Bahamas4 Israel4 Indonesia3 Zimbabwe1 Sweden
Grandparents responsible for own grandchildren in Albany
Grandparents (30 to 59 years) White / Caucasian 79 100.0% Not responsible for grandchildrenBlack or African American 176 51.8% Responsible for grandchildren163 48.2% Not responsible for grandchildrenWhite alone, not Hispanic / Latino 42 100.0% Not responsible for grandchildrenHispanic or Latino 61 100.0% Not responsible for grandchildrenGrandparents (60 years and over) White / Caucasian 18 8.4% Responsible for grandchildren198 91.6% Not responsible for grandchildrenBlack or African American 212 62.0% Responsible for grandchildren130 38.0% Not responsible for grandchildrenWhite alone, not Hispanic / Latino 20 8.5% Responsible for grandchildren211 91.5% Not responsible for grandchildrenHispanic or Latino 31 100.0% Responsible for grandchildren
Zip codes: 12202 , 12203 , 12204 , 12205 , 12206 , 12207 , 12208 , 12209 , 12210 , 12211 , 12222 .