Races in Alexandria, New Hampshire (NH) Detailed Stats
Ancestries, Foreign-born residents, place of birth

Recent posts about races in Alexandria, New Hampshire on our local forum with over 2,400,000 registered users:
 | 2010 Trick or Treat!! (3 replies) |
| The best town to start a family (16 replies) |
| NH Chamber of Commerce (1 reply) |
2.5% of Alexandria, NH residents are foreign-born (1.0% born in Europe, 0.8% born in North America, 0.5% born in Latin America), which is 101.4% less than the foreign-born rate of 5.0% across the entire state of New Hampshire.
Race distribution in Alexandria

- 1,29897.7%White alone
- 191.4%Two or more races
- 50.4%Asian alone
- 40.3%American Indian alone
- 30.2%Hispanic

2000
2022
-
- 1,175,25295.1%White alone
- 20,4891.7%Hispanic
- 15,8031.3%Asian alone
- 11,6060.9%Two or more races
- 8,3540.7%Black alone
- 2,6980.2%American Indian alone
- 1,2540.1%Other race alone
- 3300.03%Native Hawaiian and Other
Pacific Islander alone

-
- 1,208,10186.6%White alone
- 63,4794.5%Hispanic
- 60,7244.4%Two or more races
- 36,5192.6%Asian alone
- 17,9311.3%Black alone
- 6,6150.5%Other race alone
- 1,0140.07%American Indian alone
- 8480.06%Native Hawaiian and Other
Pacific Islander alone

Income and house value in Alexandria
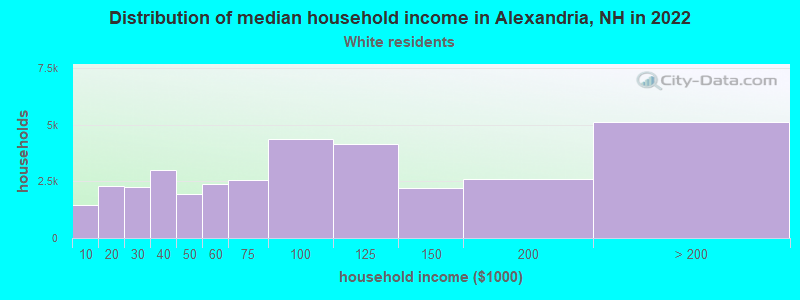
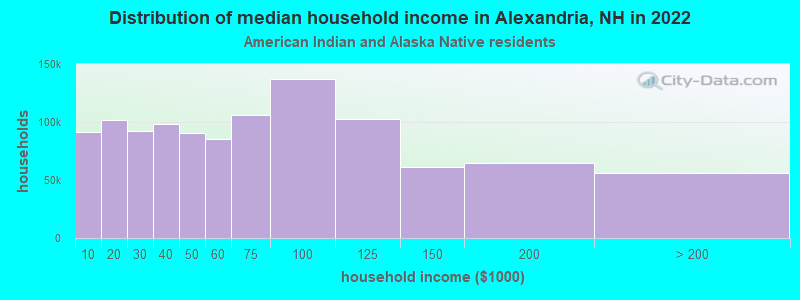
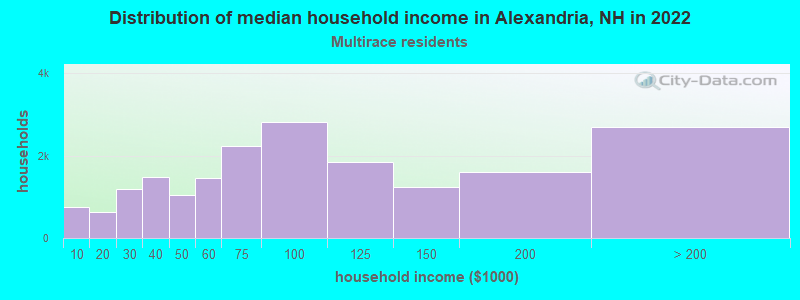
- Median household income in 2022
- $81,567White non-Hispanic householders
- $166,438Two or more races householders
- Median 2022 house value
- $276,473White Non-Hispanic householders
- $207,754American Indian or Alaska Native householders
- $399,528Two or more races householders
Household income for White non-Hispanic householders
Household income for American Indian and Alaska Native householders
Household income for Two or more races householders
Foreign-born residents in Alexandria
33 residents are foreign born (1.0% Europe, 0.8% North America, 0.5% Latin America).
| This city: | 2.5% |
| New Hampshire: | 4.4% |
Ancestries in Alexandria

- 34320.3%English
- 28416.8%French
- 23814.1%Irish
- 1589.4%Other
- 1368.1%United States
- 1146.7%German
- 804.7%Italian
- 653.8%Scottish
- 492.9%French Canadian
- 472.8%Polish
- 472.8%Scotch-Irish
- 352.1%Swedish
- 201.2%Greek
- 191.1%Portuguese
- 160.9%Russian
- 100.6%Welsh
- 90.5%Dutch
- 80.5%Arab
- 50.3%Lithuanian
- 40.2%Norwegian
- 20.1%Danish

Zip codes: 03222.