Races in Alpine, Utah (UT) Detailed Stats
Data:
Races - White alone (%)
Races - White alone (% change since 2000)
Races - Black alone (%)
Races - Black alone (% change since 2000)
Races - American Indian alone (%)
Races - American Indian alone (% change since 2000)
Races - Asian alone (%)
Races - Asian alone (% change since 2000)
Races - Hispanic (%)
Races - Hispanic (% change since 2000)
Races - Native Hawaiian and Other Pacific Islander alone (%)
Races - Native Hawaiian and Other Pacific Islander alone (% change since 2000)
Races - Two or more races(%)
Races - Two or more races(% change since 2000)
Races - Other race alone (%)
Races - Other race alone (% change since 2000)
Racial diversity
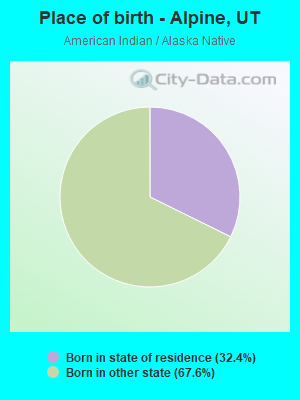
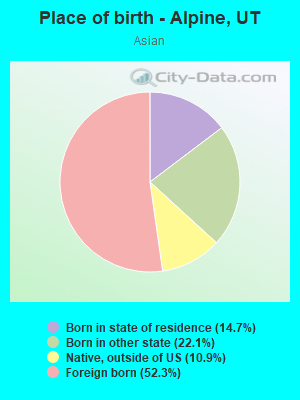
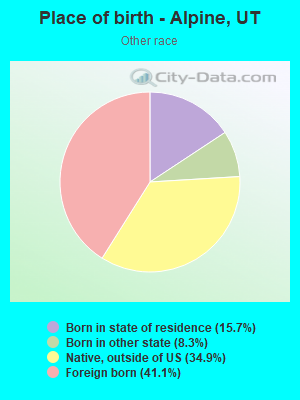
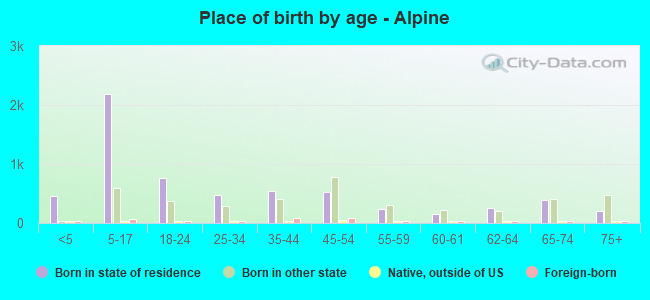
Place of birth - Born in state of residence (%)
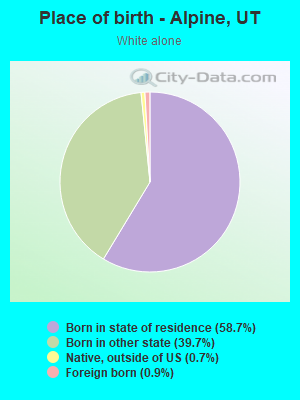
Place of birth - Born in state of residence (%) - White
Place of birth - Born in state of residence (%) - Black or African American
Place of birth - Born in state of residence (%) - Asian
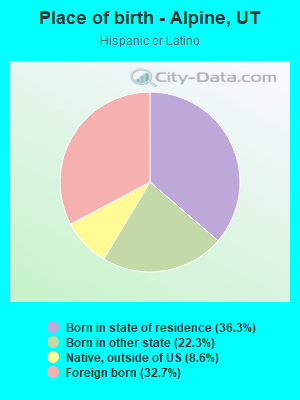
Place of birth - Born in state of residence (%) - Hispanic or Latino
Place of birth - Born in state of residence (%) - American Indian and Alaska Native
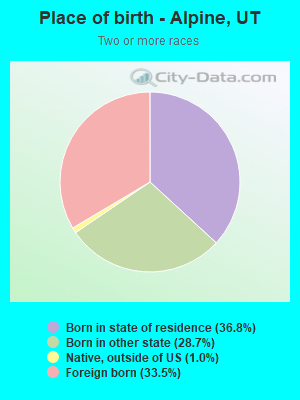
Place of birth - Born in state of residence (%) - Multirace
Place of birth - Born in state of residence (%) - Other Race
Place of birth - Born in other state (%)
Place of birth - Born in other state (%) - White
Place of birth - Born in other state (%) - Black or African American
Place of birth - Born in other state (%) - Asian
Place of birth - Born in other state (%) - Hispanic or Latino
Place of birth - Born in other state (%) - American Indian and Alaska Native
Place of birth - Born in other state (%) - Multirace
Place of birth - Born in other state (%) - Other Race
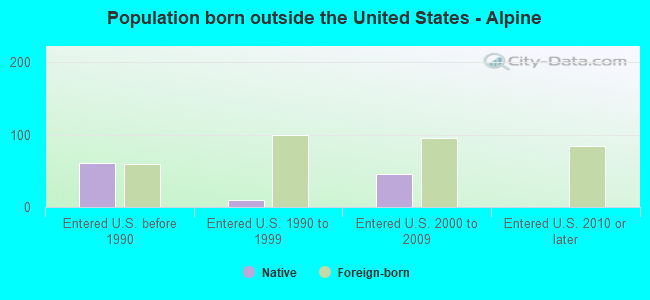
Place of birth - Native, outside of US (%)
Place of birth - Native, outside of US (%) - White
Place of birth - Native, outside of US (%) - Black or African American
Place of birth - Native, outside of US (%) - Asian
Place of birth - Native, outside of US (%) - Hispanic or Latino
Place of birth - Native, outside of US (%) - American Indian and Alaska Native
Place of birth - Native, outside of US (%) - Multirace
Place of birth - Native, outside of US (%) - Other Race
Place of birth - Foreign born (%)
Place of birth - Foreign born (%) - White
Place of birth - Foreign born (%) - Black or African American
Place of birth - Foreign born (%) - Asian
Place of birth - Foreign born (%) - Hispanic or Latino
Place of birth - Foreign born (%) - American Indian and Alaska Native
Place of birth - Foreign born (%) - Multirace
Place of birth - Foreign born (%) - Other Race
Residents speaking English at home (%)
Residents speaking English at home - Born in the United States (%)
Residents speaking English at home - Native, born elsewhere (%)
Residents speaking English at home - Foreign born (%)
Residents speaking Spanish at home (%)
Residents speaking Spanish at home - Born in the United States (%)
Residents speaking Spanish at home - Native, born elsewhere (%)
Residents speaking Spanish at home - Foreign born (%)
Residents speaking other language at home (%)
Residents speaking other language at home - Born in the United States (%)
Residents speaking other language at home - Native, born elsewhere (%)
Residents speaking other language at home - Foreign born (%)
Marital status - Never married (%)
Marital status - Now married (%)
Marital status - Separated (%)
Marital status - Widowed (%)
Marital status - Divorced (%)
Ancestries Reported - Arab (%)
Ancestries Reported - Czech (%)
Ancestries Reported - Danish (%)
Ancestries Reported - Dutch (%)
Ancestries Reported - English (%)
Ancestries Reported - French (%)
Ancestries Reported - French Canadian (%)
Ancestries Reported - German (%)
Ancestries Reported - Greek (%)
Ancestries Reported - Hungarian (%)
Ancestries Reported - Irish (%)
Ancestries Reported - Italian (%)
Ancestries Reported - Lithuanian (%)
Ancestries Reported - Norwegian (%)
Ancestries Reported - Polish (%)
Ancestries Reported - Portuguese (%)
Ancestries Reported - Russian (%)
Ancestries Reported - Scotch-Irish (%)
Ancestries Reported - Scottish (%)
Ancestries Reported - Slovak (%)
Ancestries Reported - Subsaharan African (%)
Ancestries Reported - Swedish (%)
Ancestries Reported - Swiss (%)
Ancestries Reported - Ukrainian (%)
Ancestries Reported - United States (%)
Ancestries Reported - Welsh (%)
Ancestries Reported - West Indian (%)
Ancestries Reported - Other (%)
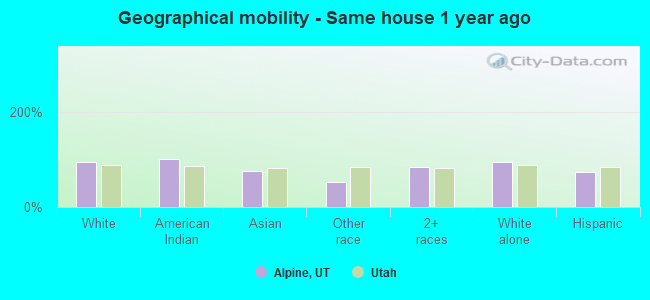
Geographical mobility - Same house 1 year ago (%)
Geographical mobility - Same house 1 year ago (%) - White
Geographical mobility - Same house 1 year ago (%) - Black or African American
Geographical mobility - Same house 1 year ago (%) - Asian
Geographical mobility - Same house 1 year ago (%) - Hispanic or Latino
Geographical mobility - Same house 1 year ago (%) - American Indian and Alaska Native
Geographical mobility - Same house 1 year ago (%) - Multirace
Geographical mobility - Same house 1 year ago (%) - Other Race
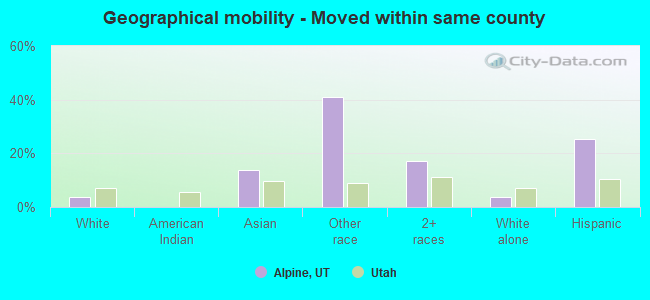
Geographical mobility - Moved within same county (%)
Geographical mobility - Moved within same county (%) - White
Geographical mobility - Moved within same county (%) - Black or African American
Geographical mobility - Moved within same county (%) - Asian
Geographical mobility - Moved within same county (%) - Hispanic or Latino
Geographical mobility - Moved within same county (%) - American Indian and Alaska Native
Geographical mobility - Moved within same county (%) - Multirace
Geographical mobility - Moved within same county (%) - Other Race
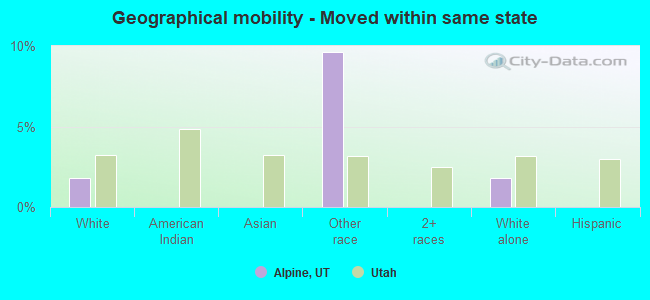
Geographical mobility - Moved from different county within same state (%)
Geographical mobility - Moved from different county within same state (%) - White
Geographical mobility - Moved from different county within same state (%) - Black or African American
Geographical mobility - Moved from different county within same state (%) - Asian
Geographical mobility - Moved from different county within same state (%) - Hispanic or Latino
Geographical mobility - Moved from different county within same state (%) - American Indian and Alaska Native
Geographical mobility - Moved from different county within same state (%) - Multirace
Geographical mobility - Moved from different county within same state (%) - Other Race
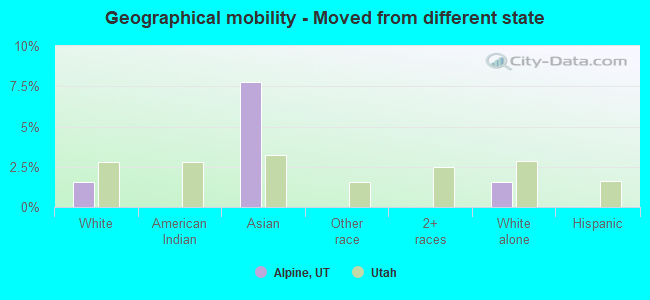
Geographical mobility - Moved from different state (%)
Geographical mobility - Moved from different state (%) - White
Geographical mobility - Moved from different state (%) - Black or African American
Geographical mobility - Moved from different state (%) - Asian
Geographical mobility - Moved from different state (%) - Hispanic or Latino
Geographical mobility - Moved from different state (%) - American Indian and Alaska Native
Geographical mobility - Moved from different state (%) - Multirace
Geographical mobility - Moved from different state (%) - Other Race
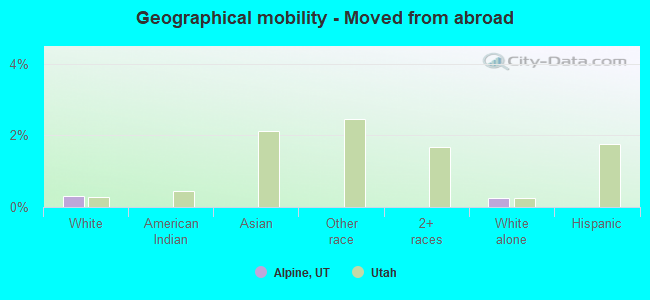
Geographical mobility - Moved from abroad (%)
Geographical mobility - Moved from abroad (%) - White
Geographical mobility - Moved from abroad (%) - Black or African American
Geographical mobility - Moved from abroad (%) - Asian
Geographical mobility - Moved from abroad (%) - Hispanic or Latino
Geographical mobility - Moved from abroad (%) - American Indian and Alaska Native
Geographical mobility - Moved from abroad (%) - Multirace
Geographical mobility - Moved from abroad (%) - Other Race
Place of birth for the foreign-born population - Ireland (%)
Place of birth for the foreign-born population - Denmark (%)
Place of birth for the foreign-born population - Norway (%)
Place of birth for the foreign-born population - Sweden (%)
Place of birth for the foreign-born population - United Kingdom (%)
Place of birth for the foreign-born population - England (%)
Place of birth for the foreign-born population - Scotland (%)
Place of birth for the foreign-born population - Other Northern Europe (%)
Place of birth for the foreign-born population - Austria (%)
Place of birth for the foreign-born population - Belgium (%)
Place of birth for the foreign-born population - France (%)
Place of birth for the foreign-born population - Germany (%)
Place of birth for the foreign-born population - Netherlands (%)
Place of birth for the foreign-born population - Switzerland (%)
Place of birth for the foreign-born population - Other Western Europe (%)
Place of birth for the foreign-born population - Greece (%)
Place of birth for the foreign-born population - Italy (%)
Place of birth for the foreign-born population - Portugal (%)
Place of birth for the foreign-born population - Spain (%)
Place of birth for the foreign-born population - Other Southern Europe (%)
Place of birth for the foreign-born population - Albania (%)
Place of birth for the foreign-born population - Belarus (%)
Place of birth for the foreign-born population - Bosnia and Herzegovina (%)
Place of birth for the foreign-born population - Bulgaria (%)
Place of birth for the foreign-born population - Croatia (%)
Place of birth for the foreign-born population - Czechoslovakia (%)
Place of birth for the foreign-born population - Hungary (%)
Place of birth for the foreign-born population - Latvia (%)
Place of birth for the foreign-born population - Lithuania (%)
Place of birth for the foreign-born population - North Macedonia (Macedonia) (%)
Place of birth for the foreign-born population - Moldova (%)
Place of birth for the foreign-born population - Poland (%)
Place of birth for the foreign-born population - Romania (%)
Place of birth for the foreign-born population - Russia (%)
Place of birth for the foreign-born population - Serbia (%)
Place of birth for the foreign-born population - Ukraine (%)
Place of birth for the foreign-born population - Other Eastern Europe (%)
Place of birth for the foreign-born population - China (%)
Place of birth for the foreign-born population - Hong Kong (%)
Place of birth for the foreign-born population - Taiwan (%)
Place of birth for the foreign-born population - Japan (%)
Place of birth for the foreign-born population - Korea (%)
Place of birth for the foreign-born population - Other Eastern Asia (%)
Place of birth for the foreign-born population - Afghanistan (%)
Place of birth for the foreign-born population - Bangladesh (%)
Place of birth for the foreign-born population - India (%)
Place of birth for the foreign-born population - Iran (%)
Place of birth for the foreign-born population - Kazakhstan (%)
Place of birth for the foreign-born population - Nepal (%)
Place of birth for the foreign-born population - Pakistan (%)
Place of birth for the foreign-born population - Sri Lanka (%)
Place of birth for the foreign-born population - Uzbekistan (%)
Place of birth for the foreign-born population - Other South Central Asia (%)
Place of birth for the foreign-born population - Burma (%)
Place of birth for the foreign-born population - Cambodia (%)
Place of birth for the foreign-born population - Indonesia (%)
Place of birth for the foreign-born population - Laos (%)
Place of birth for the foreign-born population - Malaysia (%)
Place of birth for the foreign-born population - Philippines (%)
Place of birth for the foreign-born population - Singapore (%)
Place of birth for the foreign-born population - Thailand (%)
Place of birth for the foreign-born population - Vietnam (%)
Place of birth for the foreign-born population - Other South Eastern Asia (%)
Place of birth for the foreign-born population - Armenia (%)
Place of birth for the foreign-born population - Iraq (%)
Place of birth for the foreign-born population - Israel (%)
Place of birth for the foreign-born population - Jordan (%)
Place of birth for the foreign-born population - Kuwait (%)
Place of birth for the foreign-born population - Lebanon (%)
Place of birth for the foreign-born population - Saudi Arabia (%)
Place of birth for the foreign-born population - Syria (%)
Place of birth for the foreign-born population - Turkey (%)
Place of birth for the foreign-born population - Yemen (%)
Place of birth for the foreign-born population - Other Western Asia (%)
Place of birth for the foreign-born population - Eritrea (%)
Place of birth for the foreign-born population - Ethiopia (%)
Place of birth for the foreign-born population - Kenya (%)
Place of birth for the foreign-born population - Somalia (%)
Place of birth for the foreign-born population - Uganda (%)
Place of birth for the foreign-born population - Zimbabwe (%)
Place of birth for the foreign-born population - Other Eastern Africa (%)
Place of birth for the foreign-born population - Cameroon (%)
Place of birth for the foreign-born population - Congo (%)
Place of birth for the foreign-born population - Democratic Republic of Congo (Zaire) (%)
Place of birth for the foreign-born population - Other Middle Africa (%)
Place of birth for the foreign-born population - Egypt (%)
Place of birth for the foreign-born population - Morocco (%)
Place of birth for the foreign-born population - Sudan (%)
Place of birth for the foreign-born population - Other Northern Africa (%)
Place of birth for the foreign-born population - South Africa (%)
Place of birth for the foreign-born population - Other Southern Africa (%)
Place of birth for the foreign-born population - Cabo Verde (%)
Place of birth for the foreign-born population - Ghana (%)
Place of birth for the foreign-born population - Liberia (%)
Place of birth for the foreign-born population - Nigeria (%)
Place of birth for the foreign-born population - Senegal (%)
Place of birth for the foreign-born population - Sierra Leone (%)
Place of birth for the foreign-born population - Other Western Africa (%)
Place of birth for the foreign-born population - Australia (%)
Place of birth for the foreign-born population - New Zealand (%)
Place of birth for the foreign-born population - Fiji (%)
Place of birth for the foreign-born population - Micronesia (%)
Place of birth for the foreign-born population - Bahamas (%)
Place of birth for the foreign-born population - Barbados (%)
Place of birth for the foreign-born population - Cuba (%)
Place of birth for the foreign-born population - Dominica (%)
Place of birth for the foreign-born population - Dominican Republic (%)
Place of birth for the foreign-born population - Grenada (%)
Place of birth for the foreign-born population - Haiti (%)
Place of birth for the foreign-born population - Jamaica (%)
Place of birth for the foreign-born population - St. Vincent and the Grenadines (%)
Place of birth for the foreign-born population - Trinidad and Tobago (%)
Place of birth for the foreign-born population - West Indies (%)
Place of birth for the foreign-born population - Other Caribbean (%)
Place of birth for the foreign-born population - Belize (%)
Place of birth for the foreign-born population - Costa Rica (%)
Place of birth for the foreign-born population - El Salvador (%)
Place of birth for the foreign-born population - Guatemala (%)
Place of birth for the foreign-born population - Honduras (%)
Place of birth for the foreign-born population - Mexico (%)
Place of birth for the foreign-born population - Nicaragua (%)
Place of birth for the foreign-born population - Panama (%)
Place of birth for the foreign-born population - Other Central America (%)
Place of birth for the foreign-born population - Argentina (%)
Place of birth for the foreign-born population - Bolivia (%)
Place of birth for the foreign-born population - Brazil (%)
Place of birth for the foreign-born population - Chile (%)
Place of birth for the foreign-born population - Colombia (%)
Place of birth for the foreign-born population - Ecuador (%)
Place of birth for the foreign-born population - Guyana (%)
Place of birth for the foreign-born population - Peru (%)
Place of birth for the foreign-born population - Uruguay (%)
Place of birth for the foreign-born population - Venezuela (%)
Place of birth for the foreign-born population - Other South America (%)
Place of birth for the foreign-born population - Canada (%)
Place of birth for the foreign-born population - Other Northern America (%)
Place of birth for the foreign-born population - Other (%)
Latest news about races in Alpine, UT collected exclusively by city-data.com from local newspapers, TV, and radio stations
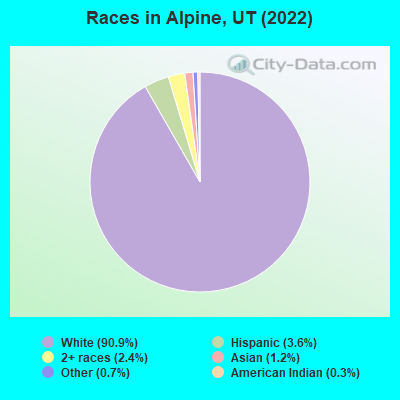
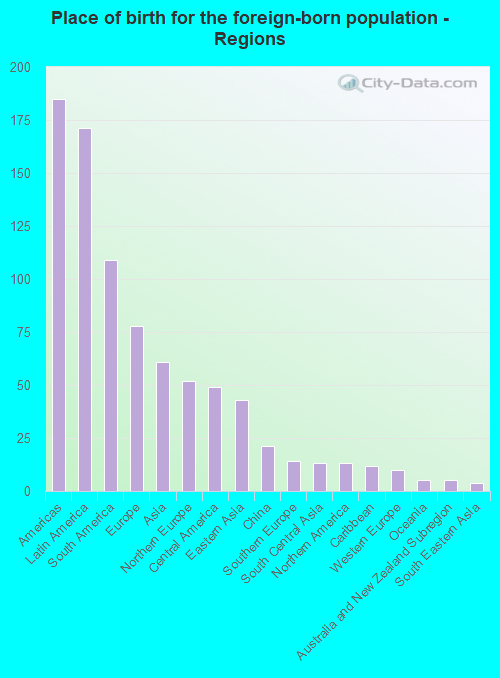
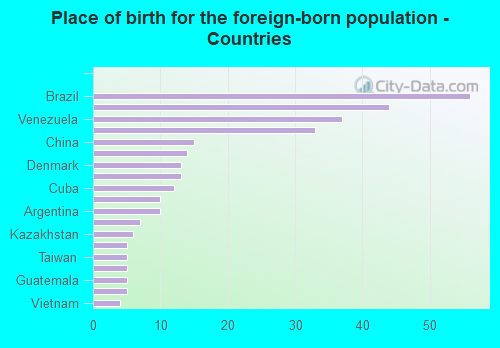
According to 2022 data, the most numerous races in Alpine, UT are White alone (9,840 residents), Hispanic (387 residents), and Two or more races (258 residents). 90.0% of Alpine residents speak English at home. 3.0% of Alpine, UT residents are foreign-born (1.6% born in Latin America, 0.7% born in Europe, 0.6% born in Asia), which is 162.3% less than the foreign-born rate of 8.0% across the entire state of Utah.
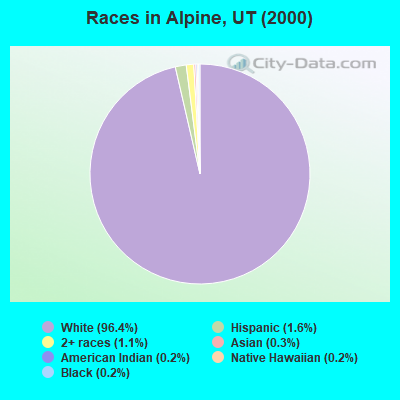
Race distribution in Alpine
2000 2022
1,904,265 85.3% White alone 201,559 9.0% Hispanic 36,483 1.6% Asian alone 31,308 1.4% Two or more races 26,663 1.2% American Indian alone 14,806 0.7% Native Hawaiian and Other 16,137 0.7% Black alone 1,948 0.09% Other race alone
2,557,466 75.6% White alone 512,086 15.1% Hispanic 119,308 3.5% Two or more races 82,388 2.4% Asian alone 36,978 1.1% Native Hawaiian and Other 34,873 1.0% Black alone 22,803 0.7% American Indian alone 14,898 0.4% Other race alone
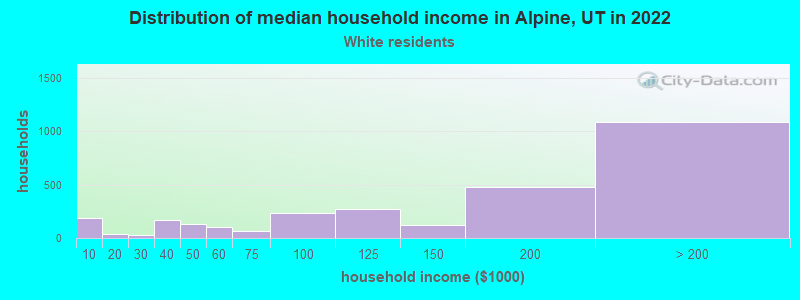
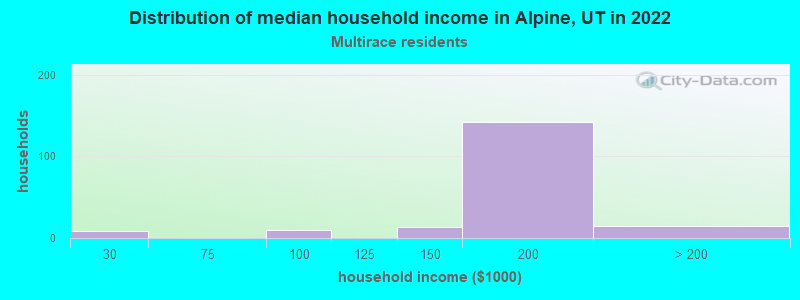
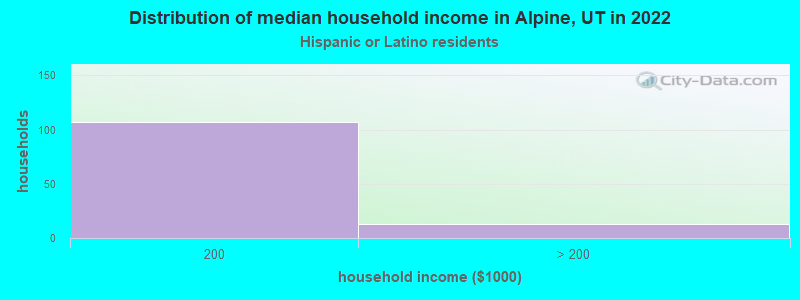
Income and house value in Alpine Median household income in 2022 $163,900 White non-Hispanic householders$165,422 Two or more races householders$186,997 Hispanic or Latino race householdersMedian 2022 house value $994,305 White Non-Hispanic householders $469,979 Asian householdersover $1,000,000 Some other race householdersover $1,000,000 Two or more races householdersover $1,000,000 Hispanic or Latino householders
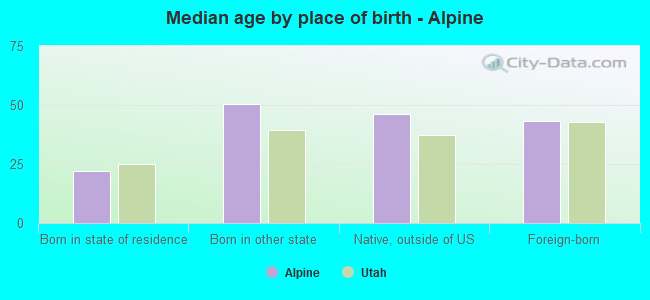
Median age by race in Alpine
36.2 Median age for White residents38.7 31.6 -591,194,968.0 Median age for Black or African American residents-545,722,713.3 -640,650,405.9 38.2 Median age for American Indian / Alaska Native residents-649,572,648.9 56.2 26.4 Median age for Asian residents-702,020,201.3 49.9 -599,999,999.4 Median age for Native Hawaiian / Pacific Islander residents-749,999,999.2 -583,006,535.4 46.0 Median age for Other race residents50.8 23.7 22.6 Median age for Two or more races residents19.8 36.2 36.4 Median age for White alone residents38.8 31.8 27.0 Median age for Hispanic or Latino residents22.1 27.5
Owner/renter occupied households by race in Alpine
House owners and renters - White residents 2,488 87.5% Owner occupied355 12.5% Renter occupiedHouse owners and renters - American Indian / Alaska Native residents 10 100.0% Owner occupiedHouse owners and renters - Asian residents 14 100.0% Renter occupiedHouse owners and renters - Two or more races residents 118 71.9% Owner occupied46 28.1% Renter occupiedHouse owners and renters - White alone residents 2,536 87.3% Owner occupied369 12.7% Renter occupiedHouse owners and renters - Hispanic or Latino residents 49 60.2% Owner occupied32 39.8% Renter occupied
Language usage in Alpine
English speakers - Total 90.0% of residents of Alpine speak English at home.
3.8% of residents speak Spanish at home 379 95.9% Speak English very well16 4.1% Speak English less than very well5.6% of residents speak other language at home 470 81.3% Speak English very well108 18.7% Speak English less than very well
English speakers - Born in the United States 88.9% of residents of Alpine speak English at home.
4.0% of residents speak Spanish at home 164 100.0% Speak English very well7.5% of residents speak other language at home 297 96.1% Speak English very well12 3.9% Speak English less than very well
English speakers - Native, born elsewhere 91.8% of residents of Alpine speak English at home.
4.9% of residents speak Spanish at home 6 100.0% Speak English very well6.6% of residents speak other language at home 8 100.0% Speak English very well
English speakers - Foreign-born 34.4% of residents of Alpine speak English at home.
23.4% of residents speak Spanish at home 68 81.9% Speak English very well15 18.1% Speak English less than very well36.9% of residents speak other language at home 63 48.1% Speak English very well68 51.9% Speak English less than very well
White (Caucasian) - Speak only English Native:
95.2% (8,849)Foreign-born:
74.3% (37)
White (Caucasian) - Speak another language Native:
5.0% (465)Foreign-born:
45.1% (23)
Asian - Speak only English Native:
89.3% (56)Foreign-born:
92.5% (58)
Other race - Speak only English Native:
71.3% (59)Foreign-born:
15.3% (10)
Other race - Speak another language Native:
11.4% (10)Foreign-born:
76.7% (49)
Two or more races - Speak only English Native:
47.7% (167)Foreign-born:
9.4% (21)
Two or more races - Speak another language Native:
60.4% (212)Foreign-born:
90.5% (205)
White alone - Speak only English Native:
94.0% (8,832)Foreign-born:
48.3% (43)
White alone - Speak another language Native:
6.0% (564)Foreign-born:
48.8% (43)
Hispanic or Latino - Speak only English Native:
43.7% (93)Foreign-born:
12.5% (15)
Hispanic or Latino - Speak another language Native:
56.2% (119)Foreign-born:
81.6% (100)
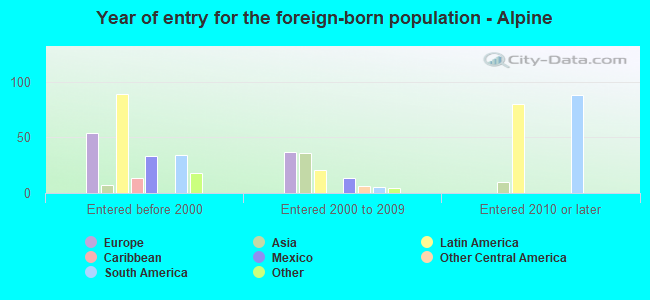
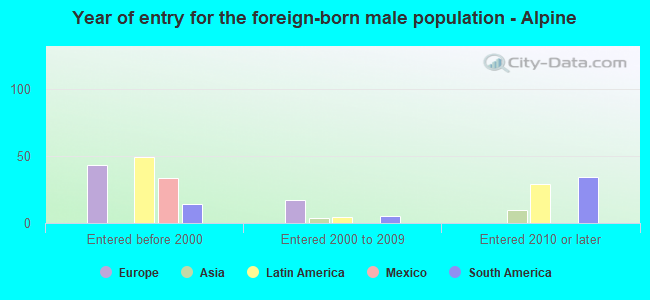
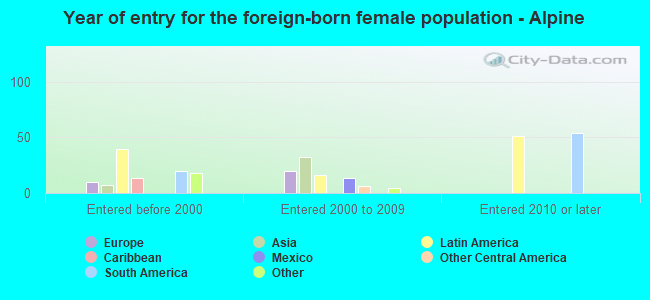
Foreign-born residents in Alpine 330 residents are foreign born (1.6% Latin America , 0.7% Europe , 0.6% Asia ).
Marital status for residents in Alpine Marital status - White (Caucasian) population 15 years and over
Males 26.9% Never married65.4% Now married0.0% Separated1.8% Widowed6.0% DivorcedFemales 27.1% Never married66.9% Now married0.0% Separated3.9% Widowed2.1% DivorcedWomen who gave birth in the past 12 months Now married:
100.0% (75)Unmarried:
0.0% (0)
Women who did not give birth in the past 12 months Now married:
53.0% (1,077)Unmarried:
47.0% (955)
Marital status - American Indian / Alaska Native population 15 years and over
Males 100.0% Never married0.0% Now married0.0% Separated0.0% Widowed0.0% DivorcedFemales 0.0% Never married75.0% Now married25.0% Separated0.0% Widowed0.0% DivorcedMarital status - Asian population 15 years and over
Males 0.0% Never married100.0% Now married0.0% Separated0.0% Widowed0.0% DivorcedFemales 12.1% Never married87.9% Now married0.0% Separated0.0% Widowed0.0% DivorcedWomen who did not give birth in the past 12 months Now married:
78.1% (29)Unmarried:
21.9% (8)
Marital status - Other race population 15 years and over
Males 0.0% Never married100.0% Now married0.0% Separated0.0% Widowed0.0% DivorcedFemales 0.0% Never married100.0% Now married0.0% Separated0.0% Widowed0.0% DivorcedWomen who did not give birth in the past 12 months Now married:
100.0% (49)Unmarried:
0.0% (0)
Marital status - Two or more races population 15 years and over
Males 19.2% Never married80.8% Now married0.0% Separated0.0% Widowed0.0% DivorcedFemales 17.2% Never married74.6% Now married0.0% Separated0.0% Widowed8.2% DivorcedWomen who did not give birth in the past 12 months Now married:
46.6% (35)Unmarried:
53.4% (40)
Marital status - White alone, not Hispanic / Latino population 15 years and over
Males 26.9% Never married65.3% Now married0.0% Separated1.8% Widowed6.0% DivorcedFemales 27.0% Never married67.0% Now married0.0% Separated3.9% Widowed2.1% DivorcedWomen who gave birth in the past 12 months Now married:
100.0% (77)Unmarried:
0.0% (0)
Women who did not give birth in the past 12 months Now married:
53.1% (1,105)Unmarried:
46.9% (976)
Marital status - Hispanic or Latino population 15 years and over
Males 20.6% Never married79.4% Now married0.0% Separated0.0% Widowed0.0% DivorcedFemales 25.4% Never married65.8% Now married0.0% Separated0.0% Widowed8.8% DivorcedWomen who did not give birth in the past 12 months Now married:
51.9% (46)Unmarried:
48.1% (43)
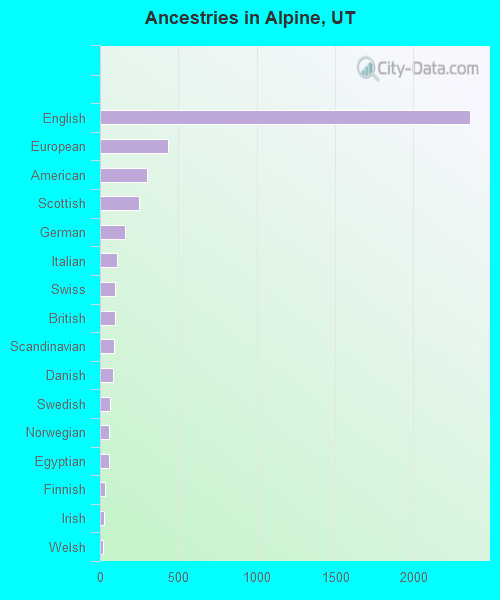
Ancestries in Alpine
2,364 47.7% English433 8.7% European301 6.1% American248 5.0% Scottish161 3.2% German107 2.2% Italian97 2.0% Swiss93 1.9% British90 1.8% Scandinavian82 1.7% Danish63 1.3% Swedish58 1.2% Norwegian57 1.1% Egyptian35 0.7% Finnish27 0.5% Irish22 0.4% Welsh18 0.4% Dutch13 0.3% French5 0.1% Canadian5 0.1% Icelander3 0.06% Australian3 0.06% Eastern European2 0.04% Hungarian
Children Nativity (place of birth) in Alpine
Children under 6 years - Living with two parents Both parents native 505 100.0% NativeOne native, one foreign-born parent 67 100.0% NativeChildren under 6 years - Living with one parent Native parent 65 100.0% NativeChildren 6 to 17 years - Living with two parents Both parents native 2,369 98.3% Native41 1.7% Foreign-bornBoth parents foreign-born 47 63.2% Native27 36.8% Foreign-bornOne native, one foreign-born parent 50 100.0% NativeChildren 6 to 17 years - Living with one parent Native parent 142 100.0% Native
Grandparents responsible for own grandchildren in Alpine
Grandparents (30 to 59 years) White / Caucasian 16 32.5% Responsible for grandchildren33 67.5% Not responsible for grandchildrenWhite alone, not Hispanic / Latino 17 31.1% Responsible for grandchildren38 68.9% Not responsible for grandchildrenGrandparents (60 years and over) White / Caucasian 71 43.2% Responsible for grandchildren94 56.8% Not responsible for grandchildrenWhite alone, not Hispanic / Latino 73 42.4% Responsible for grandchildren100 57.6% Not responsible for grandchildren