Races in Bethlehem, New York (NY) Detailed Stats
Ancestries, Foreign-born residents, place of birth
4.8% of Bethlehem, NY residents are foreign-born (2.2% born in Europe, 1.5% born in Asia, 0.6% born in Latin America, 0.5% born in North America), which is 356.7% less than the foreign-born rate of 22.0% across the entire state of New York.
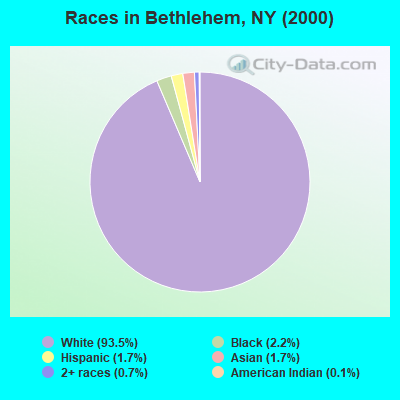
Race distribution in Bethlehem

- 29,25693.5%White alone
- 6852.2%Black alone
- 5441.7%Hispanic
- 5211.7%Asian alone
- 2250.7%Two or more races
- 380.1%American Indian alone
- 250.08%Other race alone
- 100.03%Native Hawaiian and Other
Pacific Islander alone
2000
2022
-
- 11,760,98162.0%White alone
- 2,867,58315.1%Hispanic
- 2,812,62314.8%Black alone
- 1,035,9265.5%Asian alone
- 366,1161.9%Two or more races
- 75,4990.4%Other race alone
- 52,4990.3%American Indian alone
- 5,2300.03%Native Hawaiian and Other
Pacific Islander alone

-
- 10,408,93352.9%White alone
- 3,867,29919.7%Hispanic
- 2,633,84013.4%Black alone
- 1,776,2869.0%Asian alone
- 732,6703.7%Two or more races
- 216,1101.1%Other race alone
- 35,0820.2%American Indian alone
- 6,9310.04%Native Hawaiian and Other
Pacific Islander alone

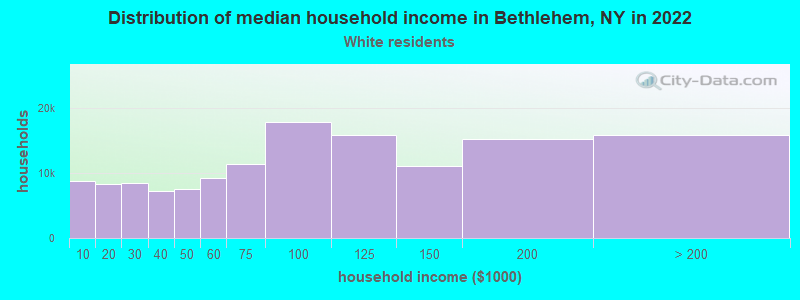
Income and house value in Bethlehem
- Median household income in 2022
- $115,261White non-Hispanic householders
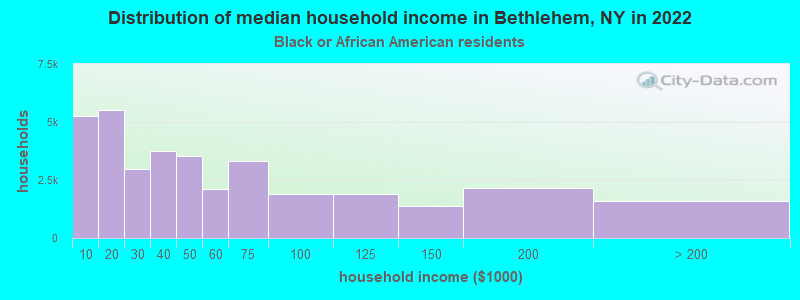
- $95,616Black householders
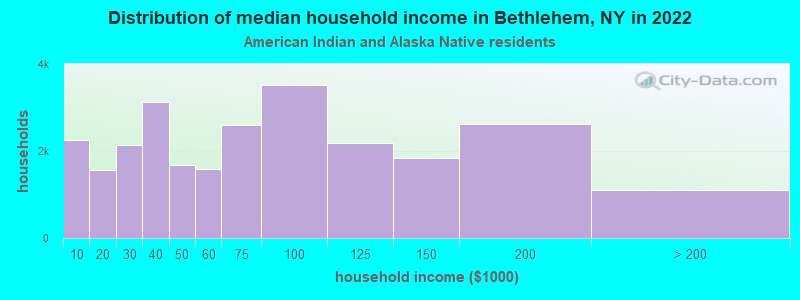
- $80,732American Indian and Alaska Native householders
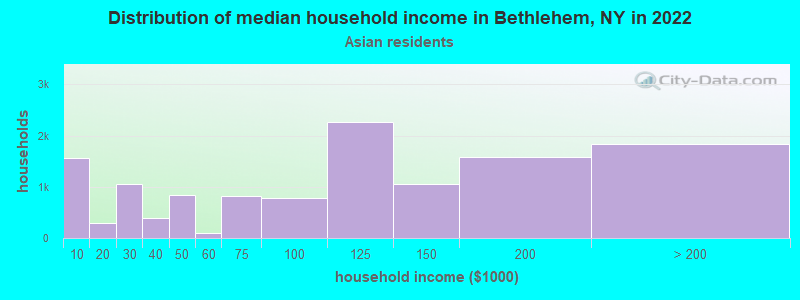
- $146,266Asian householders
- $49,566Some other race householders
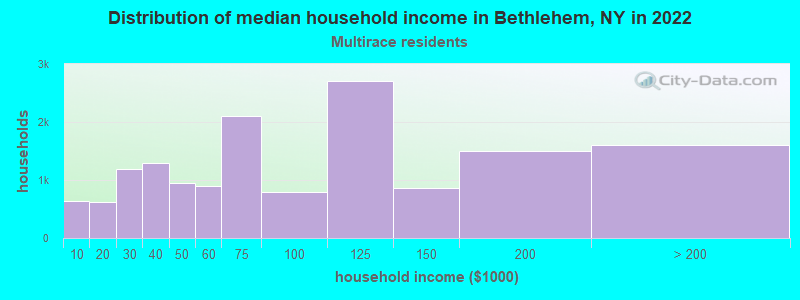
- over $200,000Two or more races householders
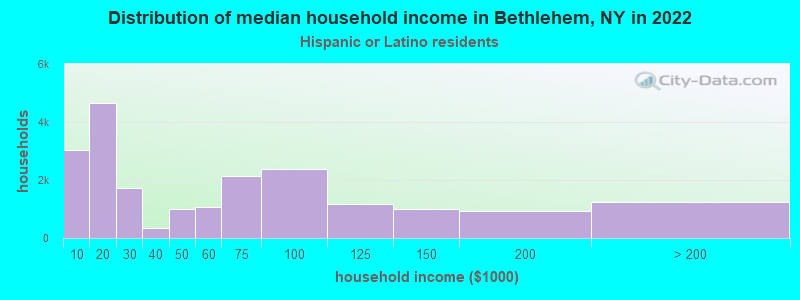
- $154,852Hispanic or Latino race householders
- Median 2022 house value
- $347,612White Non-Hispanic householders
- $291,771Black or African American householders
- $271,949American Indian or Alaska Native householders
- $338,426Asian householders
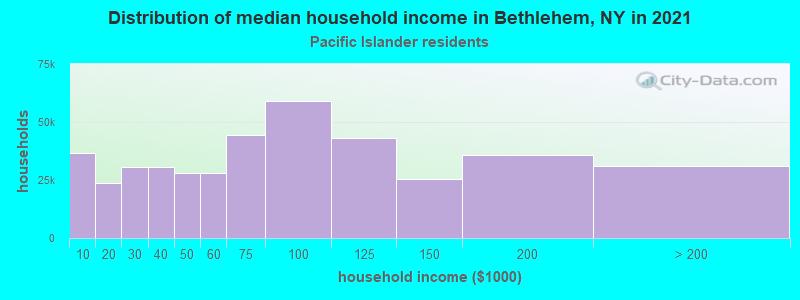
- $453,249Native Hawaiian and other Pacific Islander householders
- $352,446Two or more races householders
- $358,490Hispanic or Latino householders
Household income for White non-Hispanic householders
Household income for Black householders
Household income for American Indian and Alaska Native householders
Household income for Asian householders
Household income for Native Hawaiian and other Pacific Islander householders
Household income for Two or more races householders
Household income for Hispanic or Latino race householders
Foreign-born residents in Bethlehem
1,508 residents are foreign born (2.2% Europe, 1.5% Asia, 0.6% Latin America, 0.5% North America).
| This city: | 4.8% |
| New York: | 20.4% |
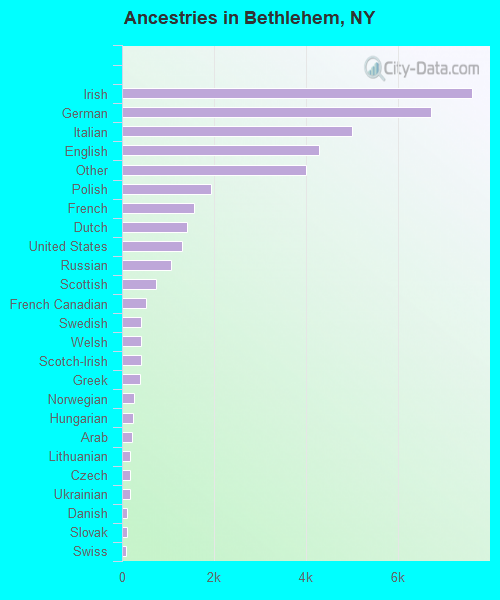
Ancestries in Bethlehem

- 7,60319.3%Irish
- 6,71817.0%German
- 5,00512.7%Italian
- 4,28410.9%English
- 3,99810.1%Other
- 1,9354.9%Polish
- 1,5774.0%French
- 1,4073.6%Dutch
- 1,2953.3%United States
- 1,0562.7%Russian
- 7391.9%Scottish
- 5301.3%French Canadian
- 4171.1%Swedish
- 4151.1%Welsh
- 4131.0%Scotch-Irish
- 3871.0%Greek
- 2560.6%Norwegian
- 2290.6%Hungarian
- 2070.5%Arab
- 1830.5%Lithuanian
- 1740.4%Czech
- 1710.4%Ukrainian
- 1070.3%Danish
- 1050.3%Slovak
- 970.2%Swiss
- 590.1%Portuguese
- 480.1%West Indian
- 160.04%Subsaharan African
Zip codes: 12054.