Races in Brownington, Vermont (VT) Detailed Stats
Ancestries, Foreign-born residents, place of birth
4.4% of Brownington, VT residents are foreign-born (2.5% born in North America, 1.1% born in Europe, 0.5% born in Asia), which is 9.2% greater than the foreign-born rate of 4.0% across the entire state of Vermont.
Race distribution in Brownington

- 85896.9%White alone
- 111.2%American Indian alone
- 60.7%Two or more races
- 40.5%Hispanic
- 40.5%Black alone
- 20.2%Asian alone

2000
2022
-
- 585,43196.2%White alone
- 6,8091.1%Two or more races
- 5,5040.9%Hispanic
- 5,1600.8%Asian alone
- 2,9210.5%Black alone
- 2,3250.4%American Indian alone
- 5570.09%Other race alone
- 1200.02%Native Hawaiian and Other
Pacific Islander alone

-
- 583,54690.2%White alone
- 27,3404.2%Two or more races
- 14,7702.3%Hispanic
- 11,5121.8%Asian alone
- 6,2641.0%Black alone
- 2,5210.4%Other race alone
- 1,0520.2%American Indian alone
- 590.01%Native Hawaiian and Other
Pacific Islander alone

Income and house value in Brownington
- Median household income in 2022
- $55,932White non-Hispanic householders
- $64,388American Indian and Alaska Native householders
- $100,300Some other race householders
- $17,138Two or more races householders
- $50,690Hispanic or Latino race householders
- Median 2022 house value
- $189,583White Non-Hispanic householders
- $173,562American Indian or Alaska Native householders
- $200,264Two or more races householders
Household income for White non-Hispanic householders

Household income for American Indian and Alaska Native householders

Household income for Two or more races householders

Household income for Hispanic or Latino race householders

Foreign-born residents in Brownington
39 residents are foreign born (2.5% North America, 1.1% Europe, 0.5% Asia).
| This city: | 4.4% |
| Vermont: | 3.8% |
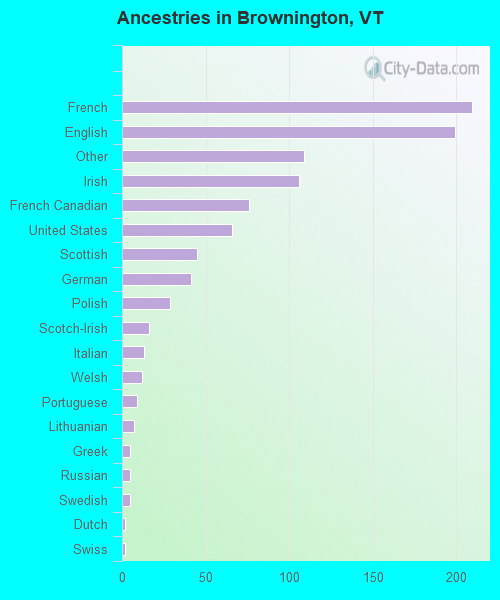
Ancestries in Brownington

- 20921.8%French
- 19920.8%English
- 10911.4%Other
- 10611.1%Irish
- 767.9%French Canadian
- 666.9%United States
- 454.7%Scottish
- 414.3%German
- 293.0%Polish
- 161.7%Scotch-Irish
- 131.4%Italian
- 121.3%Welsh
- 90.9%Portuguese
- 70.7%Lithuanian
- 50.5%Greek
- 50.5%Russian
- 50.5%Swedish
- 20.2%Dutch
- 20.2%Swiss
- 10.1%Norwegian
Zip codes: 05860.