Races in Burke, Vermont (VT) Detailed Stats
Ancestries, Foreign-born residents, place of birth
2.2% of Burke, VT residents are foreign-born (1.3% born in North America, 0.8% born in Europe), which is 79.5% less than the foreign-born rate of 4.0% across the entire state of Vermont.
Race distribution in Burke

- 1,51896.6%White alone
- 201.3%Two or more races
- 171.1%Hispanic
- 90.6%American Indian alone
- 40.3%Black alone
- 30.2%Asian alone

2000
2022
-
- 585,43196.2%White alone
- 6,8091.1%Two or more races
- 5,5040.9%Hispanic
- 5,1600.8%Asian alone
- 2,9210.5%Black alone
- 2,3250.4%American Indian alone
- 5570.09%Other race alone
- 1200.02%Native Hawaiian and Other
Pacific Islander alone

-
- 583,54690.2%White alone
- 27,3404.2%Two or more races
- 14,7702.3%Hispanic
- 11,5121.8%Asian alone
- 6,2641.0%Black alone
- 2,5210.4%Other race alone
- 1,0520.2%American Indian alone
- 590.01%Native Hawaiian and Other
Pacific Islander alone

Income and house value in Burke
- Median household income in 2022
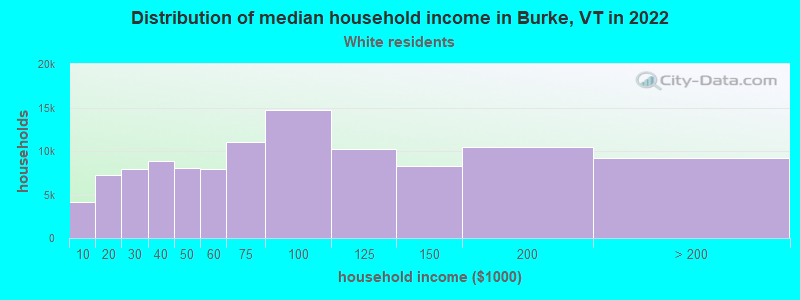
- $61,774White non-Hispanic householders
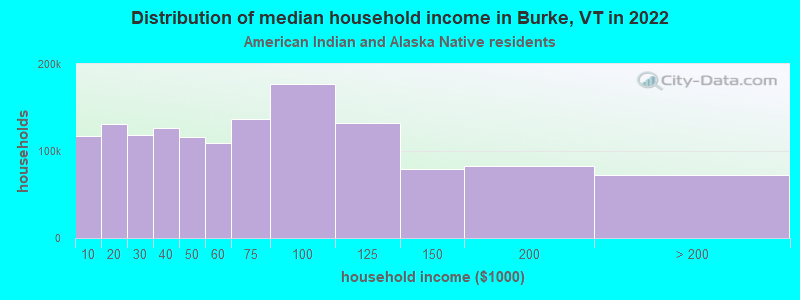
- $122,583American Indian and Alaska Native householders
- $195,321Some other race householders
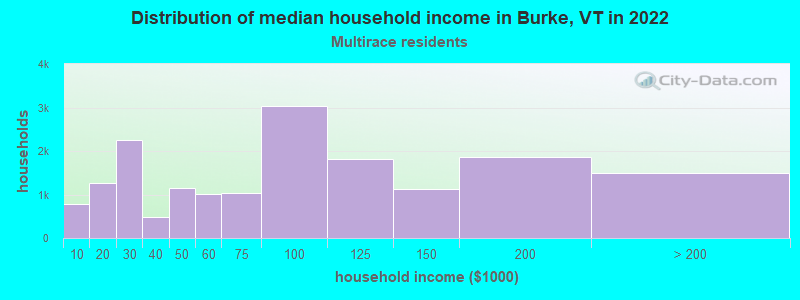
- $83,319Two or more races householders
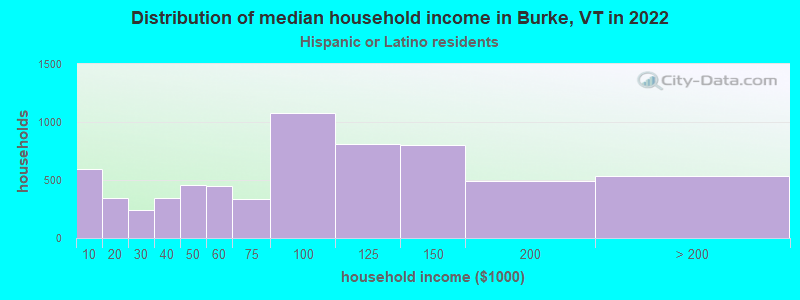
- $98,712Hispanic or Latino race householders
- Median 2022 house value
- $218,567White Non-Hispanic householders
- $244,569Two or more races householders
Household income for White non-Hispanic householders
Household income for American Indian and Alaska Native householders
Household income for Two or more races householders
Household income for Hispanic or Latino race householders
Foreign-born residents in Burke
35 residents are foreign born (1.3% North America, 0.8% Europe).
| This city: | 2.2% |
| Vermont: | 3.8% |
Ancestries in Burke

- 27516.3%English
- 24314.4%Irish
- 23313.8%French
- 1539.1%French Canadian
- 1438.5%Other
- 1347.9%German
- 1347.9%United States
- 895.3%Scottish
- 573.4%Italian
- 402.4%Scotch-Irish
- 372.2%Polish
- 261.5%Welsh
- 231.4%Norwegian
- 160.9%Swedish
- 140.8%Dutch
- 130.8%Slovak
- 90.5%Danish
- 90.5%Russian
- 80.5%Hungarian
- 60.4%Portuguese
- 60.4%Swiss
- 60.4%Ukrainian
- 50.3%Lithuanian
- 40.2%Arab
- 40.2%Greek

Zip codes: 05871.