Races in Carson City, Nevada (NV) Detailed Stats
Data:
Races - White alone (%)
Races - White alone (% change since 2000)
Races - Black alone (%)
Races - Black alone (% change since 2000)
Races - American Indian alone (%)
Races - American Indian alone (% change since 2000)
Races - Asian alone (%)
Races - Asian alone (% change since 2000)
Races - Hispanic (%)
Races - Hispanic (% change since 2000)
Races - Native Hawaiian and Other Pacific Islander alone (%)
Races - Native Hawaiian and Other Pacific Islander alone (% change since 2000)
Races - Two or more races(%)
Races - Two or more races(% change since 2000)
Races - Other race alone (%)
Races - Other race alone (% change since 2000)
Racial diversity
Place of birth - Born in state of residence (%)
Place of birth - Born in state of residence (%) - White
Place of birth - Born in state of residence (%) - Black or African American
Place of birth - Born in state of residence (%) - Asian
Place of birth - Born in state of residence (%) - Hispanic or Latino
Place of birth - Born in state of residence (%) - American Indian and Alaska Native
Place of birth - Born in state of residence (%) - Multirace
Place of birth - Born in state of residence (%) - Other Race
Place of birth - Born in other state (%)
Place of birth - Born in other state (%) - White
Place of birth - Born in other state (%) - Black or African American
Place of birth - Born in other state (%) - Asian
Place of birth - Born in other state (%) - Hispanic or Latino
Place of birth - Born in other state (%) - American Indian and Alaska Native
Place of birth - Born in other state (%) - Multirace
Place of birth - Born in other state (%) - Other Race
Place of birth - Native, outside of US (%)
Place of birth - Native, outside of US (%) - White
Place of birth - Native, outside of US (%) - Black or African American
Place of birth - Native, outside of US (%) - Asian
Place of birth - Native, outside of US (%) - Hispanic or Latino
Place of birth - Native, outside of US (%) - American Indian and Alaska Native
Place of birth - Native, outside of US (%) - Multirace
Place of birth - Native, outside of US (%) - Other Race
Place of birth - Foreign born (%)
Place of birth - Foreign born (%) - White
Place of birth - Foreign born (%) - Black or African American
Place of birth - Foreign born (%) - Asian
Place of birth - Foreign born (%) - Hispanic or Latino
Place of birth - Foreign born (%) - American Indian and Alaska Native
Place of birth - Foreign born (%) - Multirace
Place of birth - Foreign born (%) - Other Race
Residents speaking English at home (%)
Residents speaking English at home - Born in the United States (%)
Residents speaking English at home - Native, born elsewhere (%)
Residents speaking English at home - Foreign born (%)
Residents speaking Spanish at home (%)
Residents speaking Spanish at home - Born in the United States (%)
Residents speaking Spanish at home - Native, born elsewhere (%)
Residents speaking Spanish at home - Foreign born (%)
Residents speaking other language at home (%)
Residents speaking other language at home - Born in the United States (%)
Residents speaking other language at home - Native, born elsewhere (%)
Residents speaking other language at home - Foreign born (%)
Marital status - Never married (%)
Marital status - Now married (%)
Marital status - Separated (%)
Marital status - Widowed (%)
Marital status - Divorced (%)
Ancestries Reported - Arab (%)
Ancestries Reported - Czech (%)
Ancestries Reported - Danish (%)
Ancestries Reported - Dutch (%)
Ancestries Reported - English (%)
Ancestries Reported - French (%)
Ancestries Reported - French Canadian (%)
Ancestries Reported - German (%)
Ancestries Reported - Greek (%)
Ancestries Reported - Hungarian (%)
Ancestries Reported - Irish (%)
Ancestries Reported - Italian (%)
Ancestries Reported - Lithuanian (%)
Ancestries Reported - Norwegian (%)
Ancestries Reported - Polish (%)
Ancestries Reported - Portuguese (%)
Ancestries Reported - Russian (%)
Ancestries Reported - Scotch-Irish (%)
Ancestries Reported - Scottish (%)
Ancestries Reported - Slovak (%)
Ancestries Reported - Subsaharan African (%)
Ancestries Reported - Swedish (%)
Ancestries Reported - Swiss (%)
Ancestries Reported - Ukrainian (%)
Ancestries Reported - United States (%)
Ancestries Reported - Welsh (%)
Ancestries Reported - West Indian (%)
Ancestries Reported - Other (%)
Geographical mobility - Same house 1 year ago (%)
Geographical mobility - Same house 1 year ago (%) - White
Geographical mobility - Same house 1 year ago (%) - Black or African American
Geographical mobility - Same house 1 year ago (%) - Asian
Geographical mobility - Same house 1 year ago (%) - Hispanic or Latino
Geographical mobility - Same house 1 year ago (%) - American Indian and Alaska Native
Geographical mobility - Same house 1 year ago (%) - Multirace
Geographical mobility - Same house 1 year ago (%) - Other Race
Geographical mobility - Moved within same county (%)
Geographical mobility - Moved within same county (%) - White
Geographical mobility - Moved within same county (%) - Black or African American
Geographical mobility - Moved within same county (%) - Asian
Geographical mobility - Moved within same county (%) - Hispanic or Latino
Geographical mobility - Moved within same county (%) - American Indian and Alaska Native
Geographical mobility - Moved within same county (%) - Multirace
Geographical mobility - Moved within same county (%) - Other Race
Geographical mobility - Moved from different county within same state (%)
Geographical mobility - Moved from different county within same state (%) - White
Geographical mobility - Moved from different county within same state (%) - Black or African American
Geographical mobility - Moved from different county within same state (%) - Asian
Geographical mobility - Moved from different county within same state (%) - Hispanic or Latino
Geographical mobility - Moved from different county within same state (%) - American Indian and Alaska Native
Geographical mobility - Moved from different county within same state (%) - Multirace
Geographical mobility - Moved from different county within same state (%) - Other Race
Geographical mobility - Moved from different state (%)
Geographical mobility - Moved from different state (%) - White
Geographical mobility - Moved from different state (%) - Black or African American
Geographical mobility - Moved from different state (%) - Asian
Geographical mobility - Moved from different state (%) - Hispanic or Latino
Geographical mobility - Moved from different state (%) - American Indian and Alaska Native
Geographical mobility - Moved from different state (%) - Multirace
Geographical mobility - Moved from different state (%) - Other Race
Geographical mobility - Moved from abroad (%)
Geographical mobility - Moved from abroad (%) - White
Geographical mobility - Moved from abroad (%) - Black or African American
Geographical mobility - Moved from abroad (%) - Asian
Geographical mobility - Moved from abroad (%) - Hispanic or Latino
Geographical mobility - Moved from abroad (%) - American Indian and Alaska Native
Geographical mobility - Moved from abroad (%) - Multirace
Geographical mobility - Moved from abroad (%) - Other Race
Place of birth for the foreign-born population - Ireland (%)
Place of birth for the foreign-born population - Denmark (%)
Place of birth for the foreign-born population - Norway (%)
Place of birth for the foreign-born population - Sweden (%)
Place of birth for the foreign-born population - United Kingdom (%)
Place of birth for the foreign-born population - England (%)
Place of birth for the foreign-born population - Scotland (%)
Place of birth for the foreign-born population - Other Northern Europe (%)
Place of birth for the foreign-born population - Austria (%)
Place of birth for the foreign-born population - Belgium (%)
Place of birth for the foreign-born population - France (%)
Place of birth for the foreign-born population - Germany (%)
Place of birth for the foreign-born population - Netherlands (%)
Place of birth for the foreign-born population - Switzerland (%)
Place of birth for the foreign-born population - Other Western Europe (%)
Place of birth for the foreign-born population - Greece (%)
Place of birth for the foreign-born population - Italy (%)
Place of birth for the foreign-born population - Portugal (%)
Place of birth for the foreign-born population - Spain (%)
Place of birth for the foreign-born population - Other Southern Europe (%)
Place of birth for the foreign-born population - Albania (%)
Place of birth for the foreign-born population - Belarus (%)
Place of birth for the foreign-born population - Bosnia and Herzegovina (%)
Place of birth for the foreign-born population - Bulgaria (%)
Place of birth for the foreign-born population - Croatia (%)
Place of birth for the foreign-born population - Czechoslovakia (%)
Place of birth for the foreign-born population - Hungary (%)
Place of birth for the foreign-born population - Latvia (%)
Place of birth for the foreign-born population - Lithuania (%)
Place of birth for the foreign-born population - North Macedonia (Macedonia) (%)
Place of birth for the foreign-born population - Moldova (%)
Place of birth for the foreign-born population - Poland (%)
Place of birth for the foreign-born population - Romania (%)
Place of birth for the foreign-born population - Russia (%)
Place of birth for the foreign-born population - Serbia (%)
Place of birth for the foreign-born population - Ukraine (%)
Place of birth for the foreign-born population - Other Eastern Europe (%)
Place of birth for the foreign-born population - China (%)
Place of birth for the foreign-born population - Hong Kong (%)
Place of birth for the foreign-born population - Taiwan (%)
Place of birth for the foreign-born population - Japan (%)
Place of birth for the foreign-born population - Korea (%)
Place of birth for the foreign-born population - Other Eastern Asia (%)
Place of birth for the foreign-born population - Afghanistan (%)
Place of birth for the foreign-born population - Bangladesh (%)
Place of birth for the foreign-born population - India (%)
Place of birth for the foreign-born population - Iran (%)
Place of birth for the foreign-born population - Kazakhstan (%)
Place of birth for the foreign-born population - Nepal (%)
Place of birth for the foreign-born population - Pakistan (%)
Place of birth for the foreign-born population - Sri Lanka (%)
Place of birth for the foreign-born population - Uzbekistan (%)
Place of birth for the foreign-born population - Other South Central Asia (%)
Place of birth for the foreign-born population - Burma (%)
Place of birth for the foreign-born population - Cambodia (%)
Place of birth for the foreign-born population - Indonesia (%)
Place of birth for the foreign-born population - Laos (%)
Place of birth for the foreign-born population - Malaysia (%)
Place of birth for the foreign-born population - Philippines (%)
Place of birth for the foreign-born population - Singapore (%)
Place of birth for the foreign-born population - Thailand (%)
Place of birth for the foreign-born population - Vietnam (%)
Place of birth for the foreign-born population - Other South Eastern Asia (%)
Place of birth for the foreign-born population - Armenia (%)
Place of birth for the foreign-born population - Iraq (%)
Place of birth for the foreign-born population - Israel (%)
Place of birth for the foreign-born population - Jordan (%)
Place of birth for the foreign-born population - Kuwait (%)
Place of birth for the foreign-born population - Lebanon (%)
Place of birth for the foreign-born population - Saudi Arabia (%)
Place of birth for the foreign-born population - Syria (%)
Place of birth for the foreign-born population - Turkey (%)
Place of birth for the foreign-born population - Yemen (%)
Place of birth for the foreign-born population - Other Western Asia (%)
Place of birth for the foreign-born population - Eritrea (%)
Place of birth for the foreign-born population - Ethiopia (%)
Place of birth for the foreign-born population - Kenya (%)
Place of birth for the foreign-born population - Somalia (%)
Place of birth for the foreign-born population - Uganda (%)
Place of birth for the foreign-born population - Zimbabwe (%)
Place of birth for the foreign-born population - Other Eastern Africa (%)
Place of birth for the foreign-born population - Cameroon (%)
Place of birth for the foreign-born population - Congo (%)
Place of birth for the foreign-born population - Democratic Republic of Congo (Zaire) (%)
Place of birth for the foreign-born population - Other Middle Africa (%)
Place of birth for the foreign-born population - Egypt (%)
Place of birth for the foreign-born population - Morocco (%)
Place of birth for the foreign-born population - Sudan (%)
Place of birth for the foreign-born population - Other Northern Africa (%)
Place of birth for the foreign-born population - South Africa (%)
Place of birth for the foreign-born population - Other Southern Africa (%)
Place of birth for the foreign-born population - Cabo Verde (%)
Place of birth for the foreign-born population - Ghana (%)
Place of birth for the foreign-born population - Liberia (%)
Place of birth for the foreign-born population - Nigeria (%)
Place of birth for the foreign-born population - Senegal (%)
Place of birth for the foreign-born population - Sierra Leone (%)
Place of birth for the foreign-born population - Other Western Africa (%)
Place of birth for the foreign-born population - Australia (%)
Place of birth for the foreign-born population - New Zealand (%)
Place of birth for the foreign-born population - Fiji (%)
Place of birth for the foreign-born population - Micronesia (%)
Place of birth for the foreign-born population - Bahamas (%)
Place of birth for the foreign-born population - Barbados (%)
Place of birth for the foreign-born population - Cuba (%)
Place of birth for the foreign-born population - Dominica (%)
Place of birth for the foreign-born population - Dominican Republic (%)
Place of birth for the foreign-born population - Grenada (%)
Place of birth for the foreign-born population - Haiti (%)
Place of birth for the foreign-born population - Jamaica (%)
Place of birth for the foreign-born population - St. Vincent and the Grenadines (%)
Place of birth for the foreign-born population - Trinidad and Tobago (%)
Place of birth for the foreign-born population - West Indies (%)
Place of birth for the foreign-born population - Other Caribbean (%)
Place of birth for the foreign-born population - Belize (%)
Place of birth for the foreign-born population - Costa Rica (%)
Place of birth for the foreign-born population - El Salvador (%)
Place of birth for the foreign-born population - Guatemala (%)
Place of birth for the foreign-born population - Honduras (%)
Place of birth for the foreign-born population - Mexico (%)
Place of birth for the foreign-born population - Nicaragua (%)
Place of birth for the foreign-born population - Panama (%)
Place of birth for the foreign-born population - Other Central America (%)
Place of birth for the foreign-born population - Argentina (%)
Place of birth for the foreign-born population - Bolivia (%)
Place of birth for the foreign-born population - Brazil (%)
Place of birth for the foreign-born population - Chile (%)
Place of birth for the foreign-born population - Colombia (%)
Place of birth for the foreign-born population - Ecuador (%)
Place of birth for the foreign-born population - Guyana (%)
Place of birth for the foreign-born population - Peru (%)
Place of birth for the foreign-born population - Uruguay (%)
Place of birth for the foreign-born population - Venezuela (%)
Place of birth for the foreign-born population - Other South America (%)
Place of birth for the foreign-born population - Canada (%)
Place of birth for the foreign-born population - Other Northern America (%)
Place of birth for the foreign-born population - Other (%)
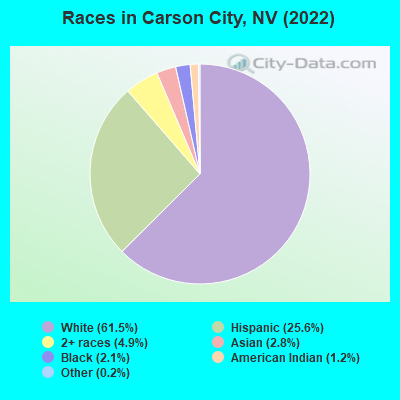
According to 2022 data, the most numerous races in Carson City, NV are White alone (36,664 residents), Hispanic (15,255 residents), and Black alone (1,269 residents). 78.0% of Carson City residents speak English at home. 12.9% of Carson City, NV residents are foreign-born (9.2% born in Latin America, 1.9% born in Asia), which is 39.0% less than the foreign-born rate of 18.0% across the entire state of Nevada.
Race distribution in Carson City
2000 2022
1,303,001 65.2% White alone 393,970 19.7% Hispanic 131,509 6.6% Black alone 88,593 4.4% Asian alone 49,231 2.5% Two or more races 21,397 1.1% American Indian alone 7,769 0.4% Native Hawaiian and Other 2,787 0.1% Other race alone
1,410,145 44.4% White alone 961,357 30.3% Hispanic 286,471 9.0% Black alone 281,149 8.8% Asian alone 182,151 5.7% Two or more races 20,102 0.6% Native Hawaiian and Other 18,781 0.6% Other race alone 17,616 0.6% American Indian alone
Income and house value in Carson City Median household income in 2022 $67,382 White non-Hispanic householders$142,977 Black householders$74,613 American Indian and Alaska Native householders$70,934 Asian householders$55,299 Some other race householders$63,598 Two or more races householders$65,986 Hispanic or Latino race householdersMedian 2022 house value $494,148 White Non-Hispanic householders$494,148 Black or African American householders$389,116 American Indian or Alaska Native householders $546,830 Asian householders$458,470 Native Hawaiian and other Pacific Islander householders$414,791 Some other race householders$411,123 Two or more races householders$447,800 Hispanic or Latino householders
Median age by race in Carson City
49.0 Median age for White residents45.4 52.3 36.0 Median age for Black or African American residents35.9 36.4 40.3 Median age for American Indian / Alaska Native residents42.6 34.9 42.1 Median age for Asian residents40.5 42.5 21.2 Median age for Native Hawaiian / Pacific Islander residents19.0 60.2 31.5 Median age for Other race residents33.9 27.7 33.9 Median age for Two or more races residents37.3 25.7 51.0 Median age for White alone residents48.7 53.4 29.1 Median age for Hispanic or Latino residents29.9 27.9
Owner/renter occupied households by race in Carson City
House owners and renters - White residents 12,020 66.7% Owner occupied5,998 33.3% Renter occupiedHouse owners and renters - Black or African American residents 76 45.0% Owner occupied93 55.0% Renter occupiedHouse owners and renters - American Indian / Alaska Native residents 282 65.5% Owner occupied148 34.5% Renter occupiedHouse owners and renters - Asian residents 451 74.0% Owner occupied159 26.0% Renter occupiedHouse owners and renters - Native Hawaiian / Pacific Islander residents 4 100.0% Owner occupiedHouse owners and renters - Other race residents 842 54.2% Owner occupied711 45.8% Renter occupiedHouse owners and renters - Two or more races residents 1,156 46.4% Owner occupied1,335 53.6% Renter occupiedHouse owners and renters - White alone residents 11,683 67.4% Owner occupied5,645 32.6% Renter occupiedHouse owners and renters - Hispanic or Latino residents 2,203 51.9% Owner occupied2,044 48.1% Renter occupied
Language usage in Carson City
English speakers - Total 78.0% of residents of Carson City speak English at home.
18.0% of residents speak Spanish at home 7,012 68.7% Speak English very well3,192 31.3% Speak English less than very well4.0% of residents speak other language at home 1,610 70.9% Speak English very well661 29.1% Speak English less than very well
English speakers - Born in the United States 92.2% of residents of Carson City speak English at home.
6.6% of residents speak Spanish at home 1,671 80.8% Speak English very well398 19.2% Speak English less than very well1.2% of residents speak other language at home 341 92.7% Speak English very well27 7.3% Speak English less than very well
English speakers - Native, born elsewhere 44.6% of residents of Carson City speak English at home.
36.7% of residents speak Spanish at home 232 78.9% Speak English very well62 21.1% Speak English less than very well21.2% of residents speak other language at home 170 100.0% Speak English very well
English speakers - Foreign-born 14.4% of residents of Carson City speak English at home.
67.5% of residents speak Spanish at home 2,676 51.5% Speak English very well2,521 48.5% Speak English less than very well18.8% of residents speak other language at home 842 58.2% Speak English very well605 41.8% Speak English less than very well
White (Caucasian) - Speak only English Native:
97.1% (35,016)Foreign-born:
35.2% (595)
White (Caucasian) - Speak another language Native:
4.0% (1,437)Foreign-born:
65.0% (1,098)
Black or African American - Speak only English Native:
93.4% (870)Foreign-born:
1.0% (2)
Black or African American - Speak another language Native:
5.9% (55)Foreign-born:
99.7% (247)
American Indian / Alaska Native - Speak another language Native:
20.3% (242)Foreign-born:
100.0% (134)
Asian - Speak only English Native:
46.7% (259)Foreign-born:
14.3% (159)
Asian - Speak another language Native:
50.4% (279)Foreign-born:
85.7% (957)
Other race - Speak only English Native:
20.5% (541)Foreign-born:
9.8% (211)
Other race - Speak another language Native:
80.1% (2,111)Foreign-born:
90.2% (1,943)
Two or more races - Speak only English Native:
72.2% (4,433)Foreign-born:
5.1% (111)
Two or more races - Speak another language Native:
27.2% (1,670)Foreign-born:
95.2% (2,084)
White alone - Speak only English Native:
98.3% (33,892)Foreign-born:
71.5% (621)
White alone - Speak another language Native:
1.8% (604)Foreign-born:
27.5% (239)
Hispanic or Latino - Speak only English Native:
46.8% (4,037)Foreign-born:
5.1% (273)
Hispanic or Latino - Speak another language Native:
53.2% (4,592)Foreign-born:
95.0% (5,132)
Foreign-born residents in Carson City 7,719 residents are foreign born (9.2% Latin America , 1.9% Asia ).
This city:
12.9%Nevada:
19.1%
Marital status for residents in Carson City Marital status - White (Caucasian) population 15 years and over
Males 33.0% Never married45.8% Now married1.0% Separated3.2% Widowed17.0% DivorcedFemales 18.5% Never married46.2% Now married2.2% Separated15.1% Widowed18.1% DivorcedWomen who gave birth in the past 12 months Now married:
75.2% (313)Unmarried:
24.8% (103)
Women who did not give birth in the past 12 months Now married:
46.2% (2,993)Unmarried:
53.8% (3,482)
Marital status - Black or African American population 15 years and over
Males 51.5% Never married34.8% Now married9.0% Separated0.0% Widowed4.7% DivorcedFemales 34.3% Never married43.5% Now married7.8% Separated6.5% Widowed7.8% DivorcedWomen who gave birth in the past 12 months Now married:
100.0% (28)Unmarried:
0.0% (0)
Women who did not give birth in the past 12 months Now married:
47.9% (71)Unmarried:
52.1% (77)
Marital status - American Indian / Alaska Native population 15 years and over
Males 55.9% Never married32.5% Now married0.0% Separated6.5% Widowed5.1% DivorcedFemales 46.4% Never married32.8% Now married2.2% Separated7.5% Widowed11.1% DivorcedWomen who gave birth in the past 12 months Now married:
0.0% (0)Unmarried:
100.0% (11)
Women who did not give birth in the past 12 months Now married:
31.6% (136)Unmarried:
68.4% (295)
Marital status - Asian population 15 years and over
Males 32.6% Never married59.9% Now married4.7% Separated2.6% Widowed0.3% DivorcedFemales 13.7% Never married64.9% Now married0.0% Separated15.2% Widowed6.2% DivorcedWomen who gave birth in the past 12 months Now married:
100.0% (64)Unmarried:
0.0% (0)
Women who did not give birth in the past 12 months Now married:
65.0% (209)Unmarried:
35.0% (113)
Marital status - Native Hawaiian / Pacific Islander population 15 years and over
Males 100.0% Never married0.0% Now married0.0% Separated0.0% Widowed0.0% DivorcedFemales 33.3% Never married66.7% Now married0.0% Separated0.0% Widowed0.0% DivorcedWomen who did not give birth in the past 12 months Now married:
0.0% (0)Unmarried:
100.0% (2)
Marital status - Other race population 15 years and over
Males 39.9% Never married45.6% Now married6.6% Separated1.0% Widowed6.9% DivorcedFemales 42.0% Never married43.8% Now married8.4% Separated3.3% Widowed2.5% DivorcedWomen who gave birth in the past 12 months Now married:
99.5% (198)Unmarried:
0.5% (1)
Women who did not give birth in the past 12 months Now married:
37.8% (451)Unmarried:
62.2% (742)
Marital status - Two or more races population 15 years and over
Males 46.4% Never married39.7% Now married3.5% Separated0.2% Widowed10.2% DivorcedFemales 44.2% Never married36.7% Now married3.1% Separated3.3% Widowed12.7% DivorcedWomen who gave birth in the past 12 months Now married:
100.0% (48)Unmarried:
0.0% (0)
Women who did not give birth in the past 12 months Now married:
25.0% (472)Unmarried:
75.0% (1,414)
Marital status - White alone, not Hispanic / Latino population 15 years and over
Males 31.2% Never married46.9% Now married1.0% Separated3.6% Widowed17.3% DivorcedFemales 16.7% Never married47.2% Now married1.9% Separated15.5% Widowed18.7% DivorcedWomen who gave birth in the past 12 months Now married:
89.9% (309)Unmarried:
10.1% (35)
Women who did not give birth in the past 12 months Now married:
46.1% (2,716)Unmarried:
53.9% (3,170)
Marital status - Hispanic or Latino population 15 years and over
Males 46.5% Never married41.2% Now married3.7% Separated0.2% Widowed8.3% DivorcedFemales 39.4% Never married41.5% Now married4.3% Separated5.8% Widowed9.0% DivorcedWomen who gave birth in the past 12 months Now married:
74.4% (253)Unmarried:
25.6% (87)
Women who did not give birth in the past 12 months Now married:
40.3% (1,399)Unmarried:
59.7% (2,075)
Ancestries in Carson City
3,100 10.4% English2,620 8.8% American1,950 6.5% German1,493 5.0% Irish821 2.8% Italian561 1.9% European533 1.8% Polish437 1.5% Scottish327 1.1% African264 0.9% French181 0.6% Portuguese176 0.6% Ukrainian174 0.6% Swiss170 0.6% Scotch-Irish166 0.6% Norwegian154 0.5% Swedish112 0.4% French Canadian93 0.3% Scandinavian92 0.3% Basque89 0.3% Hungarian89 0.3% Eastern European87 0.3% Danish79 0.3% British69 0.2% Dutch58 0.2% Welsh56 0.2% Croatian39 0.1% Czechoslovakian38 0.1% Brazilian31 0.1% Arab30 0.1% Greek29 0.10% Austrian29 0.10% Czech29 0.10% Belgian28 0.09% Northern European28 0.09% Finnish26 0.09% Lebanese18 0.06% Yugoslavian15 0.05% Sudanese12 0.04% Russian11 0.04% Romanian9 0.03% Latvian6 0.02% Canadian6 0.02% New Zealander6 0.02% Pennsylvania German4 0.01% Slovak
Geographical mobility in Carson City Same house 1 year ago 34,032 87.9% White (Caucasian)625 50.5% Black or African American1,185 86.0% American Indian / Alaska Native1,482 87.6% Asian11 78.3% Native Hawaiian / Pacific Islander4,803 94.5% Other race7,275 84.0% Two or more races32,022 88.0% White alone, not Hispanic / Latino13,622 90.9% Hispanic or LatinoMoved within same county 2,013 5.2% White / Caucasian54 4.3% Black or African American23 1.7% American Indian / Alaska Native11 0.7% Asian36 0.7% Other race542 6.3% Two or more races1,681 4.6% White alone, not Hispanic / Latino810 5.4% Hispanic or LatinoMoved within same state 1,946 5.0% White / Caucasian453 36.6% Black or African American120 8.7% American Indian / Alaska Native77 4.5% Asian4 31.7% Native Hawaiian / Pacific Islander160 3.1% Other race122 1.4% Two or more races1,855 5.1% White alone, not Hispanic / Latino300 2.0% Hispanic or LatinoMoved from different state 1,005 2.6% White / Caucasian27 2.2% Black or African American27 2.0% American Indian / Alaska Native147 8.7% Asian163 3.2% Other race604 7.0% Two or more races985 2.7% White alone, not Hispanic / Latino318 2.1% Hispanic or LatinoMoved from abroad 55 0.1% White2 0.2% American Indian / Alaska Native71 0.2% White alone, not Hispanic / Latino
Children Nativity (place of birth) in Carson City
Children under 6 years - Living with two parents Both parents native 1,509 100.0% NativeBoth parents foreign-born 354 97.9% Native7 2.1% Foreign-bornOne native, one foreign-born parent 187 100.0% NativeChildren under 6 years - Living with one parent Native parent 1,176 100.0% NativeForeign-born parent 208 93.1% Native15 6.9% Foreign-bornChildren 6 to 17 years - Living with two parents Both parents native 2,833 100.0% NativeBoth parents foreign-born 953 85.7% Native160 14.3% Foreign-bornOne native, one foreign-born parent 366 100.0% NativeChildren 6 to 17 years - Living with one parent Native parent 2,489 100.0% NativeForeign-born parent 715 50.0% Native715 50.0% Foreign-born
Grandparents responsible for own grandchildren in Carson City
Grandparents (30 to 59 years) White / Caucasian 24 12.5% Responsible for grandchildren165 87.5% Not responsible for grandchildrenBlack or African American 25 54.0% Responsible for grandchildren21 46.0% Not responsible for grandchildrenAmerican Indian / Alaska Native 8 49.7% Responsible for grandchildren8 50.3% Not responsible for grandchildrenAsian 28 100.0% Not responsible for grandchildrenOther race 114 62.3% Responsible for grandchildren69 37.7% Not responsible for grandchildrenTwo or more races 9 47.3% Responsible for grandchildren10 52.7% Not responsible for grandchildrenWhite alone, not Hispanic / Latino 32 15.5% Responsible for grandchildren177 84.5% Not responsible for grandchildrenHispanic or Latino 65 43.0% Responsible for grandchildren87 57.0% Not responsible for grandchildrenGrandparents (60 years and over) White / Caucasian 109 24.4% Responsible for grandchildren336 75.6% Not responsible for grandchildrenBlack or African American 23 100.0% Responsible for grandchildrenAmerican Indian / Alaska Native 22 45.0% Responsible for grandchildren27 55.0% Not responsible for grandchildrenAsian 34 100.0% Not responsible for grandchildrenOther race 117 100.0% Not responsible for grandchildrenTwo or more races 18 25.5% Responsible for grandchildren51 74.5% Not responsible for grandchildrenWhite alone, not Hispanic / Latino 118 26.9% Responsible for grandchildren322 73.1% Not responsible for grandchildrenHispanic or Latino 9 4.6% Responsible for grandchildren191 95.4% Not responsible for grandchildren