Races in Coast Range, Oregon (OR) Detailed Stats
Ancestries, Foreign-born residents, place of birth
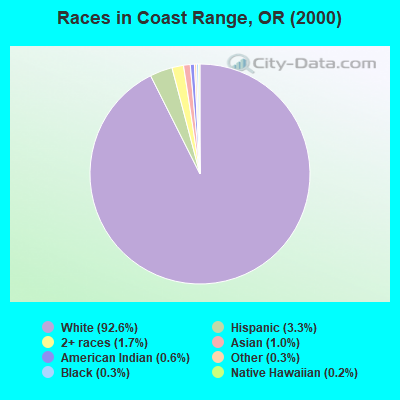
Race distribution in Coast Range

- 7,22492.6%White alone
- 2573.3%Hispanic
- 1291.7%Two or more races
- 791.0%Asian alone
- 490.6%American Indian alone
- 200.3%Black alone
- 270.3%Other race alone
- 130.2%Native Hawaiian and Other
Pacific Islander alone
2000
2022
-
- 2,857,61683.5%White alone
- 275,3148.0%Hispanic
- 100,3332.9%Asian alone
- 82,7332.4%Two or more races
- 53,3251.6%Black alone
- 40,1301.2%American Indian alone
- 7,3980.2%Native Hawaiian and Other
Pacific Islander alone - 4,5500.1%Other race alone

-
- 3,037,57171.6%White alone
- 609,53814.4%Hispanic
- 252,7446.0%Two or more races
- 191,2834.5%Asian alone
- 78,2281.8%Black alone
- 29,3990.7%American Indian alone
- 25,7310.6%Other race alone
- 15,6430.4%Native Hawaiian and Other
Pacific Islander alone

Income and house value in Coast Range
- Median household income in 2022
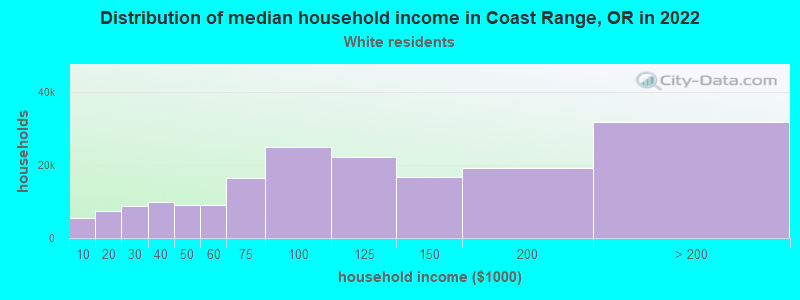
- $106,393White non-Hispanic householders
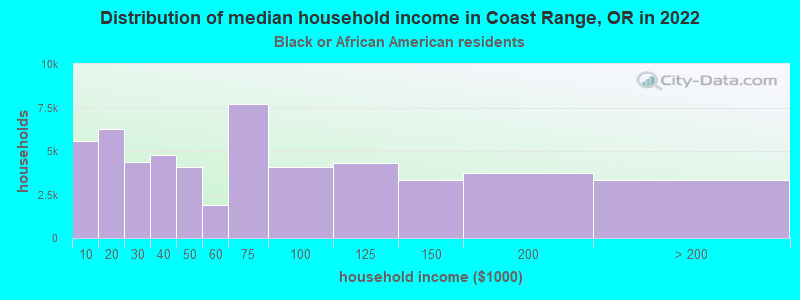
- $82,038Black householders
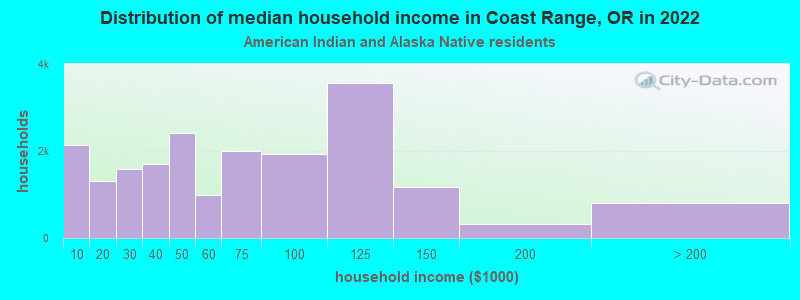
- $111,821American Indian and Alaska Native householders
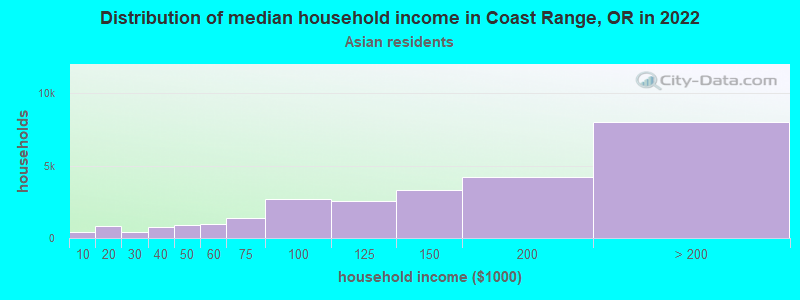
- $147,569Asian householders
- $76,112Some other race householders
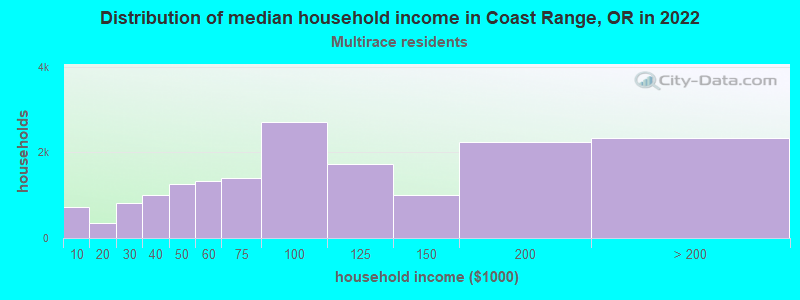
- $70,495Two or more races householders
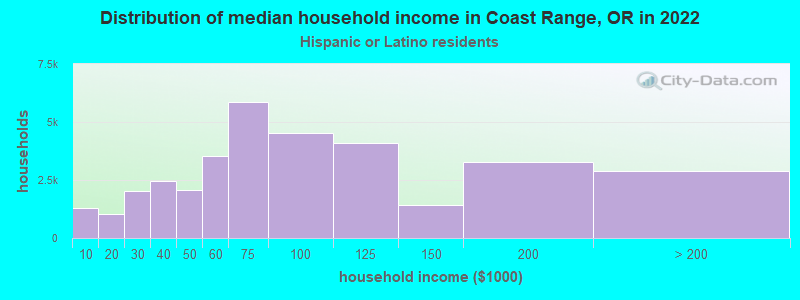
- $83,781Hispanic or Latino race householders
- Median 2022 house value
- $663,518White Non-Hispanic householders
- $448,323Black or African American householders
- $456,474American Indian or Alaska Native householders
- $745,357Asian householders
- $407,566Some other race householders
- $585,917Two or more races householders
- $484,515Hispanic or Latino householders
Household income for White non-Hispanic householders
Household income for Black householders
Household income for American Indian and Alaska Native householders
Household income for Asian householders
Household income for Two or more races householders
Household income for Hispanic or Latino race householders
Zip code: 97117