Races in Conroe, Texas (TX) Detailed Stats
Data:
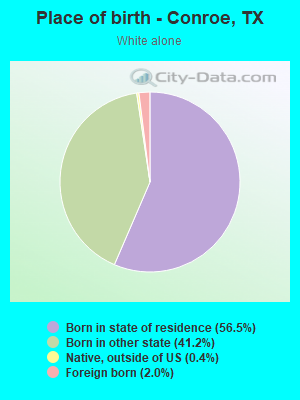
Races - White alone (%)
Races - White alone (% change since 2000)
Races - Black alone (%)
Races - Black alone (% change since 2000)
Races - American Indian alone (%)
Races - American Indian alone (% change since 2000)
Races - Asian alone (%)
Races - Asian alone (% change since 2000)
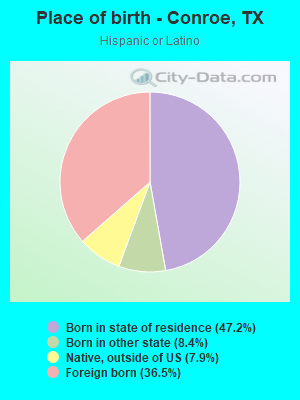
Races - Hispanic (%)
Races - Hispanic (% change since 2000)
Races - Native Hawaiian and Other Pacific Islander alone (%)
Races - Native Hawaiian and Other Pacific Islander alone (% change since 2000)
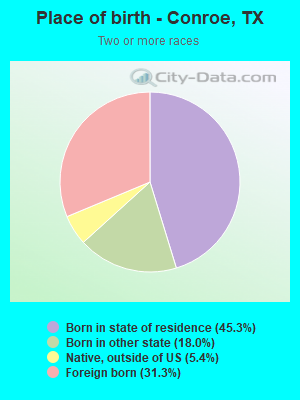
Races - Two or more races(%)
Races - Two or more races(% change since 2000)
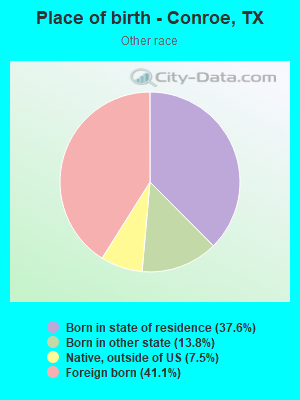
Races - Other race alone (%)
Races - Other race alone (% change since 2000)
Racial diversity
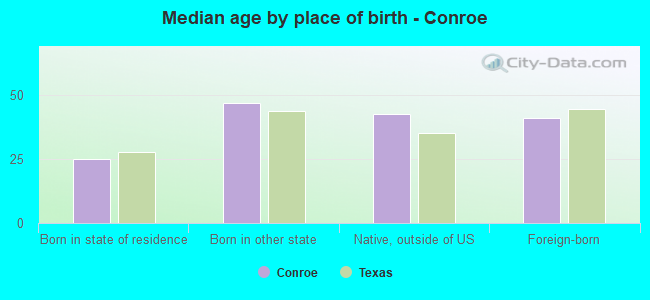
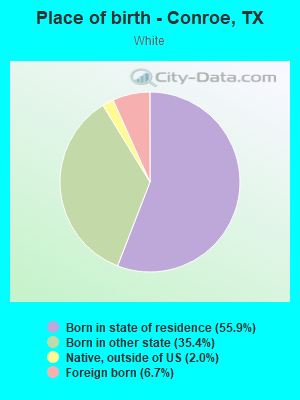
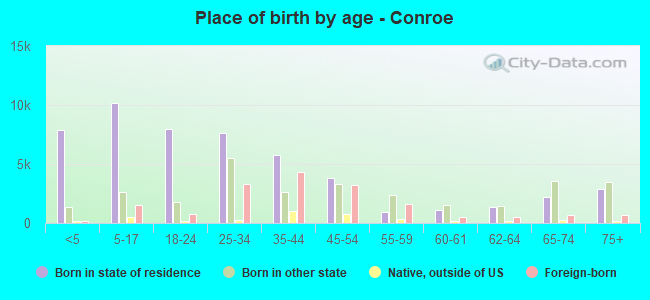
Place of birth - Born in state of residence (%)
Place of birth - Born in state of residence (%) - White
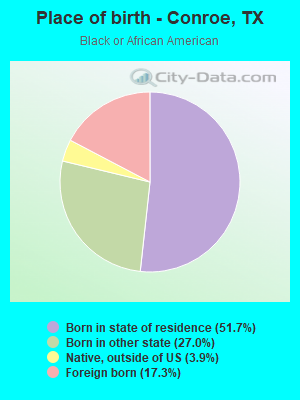
Place of birth - Born in state of residence (%) - Black or African American
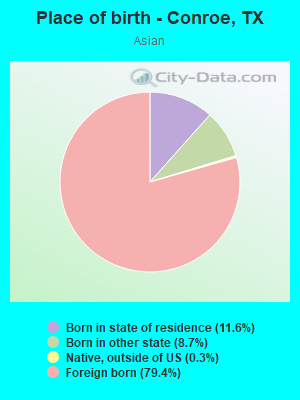
Place of birth - Born in state of residence (%) - Asian
Place of birth - Born in state of residence (%) - Hispanic or Latino
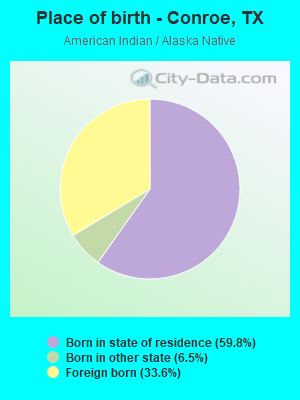
Place of birth - Born in state of residence (%) - American Indian and Alaska Native
Place of birth - Born in state of residence (%) - Multirace
Place of birth - Born in state of residence (%) - Other Race
Place of birth - Born in other state (%)
Place of birth - Born in other state (%) - White
Place of birth - Born in other state (%) - Black or African American
Place of birth - Born in other state (%) - Asian
Place of birth - Born in other state (%) - Hispanic or Latino
Place of birth - Born in other state (%) - American Indian and Alaska Native
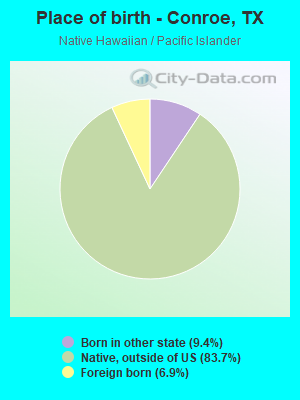
Place of birth - Born in other state (%) - Multirace
Place of birth - Born in other state (%) - Other Race
Place of birth - Native, outside of US (%)
Place of birth - Native, outside of US (%) - White
Place of birth - Native, outside of US (%) - Black or African American
Place of birth - Native, outside of US (%) - Asian
Place of birth - Native, outside of US (%) - Hispanic or Latino
Place of birth - Native, outside of US (%) - American Indian and Alaska Native
Place of birth - Native, outside of US (%) - Multirace
Place of birth - Native, outside of US (%) - Other Race
Place of birth - Foreign born (%)
Place of birth - Foreign born (%) - White
Place of birth - Foreign born (%) - Black or African American
Place of birth - Foreign born (%) - Asian
Place of birth - Foreign born (%) - Hispanic or Latino
Place of birth - Foreign born (%) - American Indian and Alaska Native
Place of birth - Foreign born (%) - Multirace
Place of birth - Foreign born (%) - Other Race
Residents speaking English at home (%)
Residents speaking English at home - Born in the United States (%)
Residents speaking English at home - Native, born elsewhere (%)
Residents speaking English at home - Foreign born (%)
Residents speaking Spanish at home (%)
Residents speaking Spanish at home - Born in the United States (%)
Residents speaking Spanish at home - Native, born elsewhere (%)
Residents speaking Spanish at home - Foreign born (%)
Residents speaking other language at home (%)
Residents speaking other language at home - Born in the United States (%)
Residents speaking other language at home - Native, born elsewhere (%)
Residents speaking other language at home - Foreign born (%)
Marital status - Never married (%)
Marital status - Now married (%)
Marital status - Separated (%)
Marital status - Widowed (%)
Marital status - Divorced (%)
Ancestries Reported - Arab (%)
Ancestries Reported - Czech (%)
Ancestries Reported - Danish (%)
Ancestries Reported - Dutch (%)
Ancestries Reported - English (%)
Ancestries Reported - French (%)
Ancestries Reported - French Canadian (%)
Ancestries Reported - German (%)
Ancestries Reported - Greek (%)
Ancestries Reported - Hungarian (%)
Ancestries Reported - Irish (%)
Ancestries Reported - Italian (%)
Ancestries Reported - Lithuanian (%)
Ancestries Reported - Norwegian (%)
Ancestries Reported - Polish (%)
Ancestries Reported - Portuguese (%)
Ancestries Reported - Russian (%)
Ancestries Reported - Scotch-Irish (%)
Ancestries Reported - Scottish (%)
Ancestries Reported - Slovak (%)
Ancestries Reported - Subsaharan African (%)
Ancestries Reported - Swedish (%)
Ancestries Reported - Swiss (%)
Ancestries Reported - Ukrainian (%)
Ancestries Reported - United States (%)
Ancestries Reported - Welsh (%)
Ancestries Reported - West Indian (%)
Ancestries Reported - Other (%)
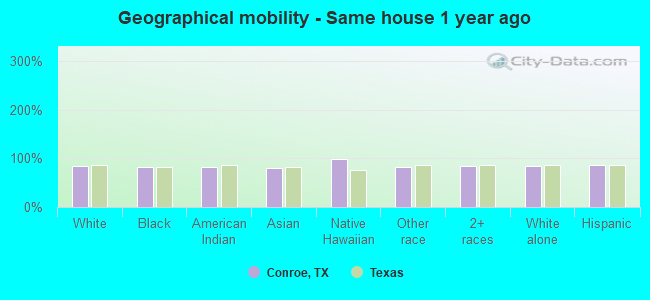
Geographical mobility - Same house 1 year ago (%)
Geographical mobility - Same house 1 year ago (%) - White
Geographical mobility - Same house 1 year ago (%) - Black or African American
Geographical mobility - Same house 1 year ago (%) - Asian
Geographical mobility - Same house 1 year ago (%) - Hispanic or Latino
Geographical mobility - Same house 1 year ago (%) - American Indian and Alaska Native
Geographical mobility - Same house 1 year ago (%) - Multirace
Geographical mobility - Same house 1 year ago (%) - Other Race
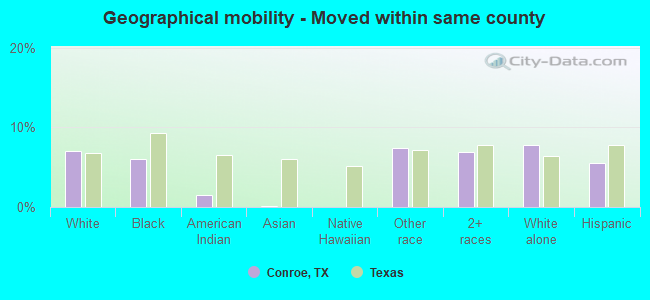
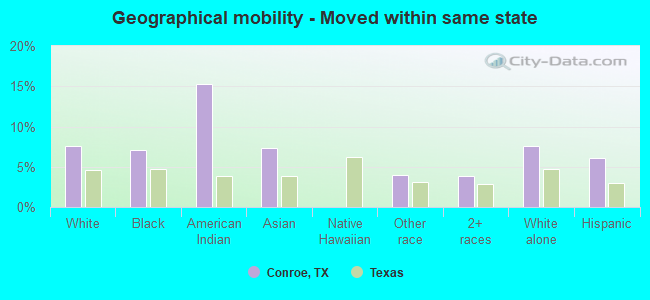
Geographical mobility - Moved within same county (%)
Geographical mobility - Moved within same county (%) - White
Geographical mobility - Moved within same county (%) - Black or African American
Geographical mobility - Moved within same county (%) - Asian
Geographical mobility - Moved within same county (%) - Hispanic or Latino
Geographical mobility - Moved within same county (%) - American Indian and Alaska Native
Geographical mobility - Moved within same county (%) - Multirace
Geographical mobility - Moved within same county (%) - Other Race
Geographical mobility - Moved from different county within same state (%)
Geographical mobility - Moved from different county within same state (%) - White
Geographical mobility - Moved from different county within same state (%) - Black or African American
Geographical mobility - Moved from different county within same state (%) - Asian
Geographical mobility - Moved from different county within same state (%) - Hispanic or Latino
Geographical mobility - Moved from different county within same state (%) - American Indian and Alaska Native
Geographical mobility - Moved from different county within same state (%) - Multirace
Geographical mobility - Moved from different county within same state (%) - Other Race
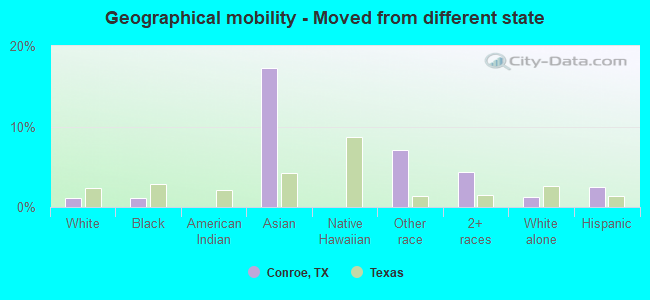
Geographical mobility - Moved from different state (%)
Geographical mobility - Moved from different state (%) - White
Geographical mobility - Moved from different state (%) - Black or African American
Geographical mobility - Moved from different state (%) - Asian
Geographical mobility - Moved from different state (%) - Hispanic or Latino
Geographical mobility - Moved from different state (%) - American Indian and Alaska Native
Geographical mobility - Moved from different state (%) - Multirace
Geographical mobility - Moved from different state (%) - Other Race
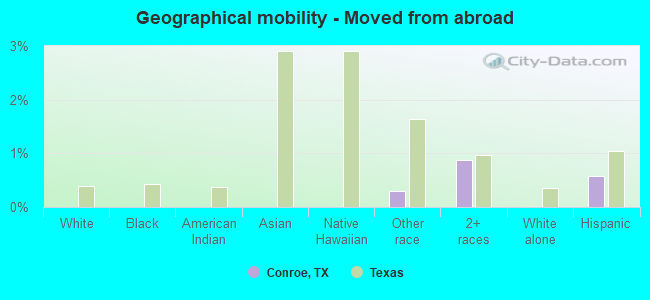
Geographical mobility - Moved from abroad (%)
Geographical mobility - Moved from abroad (%) - White
Geographical mobility - Moved from abroad (%) - Black or African American
Geographical mobility - Moved from abroad (%) - Asian
Geographical mobility - Moved from abroad (%) - Hispanic or Latino
Geographical mobility - Moved from abroad (%) - American Indian and Alaska Native
Geographical mobility - Moved from abroad (%) - Multirace
Geographical mobility - Moved from abroad (%) - Other Race
Place of birth for the foreign-born population - Ireland (%)
Place of birth for the foreign-born population - Denmark (%)
Place of birth for the foreign-born population - Norway (%)
Place of birth for the foreign-born population - Sweden (%)
Place of birth for the foreign-born population - United Kingdom (%)
Place of birth for the foreign-born population - England (%)
Place of birth for the foreign-born population - Scotland (%)
Place of birth for the foreign-born population - Other Northern Europe (%)
Place of birth for the foreign-born population - Austria (%)
Place of birth for the foreign-born population - Belgium (%)
Place of birth for the foreign-born population - France (%)
Place of birth for the foreign-born population - Germany (%)
Place of birth for the foreign-born population - Netherlands (%)
Place of birth for the foreign-born population - Switzerland (%)
Place of birth for the foreign-born population - Other Western Europe (%)
Place of birth for the foreign-born population - Greece (%)
Place of birth for the foreign-born population - Italy (%)
Place of birth for the foreign-born population - Portugal (%)
Place of birth for the foreign-born population - Spain (%)
Place of birth for the foreign-born population - Other Southern Europe (%)
Place of birth for the foreign-born population - Albania (%)
Place of birth for the foreign-born population - Belarus (%)
Place of birth for the foreign-born population - Bosnia and Herzegovina (%)
Place of birth for the foreign-born population - Bulgaria (%)
Place of birth for the foreign-born population - Croatia (%)
Place of birth for the foreign-born population - Czechoslovakia (%)
Place of birth for the foreign-born population - Hungary (%)
Place of birth for the foreign-born population - Latvia (%)
Place of birth for the foreign-born population - Lithuania (%)
Place of birth for the foreign-born population - North Macedonia (Macedonia) (%)
Place of birth for the foreign-born population - Moldova (%)
Place of birth for the foreign-born population - Poland (%)
Place of birth for the foreign-born population - Romania (%)
Place of birth for the foreign-born population - Russia (%)
Place of birth for the foreign-born population - Serbia (%)
Place of birth for the foreign-born population - Ukraine (%)
Place of birth for the foreign-born population - Other Eastern Europe (%)
Place of birth for the foreign-born population - China (%)
Place of birth for the foreign-born population - Hong Kong (%)
Place of birth for the foreign-born population - Taiwan (%)
Place of birth for the foreign-born population - Japan (%)
Place of birth for the foreign-born population - Korea (%)
Place of birth for the foreign-born population - Other Eastern Asia (%)
Place of birth for the foreign-born population - Afghanistan (%)
Place of birth for the foreign-born population - Bangladesh (%)
Place of birth for the foreign-born population - India (%)
Place of birth for the foreign-born population - Iran (%)
Place of birth for the foreign-born population - Kazakhstan (%)
Place of birth for the foreign-born population - Nepal (%)
Place of birth for the foreign-born population - Pakistan (%)
Place of birth for the foreign-born population - Sri Lanka (%)
Place of birth for the foreign-born population - Uzbekistan (%)
Place of birth for the foreign-born population - Other South Central Asia (%)
Place of birth for the foreign-born population - Burma (%)
Place of birth for the foreign-born population - Cambodia (%)
Place of birth for the foreign-born population - Indonesia (%)
Place of birth for the foreign-born population - Laos (%)
Place of birth for the foreign-born population - Malaysia (%)
Place of birth for the foreign-born population - Philippines (%)
Place of birth for the foreign-born population - Singapore (%)
Place of birth for the foreign-born population - Thailand (%)
Place of birth for the foreign-born population - Vietnam (%)
Place of birth for the foreign-born population - Other South Eastern Asia (%)
Place of birth for the foreign-born population - Armenia (%)
Place of birth for the foreign-born population - Iraq (%)
Place of birth for the foreign-born population - Israel (%)
Place of birth for the foreign-born population - Jordan (%)
Place of birth for the foreign-born population - Kuwait (%)
Place of birth for the foreign-born population - Lebanon (%)
Place of birth for the foreign-born population - Saudi Arabia (%)
Place of birth for the foreign-born population - Syria (%)
Place of birth for the foreign-born population - Turkey (%)
Place of birth for the foreign-born population - Yemen (%)
Place of birth for the foreign-born population - Other Western Asia (%)
Place of birth for the foreign-born population - Eritrea (%)
Place of birth for the foreign-born population - Ethiopia (%)
Place of birth for the foreign-born population - Kenya (%)
Place of birth for the foreign-born population - Somalia (%)
Place of birth for the foreign-born population - Uganda (%)
Place of birth for the foreign-born population - Zimbabwe (%)
Place of birth for the foreign-born population - Other Eastern Africa (%)
Place of birth for the foreign-born population - Cameroon (%)
Place of birth for the foreign-born population - Congo (%)
Place of birth for the foreign-born population - Democratic Republic of Congo (Zaire) (%)
Place of birth for the foreign-born population - Other Middle Africa (%)
Place of birth for the foreign-born population - Egypt (%)
Place of birth for the foreign-born population - Morocco (%)
Place of birth for the foreign-born population - Sudan (%)
Place of birth for the foreign-born population - Other Northern Africa (%)
Place of birth for the foreign-born population - South Africa (%)
Place of birth for the foreign-born population - Other Southern Africa (%)
Place of birth for the foreign-born population - Cabo Verde (%)
Place of birth for the foreign-born population - Ghana (%)
Place of birth for the foreign-born population - Liberia (%)
Place of birth for the foreign-born population - Nigeria (%)
Place of birth for the foreign-born population - Senegal (%)
Place of birth for the foreign-born population - Sierra Leone (%)
Place of birth for the foreign-born population - Other Western Africa (%)
Place of birth for the foreign-born population - Australia (%)
Place of birth for the foreign-born population - New Zealand (%)
Place of birth for the foreign-born population - Fiji (%)
Place of birth for the foreign-born population - Micronesia (%)
Place of birth for the foreign-born population - Bahamas (%)
Place of birth for the foreign-born population - Barbados (%)
Place of birth for the foreign-born population - Cuba (%)
Place of birth for the foreign-born population - Dominica (%)
Place of birth for the foreign-born population - Dominican Republic (%)
Place of birth for the foreign-born population - Grenada (%)
Place of birth for the foreign-born population - Haiti (%)
Place of birth for the foreign-born population - Jamaica (%)
Place of birth for the foreign-born population - St. Vincent and the Grenadines (%)
Place of birth for the foreign-born population - Trinidad and Tobago (%)
Place of birth for the foreign-born population - West Indies (%)
Place of birth for the foreign-born population - Other Caribbean (%)
Place of birth for the foreign-born population - Belize (%)
Place of birth for the foreign-born population - Costa Rica (%)
Place of birth for the foreign-born population - El Salvador (%)
Place of birth for the foreign-born population - Guatemala (%)
Place of birth for the foreign-born population - Honduras (%)
Place of birth for the foreign-born population - Mexico (%)
Place of birth for the foreign-born population - Nicaragua (%)
Place of birth for the foreign-born population - Panama (%)
Place of birth for the foreign-born population - Other Central America (%)
Place of birth for the foreign-born population - Argentina (%)
Place of birth for the foreign-born population - Bolivia (%)
Place of birth for the foreign-born population - Brazil (%)
Place of birth for the foreign-born population - Chile (%)
Place of birth for the foreign-born population - Colombia (%)
Place of birth for the foreign-born population - Ecuador (%)
Place of birth for the foreign-born population - Guyana (%)
Place of birth for the foreign-born population - Peru (%)
Place of birth for the foreign-born population - Uruguay (%)
Place of birth for the foreign-born population - Venezuela (%)
Place of birth for the foreign-born population - Other South America (%)
Place of birth for the foreign-born population - Canada (%)
Place of birth for the foreign-born population - Other Northern America (%)
Place of birth for the foreign-born population - Other (%)
Latest news about races in Conroe, TX collected exclusively by city-data.com from local newspapers, TV, and radio stations
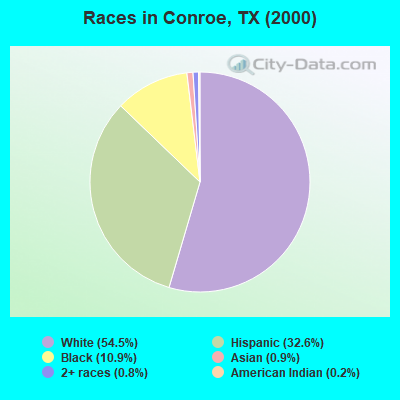
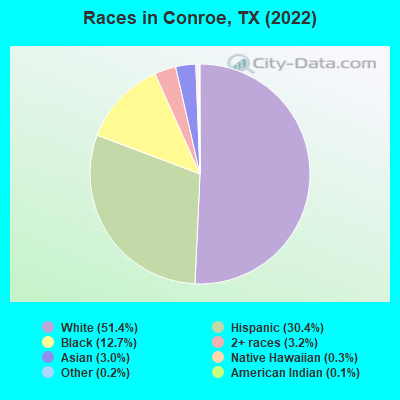
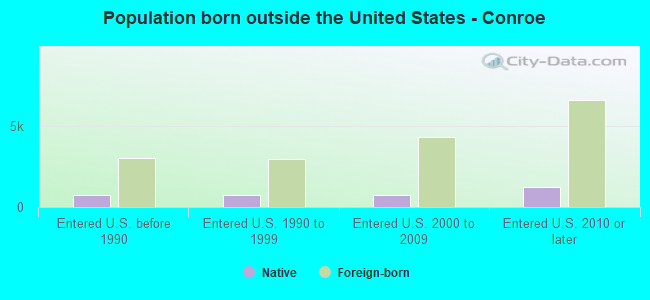
According to 2022 data, the most numerous races in Conroe, TX are Hispanic (30,256 residents), White alone (51,155 residents), and Black alone (12,670 residents). 68.8% of Conroe residents speak English at home. 15.0% of Conroe, TX residents are foreign-born (11.2% born in Latin America, 2.4% born in Asia), which is 13.4% less than the foreign-born rate of 17.0% across the entire state of Texas.
Race distribution in Conroe
2000 2022
10,933,313 52.4% White alone 6,669,666 32.0% Hispanic 2,364,255 11.3% Black alone 554,445 2.7% Asian alone 230,567 1.1% Two or more races 68,859 0.3% American Indian alone 19,958 0.10% Other race alone 10,757 0.05% Native Hawaiian and Other
12,070,642 40.2% Hispanic 11,683,430 38.9% White alone 3,508,706 11.7% Black alone 1,608,173 5.4% Asian alone 956,560 3.2% Two or more races 125,763 0.4% Other race alone 47,023 0.2% American Indian alone 29,275 0.10% Native Hawaiian and Other
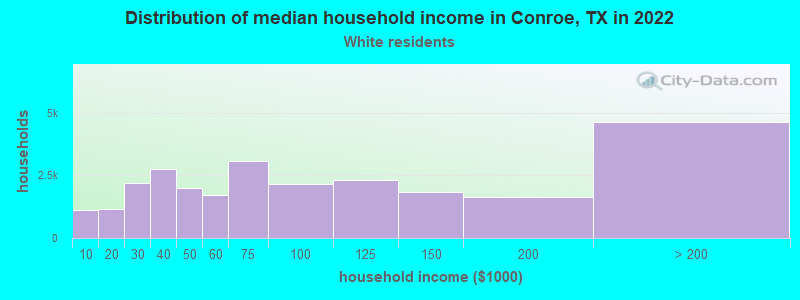
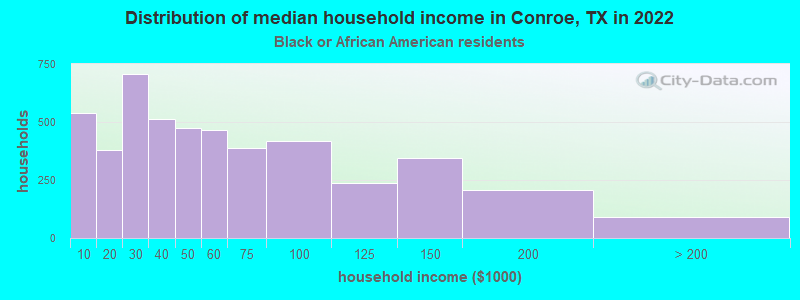
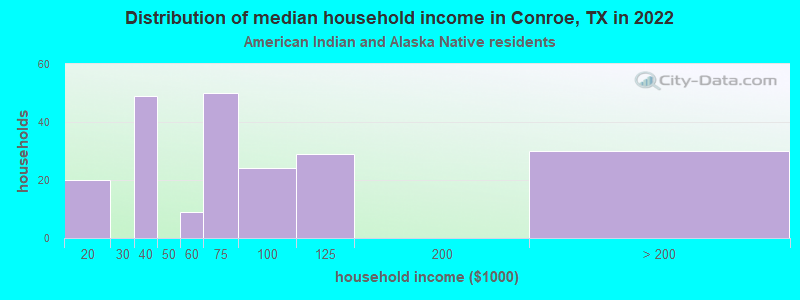
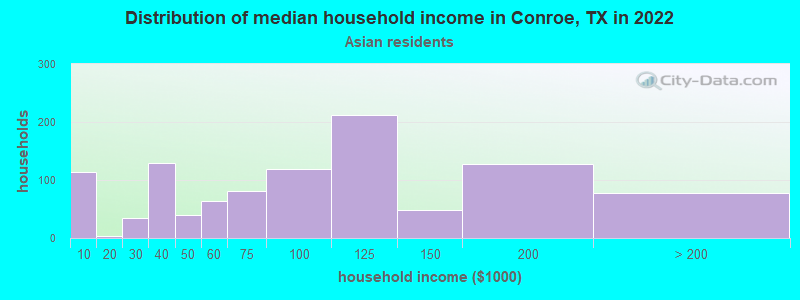
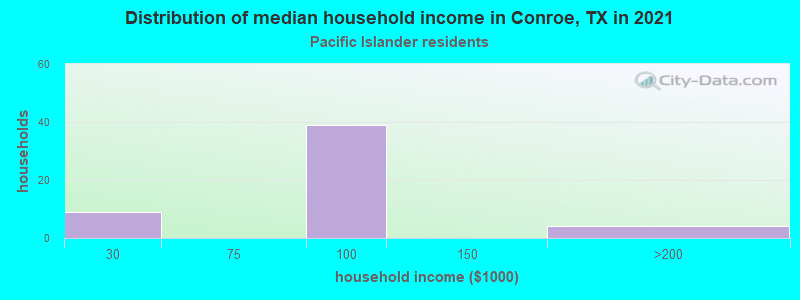
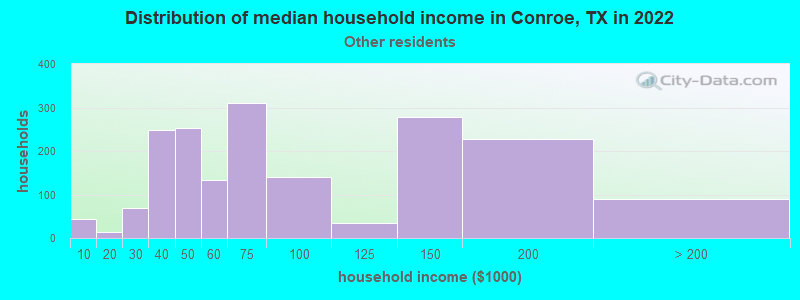
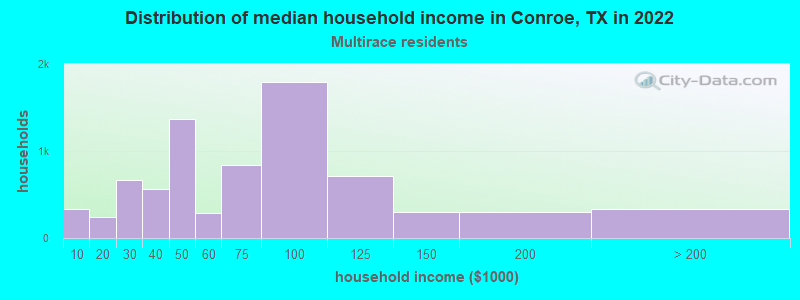
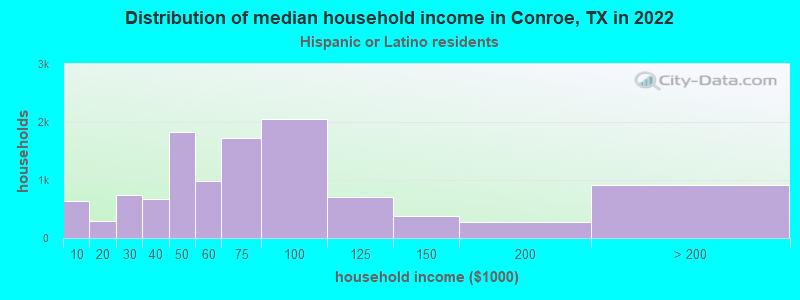
Income and house value in Conroe Median household income in 2022 $71,036 White non-Hispanic householders$35,368 Black householders$78,417 Asian householders$56,646 Some other race householders$73,436 Two or more races householders$64,578 Hispanic or Latino race householdersMedian 2022 house value $353,200 White Non-Hispanic householders$159,791 Black or African American householders $204,615 Asian householders$213,746 Some other race householders$157,300 Two or more races householders$200,465 Hispanic or Latino householders
Median age by race in Conroe
37.7 Median age for White residents37.2 38.2 34.0 Median age for Black or African American residents25.3 35.4 34.6 Median age for American Indian / Alaska Native residents37.6 29.6 40.0 Median age for Asian residents39.0 40.2 27.5 Median age for Native Hawaiian / Pacific Islander residents27.5 -666,666,666.0 35.2 Median age for Other race residents35.2 36.2 28.4 Median age for Two or more races residents29.4 22.5 40.3 Median age for White alone residents40.9 39.6 29.8 Median age for Hispanic or Latino residents30.9 29.2
Owner/renter occupied households by race in Conroe
House owners and renters - White residents 16,572 62.3% Owner occupied10,036 37.7% Renter occupiedHouse owners and renters - Black or African American residents 1,055 24.3% Owner occupied3,293 75.7% Renter occupiedHouse owners and renters - American Indian / Alaska Native residents 105 50.7% Owner occupied102 49.3% Renter occupiedHouse owners and renters - Asian residents 120 15.4% Owner occupied658 84.6% Renter occupiedHouse owners and renters - Native Hawaiian / Pacific Islander residents 77 100.0% Owner occupiedHouse owners and renters - Other race residents 1,194 68.9% Owner occupied539 31.1% Renter occupiedHouse owners and renters - Two or more races residents 3,381 43.7% Owner occupied4,359 56.3% Renter occupiedHouse owners and renters - White alone residents 15,083 62.4% Owner occupied9,071 37.6% Renter occupiedHouse owners and renters - Hispanic or Latino residents 5,533 49.3% Owner occupied5,684 50.7% Renter occupied
Language usage in Conroe
English speakers - Total 68.8% of residents of Conroe speak English at home.
26.2% of residents speak Spanish at home 14,348 59.5% Speak English very well9,777 40.5% Speak English less than very well5.0% of residents speak other language at home 2,969 64.0% Speak English very well1,672 36.0% Speak English less than very well
English speakers - Born in the United States 90.9% of residents of Conroe speak English at home.
9.1% of residents speak Spanish at home 2,031 80.1% Speak English very well503 19.9% Speak English less than very well
English speakers - Native, born elsewhere 26.2% of residents of Conroe speak English at home.
62.1% of residents speak Spanish at home 955 45.4% Speak English very well1,147 54.6% Speak English less than very well11.7% of residents speak other language at home 64 16.2% Speak English very well332 83.8% Speak English less than very well
English speakers - Foreign-born 8.4% of residents of Conroe speak English at home.
67.1% of residents speak Spanish at home 4,576 40.2% Speak English very well6,802 59.8% Speak English less than very well24.6% of residents speak other language at home 2,827 67.8% Speak English very well1,340 32.2% Speak English less than very well
White (Caucasian) - Speak only English Native:
92.6% (48,394)Foreign-born:
11.4% (469)
White (Caucasian) - Speak another language Native:
7.4% (3,892)Foreign-born:
88.6% (3,648)
Black or African American - Speak only English Native:
99.0% (8,834)Foreign-born:
18.3% (209)
Black or African American - Speak another language Native:
1.1% (94)Foreign-born:
83.9% (956)
American Indian / Alaska Native - Speak another language Native:
59.4% (288)Foreign-born:
98.9% (283)
Asian - Speak only English Native:
73.3% (400)Foreign-born:
16.1% (377)
Asian - Speak another language Native:
27.0% (148)Foreign-born:
82.9% (1,939)
Native Hawaiian / Pacific Islander - Speak only English Native:
68.6% (87)Foreign-born:
51.5% (4)
Other race - Speak only English Native:
30.1% (696)Foreign-born:
15.4% (338)
Other race - Speak another language Native:
69.9% (1,619)Foreign-born:
84.6% (1,856)
Two or more races - Speak only English Native:
45.3% (5,922)Foreign-born:
4.4% (304)
Two or more races - Speak another language Native:
54.7% (7,155)Foreign-born:
95.6% (6,563)
White alone - Speak only English Native:
97.1% (45,684)Foreign-born:
29.0% (295)
White alone - Speak another language Native:
2.9% (1,375)Foreign-born:
71.0% (723)
Hispanic or Latino - Speak only English Native:
36.8% (6,681)Foreign-born:
6.7% (816)
Hispanic or Latino - Speak another language Native:
63.2% (11,450)Foreign-born:
93.3% (11,323)
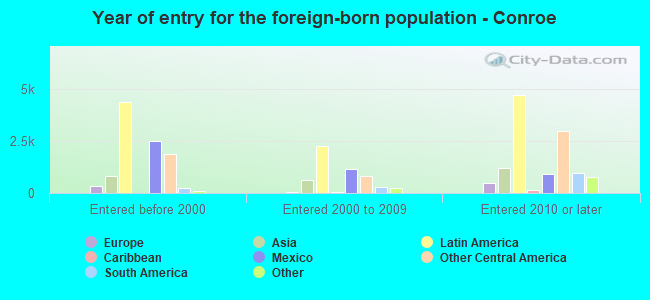
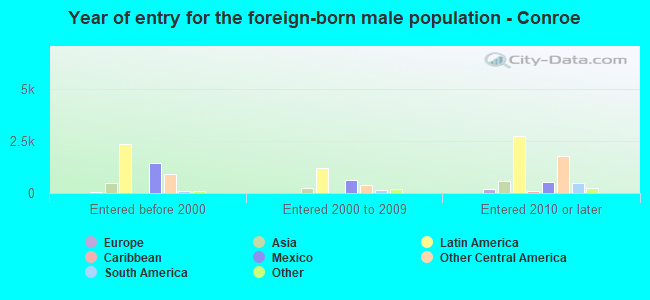
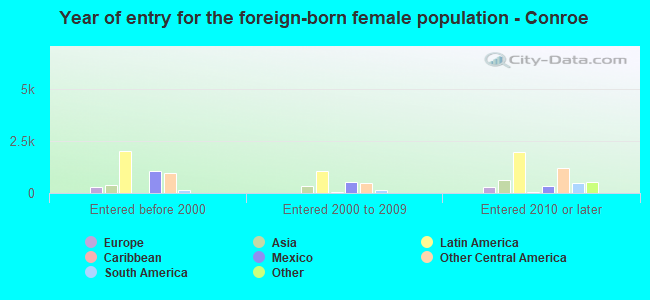
Foreign-born residents in Conroe 14,930 residents are foreign born (11.2% Latin America , 2.4% Asia ).
This city:
15.0%Texas:
17.1%
Marital status for residents in Conroe Marital status - White (Caucasian) population 15 years and over
Males 32.3% Never married56.3% Now married0.4% Separated2.5% Widowed8.5% DivorcedFemales 26.3% Never married53.6% Now married0.4% Separated8.3% Widowed11.4% DivorcedWomen who gave birth in the past 12 months Now married:
44.2% (526)Unmarried:
55.8% (664)
Women who did not give birth in the past 12 months Now married:
53.0% (7,342)Unmarried:
47.0% (6,503)
Marital status - Black or African American population 15 years and over
Males 40.9% Never married37.4% Now married4.0% Separated0.5% Widowed17.3% DivorcedFemales 37.9% Never married48.5% Now married0.0% Separated3.3% Widowed10.3% DivorcedWomen who gave birth in the past 12 months Now married:
75.4% (115)Unmarried:
24.6% (37)
Women who did not give birth in the past 12 months Now married:
43.7% (1,601)Unmarried:
56.3% (2,063)
Marital status - American Indian / Alaska Native population 15 years and over
Males 47.3% Never married47.7% Now married4.1% Separated0.0% Widowed0.8% DivorcedFemales 47.2% Never married22.8% Now married2.8% Separated11.7% Widowed15.6% DivorcedWomen who did not give birth in the past 12 months Now married:
21.5% (44)Unmarried:
78.5% (162)
Marital status - Asian population 15 years and over
Males 45.0% Never married51.4% Now married0.0% Separated3.0% Widowed0.6% DivorcedFemales 8.8% Never married76.6% Now married0.0% Separated8.9% Widowed5.7% DivorcedWomen who gave birth in the past 12 months Now married:
100.0% (54)Unmarried:
0.0% (0)
Women who did not give birth in the past 12 months Now married:
80.8% (492)Unmarried:
19.2% (117)
Marital status - Native Hawaiian / Pacific Islander population 15 years and over
Males 58.8% Never married0.0% Now married0.0% Separated0.0% Widowed41.2% DivorcedFemales 34.0% Never married66.0% Now married0.0% Separated0.0% Widowed0.0% DivorcedWomen who gave birth in the past 12 months Now married:
0.0% (0)Unmarried:
100.0% (22)
Women who did not give birth in the past 12 months Now married:
100.0% (42)Unmarried:
0.0% (0)
Marital status - Other race population 15 years and over
Males 47.7% Never married42.9% Now married2.6% Separated0.0% Widowed6.7% DivorcedFemales 27.0% Never married57.7% Now married2.4% Separated7.1% Widowed5.8% DivorcedWomen who gave birth in the past 12 months Now married:
100.0% (7)Unmarried:
0.0% (0)
Women who did not give birth in the past 12 months Now married:
58.6% (745)Unmarried:
41.4% (526)
Marital status - Two or more races population 15 years and over
Males 46.1% Never married42.4% Now married0.5% Separated0.6% Widowed10.3% DivorcedFemales 38.8% Never married50.8% Now married1.1% Separated0.0% Widowed9.3% DivorcedWomen who gave birth in the past 12 months Now married:
82.7% (388)Unmarried:
17.3% (81)
Women who did not give birth in the past 12 months Now married:
35.9% (1,341)Unmarried:
64.1% (2,391)
Marital status - White alone, not Hispanic / Latino population 15 years and over
Males 30.5% Never married57.1% Now married0.5% Separated2.9% Widowed9.1% DivorcedFemales 25.1% Never married53.6% Now married0.4% Separated9.2% Widowed11.7% DivorcedWomen who gave birth in the past 12 months Now married:
61.3% (421)Unmarried:
38.7% (266)
Women who did not give birth in the past 12 months Now married:
51.6% (5,810)Unmarried:
48.4% (5,454)
Marital status - Hispanic or Latino population 15 years and over
Males 41.5% Never married49.6% Now married1.3% Separated0.3% Widowed7.2% DivorcedFemales 33.4% Never married56.8% Now married0.7% Separated2.7% Widowed6.3% DivorcedWomen who gave birth in the past 12 months Now married:
39.6% (261)Unmarried:
60.4% (398)
Women who did not give birth in the past 12 months Now married:
52.5% (4,330)Unmarried:
47.5% (3,919)
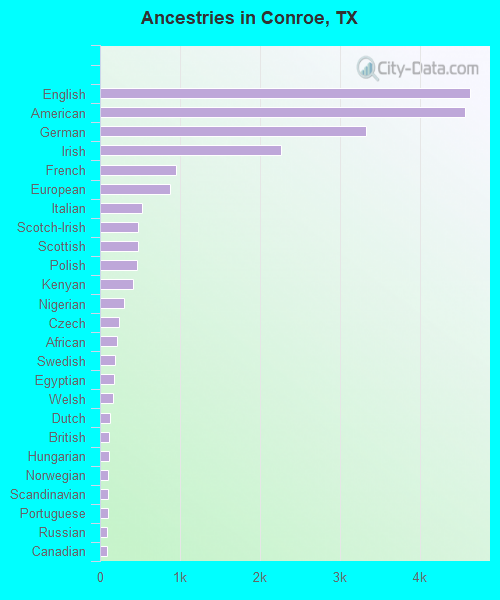
Ancestries in Conroe
4,636 9.1% English4,570 9.0% American3,331 6.5% German2,265 4.4% Irish957 1.9% French871 1.7% European523 1.0% Italian474 0.9% Scotch-Irish471 0.9% Scottish467 0.9% Polish409 0.8% Kenyan296 0.6% Nigerian242 0.5% Czech213 0.4% African190 0.4% Swedish177 0.3% Egyptian161 0.3% Welsh124 0.2% Dutch114 0.2% British111 0.2% Hungarian106 0.2% Norwegian98 0.2% Scandinavian96 0.2% Portuguese87 0.2% Russian84 0.2% Canadian57 0.1% Jordanian54 0.1% Brazilian48 0.09% Iranian47 0.09% Palestinian43 0.08% Ukrainian42 0.08% French Canadian36 0.07% Greek34 0.07% Finnish31 0.06% Belizean29 0.06% Cape Verdean24 0.05% Celtic24 0.05% Eastern European19 0.04% Swiss17 0.03% Austrian17 0.03% Cajun16 0.03% Slovak15 0.03% Czechoslovakian10 0.02% Belgian10 0.02% Romanian8 0.02% British West Indian7 0.01% Lebanese7 0.01% Northern European4 0.01% Danish
Geographical mobility in Conroe Same house 1 year ago 51,042 84.2% White (Caucasian)10,392 82.8% Black or African American656 82.7% American Indian / Alaska Native2,405 80.4% Asian130 98.2% Native Hawaiian / Pacific Islander5,277 81.9% Other race17,912 84.1% Two or more races43,032 83.3% White alone, not Hispanic / Latino27,550 85.3% Hispanic or LatinoMoved within same county 4,275 7.1% White / Caucasian753 6.0% Black or African American12 1.5% American Indian / Alaska Native3 0.1% Asian478 7.4% Other race1,482 7.0% Two or more races4,034 7.8% White alone, not Hispanic / Latino1,775 5.5% Hispanic or LatinoMoved within same state 4,594 7.6% White / Caucasian896 7.1% Black or African American121 15.3% American Indian / Alaska Native218 7.3% Asian257 4.0% Other race810 3.8% Two or more races3,933 7.6% White alone, not Hispanic / Latino1,985 6.1% Hispanic or LatinoMoved from different state 700 1.2% White / Caucasian138 1.1% Black or African American517 17.3% Asian453 7.0% Other race919 4.3% Two or more races664 1.3% White alone, not Hispanic / Latino810 2.5% Hispanic or LatinoMoved from abroad 19 0.3% Other race185 0.9% Two or more races185 0.6% Hispanic or Latino
Children Nativity (place of birth) in Conroe
Children under 6 years - Living with two parents Both parents native 3,798 100.0% NativeBoth parents foreign-born 1,385 91.8% Native123 8.2% Foreign-bornOne native, one foreign-born parent 1,065 100.0% NativeChildren under 6 years - Living with one parent Native parent 3,656 100.0% NativeForeign-born parent 134 100.0% NativeChildren 6 to 17 years - Living with two parents Both parents native 5,843 100.0% NativeBoth parents foreign-born 1,383 51.7% Native1,290 48.3% Foreign-bornOne native, one foreign-born parent 1,570 100.0% NativeChildren 6 to 17 years - Living with one parent Native parent 2,024 100.0% NativeForeign-born parent 695 50.0% Native695 50.0% Foreign-born
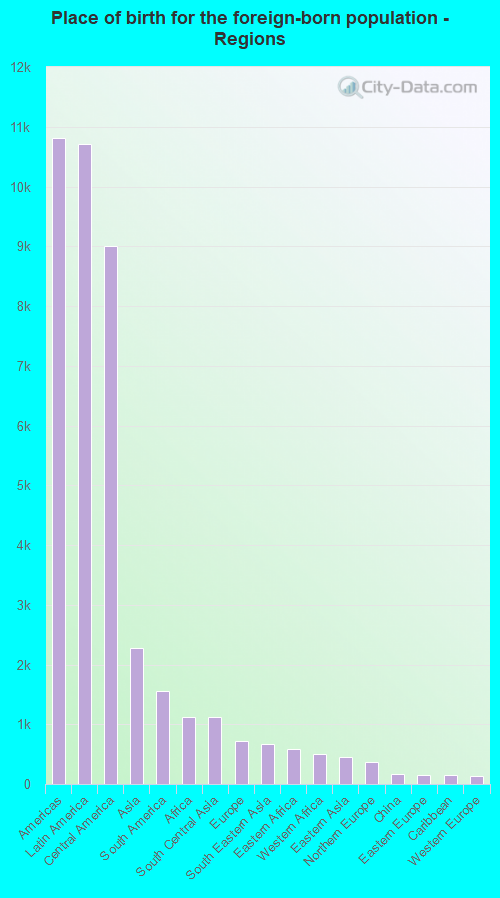
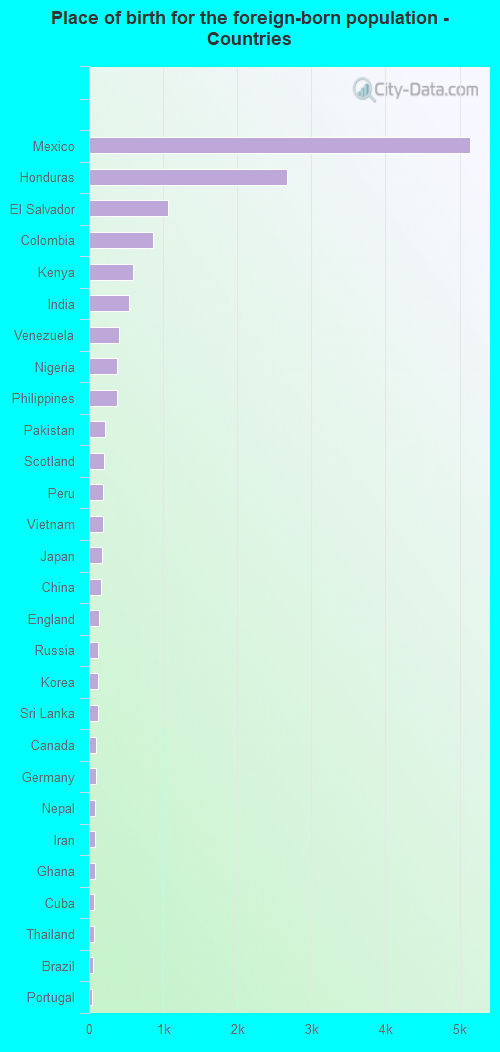
Place of birth for residents in Conroe 10,804 Americas10,708 Latin America8,999 Central America2,277 Asia1,557 South America1,119 Africa1,115 South Central Asia722 Europe666 South Eastern Asia594 Eastern Africa506 Western Africa452 Eastern Asia374 Northern Europe161 China157 Eastern Europe151 Caribbean130 Western Europe96 Northern America60 Southern Europe22 Western Asia17 Northern Africa6 Oceania5,141 Mexico2,676 Honduras1,065 El Salvador860 Colombia594 Kenya544 India409 Venezuela380 Nigeria380 Philippines220 Pakistan198 Scotland192 Peru183 Vietnam175 Japan161 China131 England118 Russia116 Korea116 Sri Lanka96 Canada95 Germany87 Nepal84 Iran81 Ghana69 Cuba68 Thailand60 Brazil47 Portugal46 Kazakhstan44 Liberia43 Belize42 St. Lucia42 United Kingdom36 Guatemala36 Panama29 Singapore23 Dominica22 Belgium22 United Arab Emirates21 Argentina17 Egypt16 Poland15 Romania15 Dominican Republic15 Uzbekistan13 Uruguay12 Italy12 Netherlands7 Hungary5 Indonesia1 Ireland
Grandparents responsible for own grandchildren in Conroe
Grandparents (30 to 59 years) White / Caucasian 44 9.8% Responsible for grandchildren403 90.2% Not responsible for grandchildrenAsian 6 100.0% Not responsible for grandchildrenOther race 28 100.0% Not responsible for grandchildrenTwo or more races 18 34.4% Responsible for grandchildren34 65.6% Not responsible for grandchildrenWhite alone, not Hispanic / Latino 11 3.8% Responsible for grandchildren277 96.2% Not responsible for grandchildrenHispanic or Latino 65 32.0% Responsible for grandchildren138 68.0% Not responsible for grandchildrenGrandparents (60 years and over) White / Caucasian 127 31.8% Responsible for grandchildren271 68.2% Not responsible for grandchildrenAsian 12 14.1% Responsible for grandchildren74 85.9% Not responsible for grandchildrenTwo or more races 13 100.0% Not responsible for grandchildrenWhite alone, not Hispanic / Latino 129 36.1% Responsible for grandchildren229 63.9% Not responsible for grandchildrenHispanic or Latino 105 100.0% Not responsible for grandchildren