Races in Darby Township, Pennsylvania (PA) Detailed Stats
Ancestries, Foreign-born residents, place of birth

Recent posts about races in Darby Township, Pennsylvania on our local forum with over 2,400,000 registered users:
 | The Rowhouse Thread (40 replies) |
| PA Republicans bucking party to endorse Democrat Josh Shapiro for governor (284 replies) |
| Wow, Conor Lamb is going to lose big (233 replies) |
| Asian moving to Philadelphia? (21 replies) |
| Tell me about your favorite suburban neighborhood (19 replies) |
| NE Philly (39 replies) |
2.1% of Darby Township, PA residents are foreign-born (0.8% born in Europe, 0.7% born in Latin America, 0.5% born in Africa), which is 235.1% less than the foreign-born rate of 7.0% across the entire state of Pennsylvania.
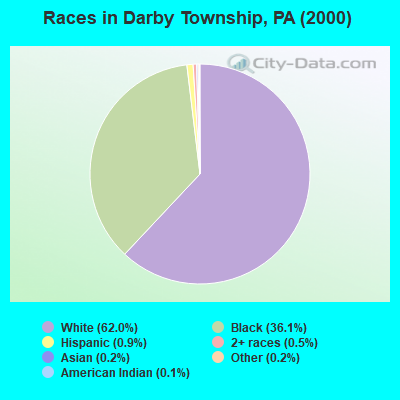
Race distribution in Darby Township

- 5,96162.0%White alone
- 3,47136.1%Black alone
- 860.9%Hispanic
- 520.5%Two or more races
- 230.2%Asian alone
- 150.2%Other race alone
- 110.1%American Indian alone
- 30.03%Native Hawaiian and Other
Pacific Islander alone
2000
2022
-
- 10,322,45584.1%White alone
- 1,202,4379.8%Black alone
- 394,0883.2%Hispanic
- 218,2961.8%Asian alone
- 113,0970.9%Two or more races
- 13,0860.1%Other race alone
- 14,9040.1%American Indian alone
- 2,6910.02%Native Hawaiian and Other
Pacific Islander alone

-
- 9,487,22873.1%White alone
- 1,311,58110.1%Black alone
- 1,115,9978.6%Hispanic
- 493,9423.8%Two or more races
- 487,1243.8%Asian alone
- 63,5820.5%Other race alone
- 10,1300.08%American Indian alone
- 2,4240.02%Native Hawaiian and Other
Pacific Islander alone

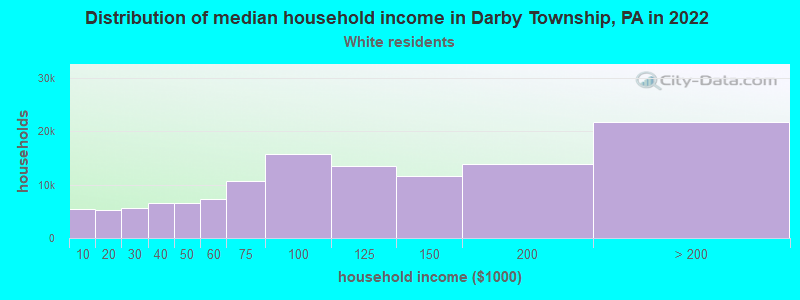
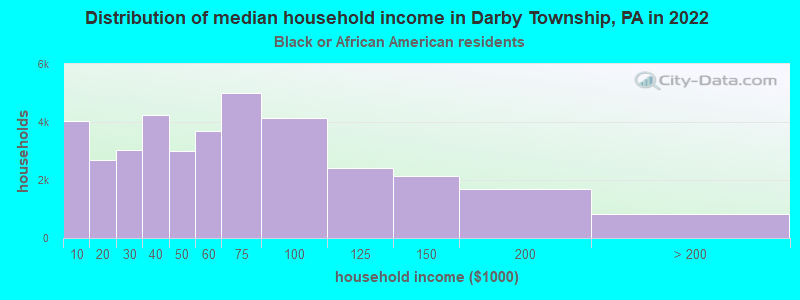
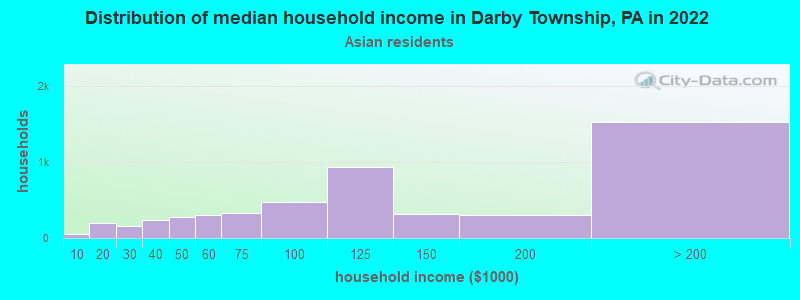
Income and house value in Darby Township
- Median household income in 2022
- $83,088White non-Hispanic householders
- $41,744Black householders
- $45,383Asian householders
- $39,066Some other race householders
- $66,530Two or more races householders
- $64,685Hispanic or Latino race householders
- Median 2022 house value
- $205,654White Non-Hispanic householders
- $153,120Black or African American householders
- $186,732Native Hawaiian and other Pacific Islander householders
- $161,834Two or more races householders
- $186,732Hispanic or Latino householders
Household income for White non-Hispanic householders
Household income for Black householders
Household income for Asian householders
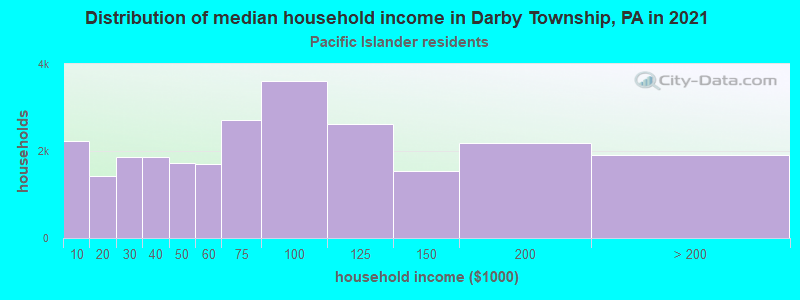
Household income for Native Hawaiian and other Pacific Islander householders
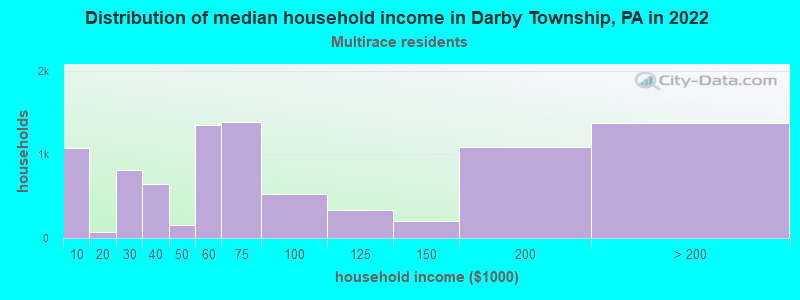
Household income for Two or more races householders
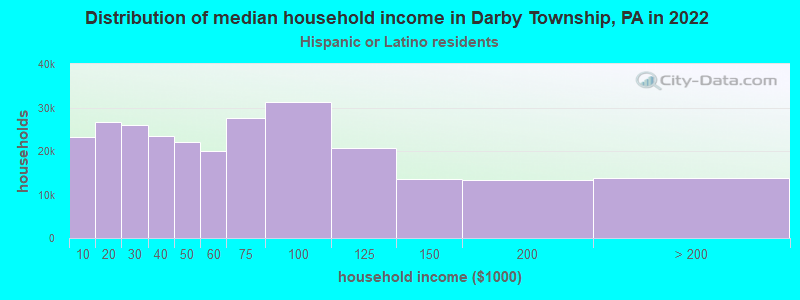
Household income for Hispanic or Latino race householders
Foreign-born residents in Darby Township
201 residents are foreign born (0.8% Europe, 0.7% Latin America, 0.5% Africa).
| This city: | 2.1% |
| Pennsylvania: | 4.1% |
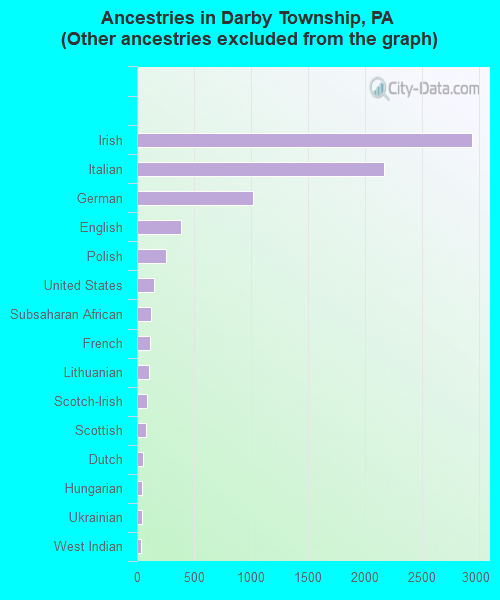
Ancestries in Darby Township

- 3,12928.9%Other
- 2,94127.1%Irish
- 2,16620.0%Italian
- 1,0149.4%German
- 3903.6%English
- 2572.4%Polish
- 1511.4%United States
- 1191.1%Subsaharan African
- 1131.0%French
- 1051.0%Lithuanian
- 850.8%Scotch-Irish
- 820.8%Scottish
- 520.5%Dutch
- 450.4%Hungarian
- 420.4%Ukrainian
- 360.3%West Indian
- 190.2%Danish
- 190.2%Greek
- 180.2%Swedish
- 140.1%Welsh
- 120.1%Russian
- 110.1%French Canadian
- 100.09%Norwegian
- 50.05%Swiss
- 30.03%Portuguese
Zip codes: 19036.