Races in Dayton, Ohio (OH) Detailed Stats
Data:
Races - White alone (%)
Races - White alone (% change since 2000)
Races - Black alone (%)
Races - Black alone (% change since 2000)
Races - American Indian alone (%)
Races - American Indian alone (% change since 2000)
Races - Asian alone (%)
Races - Asian alone (% change since 2000)
Races - Hispanic (%)
Races - Hispanic (% change since 2000)
Races - Native Hawaiian and Other Pacific Islander alone (%)
Races - Native Hawaiian and Other Pacific Islander alone (% change since 2000)
Races - Two or more races(%)
Races - Two or more races(% change since 2000)
Races - Other race alone (%)
Races - Other race alone (% change since 2000)
Racial diversity
Place of birth - Born in state of residence (%)
Place of birth - Born in state of residence (%) - White
Place of birth - Born in state of residence (%) - Black or African American
Place of birth - Born in state of residence (%) - Asian
Place of birth - Born in state of residence (%) - Hispanic or Latino
Place of birth - Born in state of residence (%) - American Indian and Alaska Native
Place of birth - Born in state of residence (%) - Multirace
Place of birth - Born in state of residence (%) - Other Race
Place of birth - Born in other state (%)
Place of birth - Born in other state (%) - White
Place of birth - Born in other state (%) - Black or African American
Place of birth - Born in other state (%) - Asian
Place of birth - Born in other state (%) - Hispanic or Latino
Place of birth - Born in other state (%) - American Indian and Alaska Native
Place of birth - Born in other state (%) - Multirace
Place of birth - Born in other state (%) - Other Race
Place of birth - Native, outside of US (%)
Place of birth - Native, outside of US (%) - White
Place of birth - Native, outside of US (%) - Black or African American
Place of birth - Native, outside of US (%) - Asian
Place of birth - Native, outside of US (%) - Hispanic or Latino
Place of birth - Native, outside of US (%) - American Indian and Alaska Native
Place of birth - Native, outside of US (%) - Multirace
Place of birth - Native, outside of US (%) - Other Race
Place of birth - Foreign born (%)
Place of birth - Foreign born (%) - White
Place of birth - Foreign born (%) - Black or African American
Place of birth - Foreign born (%) - Asian
Place of birth - Foreign born (%) - Hispanic or Latino
Place of birth - Foreign born (%) - American Indian and Alaska Native
Place of birth - Foreign born (%) - Multirace
Place of birth - Foreign born (%) - Other Race
Residents speaking English at home (%)
Residents speaking English at home - Born in the United States (%)
Residents speaking English at home - Native, born elsewhere (%)
Residents speaking English at home - Foreign born (%)
Residents speaking Spanish at home (%)
Residents speaking Spanish at home - Born in the United States (%)
Residents speaking Spanish at home - Native, born elsewhere (%)
Residents speaking Spanish at home - Foreign born (%)
Residents speaking other language at home (%)
Residents speaking other language at home - Born in the United States (%)
Residents speaking other language at home - Native, born elsewhere (%)
Residents speaking other language at home - Foreign born (%)
Marital status - Never married (%)
Marital status - Now married (%)
Marital status - Separated (%)
Marital status - Widowed (%)
Marital status - Divorced (%)
Ancestries Reported - Arab (%)
Ancestries Reported - Czech (%)
Ancestries Reported - Danish (%)
Ancestries Reported - Dutch (%)
Ancestries Reported - English (%)
Ancestries Reported - French (%)
Ancestries Reported - French Canadian (%)
Ancestries Reported - German (%)
Ancestries Reported - Greek (%)
Ancestries Reported - Hungarian (%)
Ancestries Reported - Irish (%)
Ancestries Reported - Italian (%)
Ancestries Reported - Lithuanian (%)
Ancestries Reported - Norwegian (%)
Ancestries Reported - Polish (%)
Ancestries Reported - Portuguese (%)
Ancestries Reported - Russian (%)
Ancestries Reported - Scotch-Irish (%)
Ancestries Reported - Scottish (%)
Ancestries Reported - Slovak (%)
Ancestries Reported - Subsaharan African (%)
Ancestries Reported - Swedish (%)
Ancestries Reported - Swiss (%)
Ancestries Reported - Ukrainian (%)
Ancestries Reported - United States (%)
Ancestries Reported - Welsh (%)
Ancestries Reported - West Indian (%)
Ancestries Reported - Other (%)
Geographical mobility - Same house 1 year ago (%)
Geographical mobility - Same house 1 year ago (%) - White
Geographical mobility - Same house 1 year ago (%) - Black or African American
Geographical mobility - Same house 1 year ago (%) - Asian
Geographical mobility - Same house 1 year ago (%) - Hispanic or Latino
Geographical mobility - Same house 1 year ago (%) - American Indian and Alaska Native
Geographical mobility - Same house 1 year ago (%) - Multirace
Geographical mobility - Same house 1 year ago (%) - Other Race
Geographical mobility - Moved within same county (%)
Geographical mobility - Moved within same county (%) - White
Geographical mobility - Moved within same county (%) - Black or African American
Geographical mobility - Moved within same county (%) - Asian
Geographical mobility - Moved within same county (%) - Hispanic or Latino
Geographical mobility - Moved within same county (%) - American Indian and Alaska Native
Geographical mobility - Moved within same county (%) - Multirace
Geographical mobility - Moved within same county (%) - Other Race
Geographical mobility - Moved from different county within same state (%)
Geographical mobility - Moved from different county within same state (%) - White
Geographical mobility - Moved from different county within same state (%) - Black or African American
Geographical mobility - Moved from different county within same state (%) - Asian
Geographical mobility - Moved from different county within same state (%) - Hispanic or Latino
Geographical mobility - Moved from different county within same state (%) - American Indian and Alaska Native
Geographical mobility - Moved from different county within same state (%) - Multirace
Geographical mobility - Moved from different county within same state (%) - Other Race
Geographical mobility - Moved from different state (%)
Geographical mobility - Moved from different state (%) - White
Geographical mobility - Moved from different state (%) - Black or African American
Geographical mobility - Moved from different state (%) - Asian
Geographical mobility - Moved from different state (%) - Hispanic or Latino
Geographical mobility - Moved from different state (%) - American Indian and Alaska Native
Geographical mobility - Moved from different state (%) - Multirace
Geographical mobility - Moved from different state (%) - Other Race
Geographical mobility - Moved from abroad (%)
Geographical mobility - Moved from abroad (%) - White
Geographical mobility - Moved from abroad (%) - Black or African American
Geographical mobility - Moved from abroad (%) - Asian
Geographical mobility - Moved from abroad (%) - Hispanic or Latino
Geographical mobility - Moved from abroad (%) - American Indian and Alaska Native
Geographical mobility - Moved from abroad (%) - Multirace
Geographical mobility - Moved from abroad (%) - Other Race
Place of birth for the foreign-born population - Ireland (%)
Place of birth for the foreign-born population - Denmark (%)
Place of birth for the foreign-born population - Norway (%)
Place of birth for the foreign-born population - Sweden (%)
Place of birth for the foreign-born population - United Kingdom (%)
Place of birth for the foreign-born population - England (%)
Place of birth for the foreign-born population - Scotland (%)
Place of birth for the foreign-born population - Other Northern Europe (%)
Place of birth for the foreign-born population - Austria (%)
Place of birth for the foreign-born population - Belgium (%)
Place of birth for the foreign-born population - France (%)
Place of birth for the foreign-born population - Germany (%)
Place of birth for the foreign-born population - Netherlands (%)
Place of birth for the foreign-born population - Switzerland (%)
Place of birth for the foreign-born population - Other Western Europe (%)
Place of birth for the foreign-born population - Greece (%)
Place of birth for the foreign-born population - Italy (%)
Place of birth for the foreign-born population - Portugal (%)
Place of birth for the foreign-born population - Spain (%)
Place of birth for the foreign-born population - Other Southern Europe (%)
Place of birth for the foreign-born population - Albania (%)
Place of birth for the foreign-born population - Belarus (%)
Place of birth for the foreign-born population - Bosnia and Herzegovina (%)
Place of birth for the foreign-born population - Bulgaria (%)
Place of birth for the foreign-born population - Croatia (%)
Place of birth for the foreign-born population - Czechoslovakia (%)
Place of birth for the foreign-born population - Hungary (%)
Place of birth for the foreign-born population - Latvia (%)
Place of birth for the foreign-born population - Lithuania (%)
Place of birth for the foreign-born population - North Macedonia (Macedonia) (%)
Place of birth for the foreign-born population - Moldova (%)
Place of birth for the foreign-born population - Poland (%)
Place of birth for the foreign-born population - Romania (%)
Place of birth for the foreign-born population - Russia (%)
Place of birth for the foreign-born population - Serbia (%)
Place of birth for the foreign-born population - Ukraine (%)
Place of birth for the foreign-born population - Other Eastern Europe (%)
Place of birth for the foreign-born population - China (%)
Place of birth for the foreign-born population - Hong Kong (%)
Place of birth for the foreign-born population - Taiwan (%)
Place of birth for the foreign-born population - Japan (%)
Place of birth for the foreign-born population - Korea (%)
Place of birth for the foreign-born population - Other Eastern Asia (%)
Place of birth for the foreign-born population - Afghanistan (%)
Place of birth for the foreign-born population - Bangladesh (%)
Place of birth for the foreign-born population - India (%)
Place of birth for the foreign-born population - Iran (%)
Place of birth for the foreign-born population - Kazakhstan (%)
Place of birth for the foreign-born population - Nepal (%)
Place of birth for the foreign-born population - Pakistan (%)
Place of birth for the foreign-born population - Sri Lanka (%)
Place of birth for the foreign-born population - Uzbekistan (%)
Place of birth for the foreign-born population - Other South Central Asia (%)
Place of birth for the foreign-born population - Burma (%)
Place of birth for the foreign-born population - Cambodia (%)
Place of birth for the foreign-born population - Indonesia (%)
Place of birth for the foreign-born population - Laos (%)
Place of birth for the foreign-born population - Malaysia (%)
Place of birth for the foreign-born population - Philippines (%)
Place of birth for the foreign-born population - Singapore (%)
Place of birth for the foreign-born population - Thailand (%)
Place of birth for the foreign-born population - Vietnam (%)
Place of birth for the foreign-born population - Other South Eastern Asia (%)
Place of birth for the foreign-born population - Armenia (%)
Place of birth for the foreign-born population - Iraq (%)
Place of birth for the foreign-born population - Israel (%)
Place of birth for the foreign-born population - Jordan (%)
Place of birth for the foreign-born population - Kuwait (%)
Place of birth for the foreign-born population - Lebanon (%)
Place of birth for the foreign-born population - Saudi Arabia (%)
Place of birth for the foreign-born population - Syria (%)
Place of birth for the foreign-born population - Turkey (%)
Place of birth for the foreign-born population - Yemen (%)
Place of birth for the foreign-born population - Other Western Asia (%)
Place of birth for the foreign-born population - Eritrea (%)
Place of birth for the foreign-born population - Ethiopia (%)
Place of birth for the foreign-born population - Kenya (%)
Place of birth for the foreign-born population - Somalia (%)
Place of birth for the foreign-born population - Uganda (%)
Place of birth for the foreign-born population - Zimbabwe (%)
Place of birth for the foreign-born population - Other Eastern Africa (%)
Place of birth for the foreign-born population - Cameroon (%)
Place of birth for the foreign-born population - Congo (%)
Place of birth for the foreign-born population - Democratic Republic of Congo (Zaire) (%)
Place of birth for the foreign-born population - Other Middle Africa (%)
Place of birth for the foreign-born population - Egypt (%)
Place of birth for the foreign-born population - Morocco (%)
Place of birth for the foreign-born population - Sudan (%)
Place of birth for the foreign-born population - Other Northern Africa (%)
Place of birth for the foreign-born population - South Africa (%)
Place of birth for the foreign-born population - Other Southern Africa (%)
Place of birth for the foreign-born population - Cabo Verde (%)
Place of birth for the foreign-born population - Ghana (%)
Place of birth for the foreign-born population - Liberia (%)
Place of birth for the foreign-born population - Nigeria (%)
Place of birth for the foreign-born population - Senegal (%)
Place of birth for the foreign-born population - Sierra Leone (%)
Place of birth for the foreign-born population - Other Western Africa (%)
Place of birth for the foreign-born population - Australia (%)
Place of birth for the foreign-born population - New Zealand (%)
Place of birth for the foreign-born population - Fiji (%)
Place of birth for the foreign-born population - Micronesia (%)
Place of birth for the foreign-born population - Bahamas (%)
Place of birth for the foreign-born population - Barbados (%)
Place of birth for the foreign-born population - Cuba (%)
Place of birth for the foreign-born population - Dominica (%)
Place of birth for the foreign-born population - Dominican Republic (%)
Place of birth for the foreign-born population - Grenada (%)
Place of birth for the foreign-born population - Haiti (%)
Place of birth for the foreign-born population - Jamaica (%)
Place of birth for the foreign-born population - St. Vincent and the Grenadines (%)
Place of birth for the foreign-born population - Trinidad and Tobago (%)
Place of birth for the foreign-born population - West Indies (%)
Place of birth for the foreign-born population - Other Caribbean (%)
Place of birth for the foreign-born population - Belize (%)
Place of birth for the foreign-born population - Costa Rica (%)
Place of birth for the foreign-born population - El Salvador (%)
Place of birth for the foreign-born population - Guatemala (%)
Place of birth for the foreign-born population - Honduras (%)
Place of birth for the foreign-born population - Mexico (%)
Place of birth for the foreign-born population - Nicaragua (%)
Place of birth for the foreign-born population - Panama (%)
Place of birth for the foreign-born population - Other Central America (%)
Place of birth for the foreign-born population - Argentina (%)
Place of birth for the foreign-born population - Bolivia (%)
Place of birth for the foreign-born population - Brazil (%)
Place of birth for the foreign-born population - Chile (%)
Place of birth for the foreign-born population - Colombia (%)
Place of birth for the foreign-born population - Ecuador (%)
Place of birth for the foreign-born population - Guyana (%)
Place of birth for the foreign-born population - Peru (%)
Place of birth for the foreign-born population - Uruguay (%)
Place of birth for the foreign-born population - Venezuela (%)
Place of birth for the foreign-born population - Other South America (%)
Place of birth for the foreign-born population - Canada (%)
Place of birth for the foreign-born population - Other Northern America (%)
Place of birth for the foreign-born population - Other (%)
Latest news about races in Dayton, OH collected exclusively by city-data.com from local newspapers, TV, and radio stations
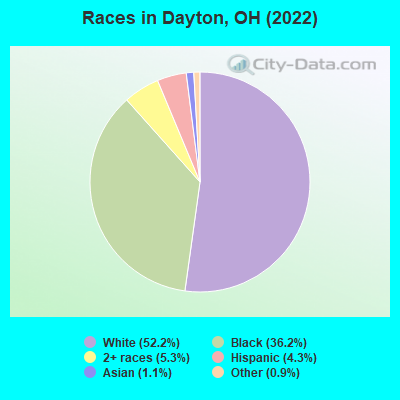
According to 2022 data, the most numerous races in Dayton, OH are White alone (70,938 residents), Black alone (49,199 residents), and Two or more races (7,220 residents). 94.3% of Dayton residents speak English at home. 5.0% of Dayton, OH residents are foreign-born (1.7% born in Latin America, 1.5% born in Asia, 1.3% born in Africa), which is 19.9% greater than the foreign-born rate of 4.0% across the entire state of Ohio.
Race distribution in Dayton
2000 2022
87,487 52.6% White alone 71,291 42.9% Black alone 2,793 1.7% Two or more races 2,626 1.6% Hispanic 1,041 0.6% Asian alone 475 0.3% American Indian alone 411 0.2% Other race alone 55 0.03% Native Hawaiian and Other
70,938 52.2% White alone 49,199 36.2% Black alone 7,220 5.3% Two or more races 5,904 4.3% Hispanic 1,445 1.1% Asian alone 1,171 0.9% Other race alone 61 0.04% American Indian alone
2000 2022
9,538,111 84.0% White alone 1,290,662 11.4% Black alone 217,123 1.9% Hispanic 137,770 1.2% Two or more races 131,670 1.2% Asian alone 21,985 0.2% American Indian alone 13,483 0.1% Other race alone 2,336 0.02% Native Hawaiian and Other
8,948,793 76.1% White alone 1,401,403 11.9% Black alone 529,291 4.5% Two or more races 517,232 4.4% Hispanic 293,387 2.5% Asian alone 52,805 0.4% Other race alone 9,785 0.08% American Indian alone 3,362 0.03% Native Hawaiian and Other
Income and house value in Dayton Median household income in 2022 $51,962 White non-Hispanic householders$34,994 Black householders$31,653 Asian householders$83,622 Some other race householders$40,556 Two or more races householders$46,431 Hispanic or Latino race householdersMedian 2022 house value $105,463 White Non-Hispanic householders$83,931 Black or African American householders$94,038 American Indian or Alaska Native householders $162,149 Asian householders$97,700 Some other race householders$108,832 Two or more races householders$99,604 Hispanic or Latino householders
Median age by race in Dayton
40.6 Median age for White residents40.8 40.3 38.9 Median age for Black or African American residents33.7 41.7 58.3 Median age for American Indian / Alaska Native residents-666,666,666.0 -666,666,666.0 28.9 Median age for Asian residents28.9 28.7 -666,666,666.0 Median age for Native Hawaiian / Pacific Islander residents-666,666,666.0 -666,666,666.0 37.7 Median age for Other race residents37.3 40.2 27.1 Median age for Two or more races residents21.4 28.6 41.1 Median age for White alone residents41.3 40.6 23.4 Median age for Hispanic or Latino residents27.1 18.7
Owner/renter occupied households by race in Dayton
House owners and renters - White residents 22,214 63.4% Owner occupied12,824 36.6% Renter occupiedHouse owners and renters - Black or African American residents 8,694 37.0% Owner occupied14,788 63.0% Renter occupiedHouse owners and renters - American Indian / Alaska Native residents 15 5.4% Owner occupied271 94.6% Renter occupiedHouse owners and renters - Asian residents 167 26.6% Owner occupied461 73.4% Renter occupiedHouse owners and renters - Native Hawaiian / Pacific Islander residents 8 100.0% Renter occupiedHouse owners and renters - Other race residents 405 34.3% Owner occupied777 65.7% Renter occupiedHouse owners and renters - Two or more races residents 1,206 36.0% Owner occupied2,140 64.0% Renter occupiedHouse owners and renters - White alone residents 22,073 63.5% Owner occupied12,711 36.5% Renter occupiedHouse owners and renters - Hispanic or Latino residents 608 47.5% Owner occupied673 52.5% Renter occupied
Language usage in Dayton
English speakers - Total 94.3% of residents of Dayton speak English at home.
2.9% of residents speak Spanish at home 2,560 69.4% Speak English very well1,129 30.6% Speak English less than very well2.9% of residents speak other language at home 2,147 58.9% Speak English very well1,501 41.1% Speak English less than very well
English speakers - Born in the United States 96.2% of residents of Dayton speak English at home.
2.2% of residents speak Spanish at home 573 73.7% Speak English very well205 26.3% Speak English less than very well1.6% of residents speak other language at home 520 90.0% Speak English very well58 10.0% Speak English less than very well
English speakers - Native, born elsewhere 76.1% of residents of Dayton speak English at home.
12.1% of residents speak Spanish at home 243 100.0% Speak English very well11.7% of residents speak other language at home 235 100.0% Speak English very well
English speakers - Foreign-born 28.9% of residents of Dayton speak English at home.
20.5% of residents speak Spanish at home 295 29.1% Speak English very well720 70.9% Speak English less than very well50.6% of residents speak other language at home 1,121 44.8% Speak English very well1,384 55.2% Speak English less than very well
White (Caucasian) - Speak only English Native:
97.8% (66,569)Foreign-born:
25.6% (411)
White (Caucasian) - Speak another language Native:
2.2% (1,522)Foreign-born:
74.4% (1,197)
Black or African American - Speak only English Native:
99.1% (45,910)Foreign-born:
36.1% (504)
Black or African American - Speak another language Native:
0.9% (406)Foreign-born:
59.6% (832)
American Indian / Alaska Native - Speak another language Native:
40.1% (212)Foreign-born:
96.6% (13)
Asian - Speak only English Native:
37.2% (188)Foreign-born:
13.7% (183)
Asian - Speak another language Native:
61.3% (310)Foreign-born:
85.9% (1,154)
Other race - Speak only English Native:
55.2% (998)Foreign-born:
2.1% (26)
Other race - Speak another language Native:
44.6% (806)Foreign-born:
97.9% (1,243)
Two or more races - Speak only English Native:
87.2% (7,211)Foreign-born:
11.7% (70)
Two or more races - Speak another language Native:
13.3% (1,097)Foreign-born:
93.2% (556)
White alone - Speak only English Native:
98.1% (65,379)Foreign-born:
25.6% (411)
White alone - Speak another language Native:
1.9% (1,261)Foreign-born:
74.4% (1,197)
Hispanic or Latino - Speak only English Native:
58.4% (2,428)Foreign-born:
21.4% (277)
Hispanic or Latino - Speak another language Native:
41.6% (1,732)Foreign-born:
78.6% (1,015)
Foreign-born residents in Dayton 6,824 residents are foreign born (1.7% Latin America , 1.5% Asia , 1.3% Africa ).
Marital status for residents in Dayton Marital status - White (Caucasian) population 15 years and over
Males 47.4% Never married33.5% Now married2.3% Separated2.5% Widowed14.2% DivorcedFemales 42.0% Never married35.0% Now married3.0% Separated5.6% Widowed14.4% DivorcedWomen who gave birth in the past 12 months Now married:
91.7% (665)Unmarried:
8.3% (60)
Women who did not give birth in the past 12 months Now married:
33.8% (5,993)Unmarried:
66.2% (11,726)
Marital status - Black or African American population 15 years and over
Males 54.8% Never married23.0% Now married1.5% Separated3.1% Widowed17.7% DivorcedFemales 48.8% Never married20.0% Now married2.7% Separated7.1% Widowed21.3% DivorcedWomen who gave birth in the past 12 months Now married:
13.3% (124)Unmarried:
86.7% (807)
Women who did not give birth in the past 12 months Now married:
24.3% (2,395)Unmarried:
75.7% (7,478)
Marital status - American Indian / Alaska Native population 15 years and over
Males 28.9% Never married45.8% Now married0.0% Separated17.5% Widowed7.8% DivorcedFemales 40.6% Never married47.4% Now married0.0% Separated4.2% Widowed7.8% DivorcedWomen who did not give birth in the past 12 months Now married:
51.9% (103)Unmarried:
48.1% (95)
Marital status - Asian population 15 years and over
Males 65.3% Never married26.9% Now married0.0% Separated5.8% Widowed2.0% DivorcedFemales 44.4% Never married39.5% Now married4.3% Separated5.9% Widowed5.9% DivorcedWomen who gave birth in the past 12 months Now married:
100.0% (8)Unmarried:
0.0% (0)
Women who did not give birth in the past 12 months Now married:
31.2% (178)Unmarried:
68.8% (394)
Marital status - Other race population 15 years and over
Males 53.1% Never married29.3% Now married3.7% Separated0.0% Widowed13.9% DivorcedFemales 53.8% Never married31.2% Now married3.5% Separated0.9% Widowed10.7% DivorcedWomen who gave birth in the past 12 months Now married:
29.6% (67)Unmarried:
70.4% (159)
Women who did not give birth in the past 12 months Now married:
32.9% (319)Unmarried:
67.1% (651)
Marital status - Two or more races population 15 years and over
Males 47.8% Never married44.1% Now married0.0% Separated0.9% Widowed7.1% DivorcedFemales 65.2% Never married24.6% Now married3.4% Separated3.3% Widowed3.5% DivorcedWomen who gave birth in the past 12 months Now married:
29.4% (44)Unmarried:
70.6% (105)
Women who did not give birth in the past 12 months Now married:
21.8% (548)Unmarried:
78.2% (1,965)
Marital status - White alone, not Hispanic / Latino population 15 years and over
Males 47.6% Never married33.0% Now married2.4% Separated2.6% Widowed14.5% DivorcedFemales 42.1% Never married35.2% Now married3.0% Separated5.6% Widowed14.1% DivorcedWomen who gave birth in the past 12 months Now married:
91.7% (665)Unmarried:
8.3% (60)
Women who did not give birth in the past 12 months Now married:
34.1% (5,993)Unmarried:
65.9% (11,587)
Marital status - Hispanic or Latino population 15 years and over
Males 52.4% Never married29.9% Now married2.9% Separated0.3% Widowed14.6% DivorcedFemales 53.4% Never married30.0% Now married6.1% Separated0.8% Widowed9.8% DivorcedWomen who gave birth in the past 12 months Now married:
20.3% (54)Unmarried:
79.7% (212)
Women who did not give birth in the past 12 months Now married:
32.5% (585)Unmarried:
67.5% (1,217)
Ancestries in Dayton
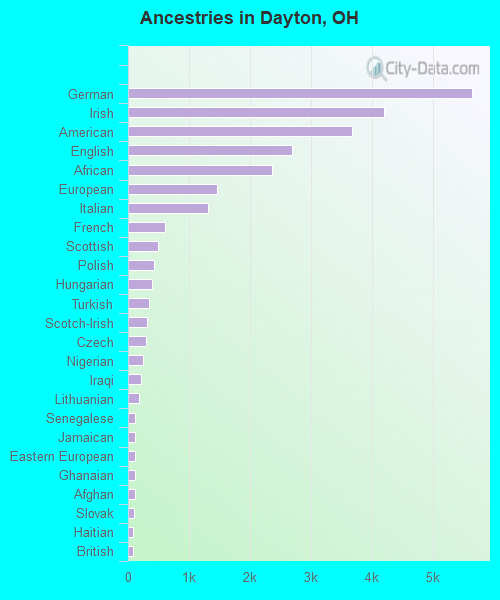
5,642 7.7% German4,206 5.7% Irish3,668 5.0% American2,697 3.7% English2,366 3.2% African1,457 2.0% European1,308 1.8% Italian601 0.8% French486 0.7% Scottish425 0.6% Polish399 0.5% Hungarian351 0.5% Turkish313 0.4% Scotch-Irish300 0.4% Czech242 0.3% Nigerian212 0.3% Iraqi183 0.2% Lithuanian119 0.2% Senegalese112 0.2% Jamaican108 0.1% Eastern European108 0.1% Ghanaian108 0.1% Afghan98 0.1% Slovak86 0.1% Haitian82 0.1% British80 0.1% Danish79 0.1% Greek75 0.1% Welsh72 0.10% Norwegian63 0.09% Arab63 0.09% Croatian62 0.08% Russian58 0.08% Macedonian53 0.07% Ethiopian48 0.07% Portuguese38 0.05% Swedish36 0.05% Dutch32 0.04% Lebanese25 0.03% Bulgarian23 0.03% Slovene22 0.03% Brazilian22 0.03% West Indian20 0.03% Finnish19 0.03% Scandinavian18 0.02% French Canadian15 0.02% Serbian14 0.02% Iranian13 0.02% Northern European13 0.02% Yugoslavian12 0.02% Swiss12 0.02% Ukrainian11 0.01% Austrian9 0.01% Armenian9 0.01% Moroccan9 0.01% Slavic7 0.01% Palestinian6 0.01% Romanian6 0.01% Pennsylvania German
Geographical mobility in Dayton Same house 1 year ago 54,807 76.3% White (Caucasian)37,886 77.9% Black or African American396 61.8% American Indian / Alaska Native1,305 68.4% Asian28 100.0% Native Hawaiian / Pacific Islander2,371 64.0% Other race8,499 82.3% Two or more races54,531 77.5% White alone, not Hispanic / Latino5,109 69.2% Hispanic or LatinoMoved within same county 5,567 7.7% White / Caucasian7,299 15.0% Black or African American41 6.4% American Indian / Alaska Native173 9.1% Asian855 23.1% Other race1,028 10.0% Two or more races5,330 7.6% White alone, not Hispanic / Latino955 12.9% Hispanic or LatinoMoved within same state 5,400 7.5% White / Caucasian2,387 4.9% Black or African American110 5.8% Asian199 5.4% Other race314 3.0% Two or more races5,377 7.6% White alone, not Hispanic / Latino361 4.9% Hispanic or LatinoMoved from different state 5,792 8.1% White / Caucasian411 0.8% Black or African American235 36.7% American Indian / Alaska Native89 4.7% Asian79 2.1% Other race490 4.7% Two or more races4,877 6.9% White alone, not Hispanic / Latino1,163 15.7% Hispanic or LatinoMoved from abroad 283 0.4% White625 1.3% Black or African American87 4.6% Asian184 5.0% Other race283 0.4% White alone, not Hispanic / Latino59 0.8% Hispanic or Latino
Children Nativity (place of birth) in Dayton
Children under 6 years - Living with two parents Both parents native 2,826 100.0% NativeBoth parents foreign-born 242 88.3% Native32 11.7% Foreign-bornOne native, one foreign-born parent 285 100.0% NativeChildren under 6 years - Living with one parent Native parent 5,445 98.8% Native66 1.2% Foreign-bornForeign-born parent 149 100.0% NativeChildren 6 to 17 years - Living with two parents Both parents native 5,556 99.7% Native15 0.3% Foreign-bornBoth parents foreign-born 408 40.4% Native601 59.6% Foreign-bornOne native, one foreign-born parent 658 98.4% Native11 1.6% Foreign-bornChildren 6 to 17 years - Living with one parent Native parent 8,448 100.0% NativeForeign-born parent 423 53.5% Native368 46.5% Foreign-born
Grandparents responsible for own grandchildren in Dayton
Grandparents (30 to 59 years) White / Caucasian 348 58.2% Responsible for grandchildren250 41.8% Not responsible for grandchildrenBlack or African American 178 60.5% Responsible for grandchildren116 39.5% Not responsible for grandchildrenOther race 48 100.0% Not responsible for grandchildrenTwo or more races 21 41.6% Responsible for grandchildren29 58.4% Not responsible for grandchildrenWhite alone, not Hispanic / Latino 350 58.0% Responsible for grandchildren253 42.0% Not responsible for grandchildrenHispanic or Latino 24 100.0% Not responsible for grandchildrenGrandparents (60 years and over) White / Caucasian 97 33.9% Responsible for grandchildren189 66.1% Not responsible for grandchildrenBlack or African American 310 36.4% Responsible for grandchildren542 63.6% Not responsible for grandchildrenTwo or more races 11 18.9% Responsible for grandchildren45 81.1% Not responsible for grandchildrenWhite alone, not Hispanic / Latino 97 33.5% Responsible for grandchildren193 66.5% Not responsible for grandchildren
Zip codes: 45377 , 45402 , 45403 , 45404 , 45405 , 45406 , 45409 , 45410 , 45414 , 45416 , 45417 , 45419 , 45420 , 45424 , 45426 , 45428 .