Races in Dunstable, Massachusetts (MA) Detailed Stats
Ancestries, Foreign-born residents, place of birth

Recent posts about races in Dunstable, Massachusetts on our local forum with over 2,400,000 registered users:
 | towns that offer the most jobs per dollar of house (58 replies) |
| Big MA Ancestry Data Thread by Town (31 replies) |
| Relocating to Mass...if we can afford it. (44 replies) |
| Relocating from Long Island NY to MA (45 replies) |
| Westford, Groton, Dunstable, Pepperell (13 replies) |
| Back to the drawing board on what town.... Thoughts on these options? (63 replies) |
Latest news about races in Dunstable, MA collected exclusively by city-data.com from local newspapers, TV, and radio stations
3.4% of Dunstable, MA residents are foreign-born (2.3% born in Europe, 0.5% born in Asia, 0.4% born in Latin America), which is 425.0% less than the foreign-born rate of 18.0% across the entire state of Massachusetts.
Race distribution in Dunstable

- 2,74697.1%White alone
- 421.5%Asian alone
- 220.8%Two or more races
- 150.5%Hispanic
- 30.1%Black alone
- 10.04%American Indian alone

2000
2022
-
- 5,198,35981.9%White alone
- 428,7296.8%Hispanic
- 318,3295.0%Black alone
- 236,7863.7%Asian alone
- 110,3381.7%Two or more races
- 43,5860.7%Other race alone
- 11,2640.2%American Indian alone
- 1,7060.03%Native Hawaiian and Other
Pacific Islander alone

-
- 4,676,62767.0%White alone
- 911,03813.0%Hispanic
- 501,4637.2%Asian alone
- 459,7406.6%Black alone
- 341,8894.9%Two or more races
- 84,4031.2%Other race alone
- 5,8380.08%American Indian alone
- 9760.01%Native Hawaiian and Other
Pacific Islander alone

Income and house value in Dunstable
- Median household income in 2022
- $169,650White non-Hispanic householders
- over $200,000Asian householders
- over $200,000Hispanic or Latino race householders
- Median 2022 house value
- $748,460White Non-Hispanic householders
- $989,279Asian householders
- $989,279Hispanic or Latino householders
Household income for White non-Hispanic householders

Household income for Asian householders

Household income for Hispanic or Latino race householders

Foreign-born residents in Dunstable
97 residents are foreign born (2.3% Europe, 0.5% Asia, 0.4% Latin America).
| This city: | 3.4% |
| Massachusetts: | 12.2% |
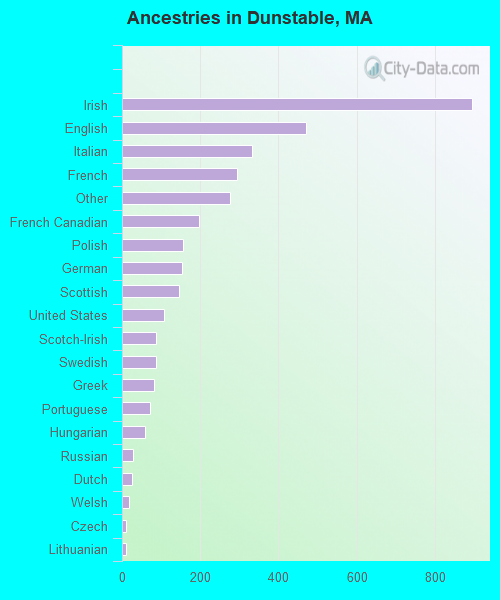
Ancestries in Dunstable

- 89425.4%Irish
- 47113.4%English
- 3339.5%Italian
- 2958.4%French
- 2767.8%Other
- 1975.6%French Canadian
- 1554.4%Polish
- 1534.4%German
- 1464.2%Scottish
- 1073.0%United States
- 882.5%Scotch-Irish
- 862.4%Swedish
- 822.3%Greek
- 722.0%Portuguese
- 591.7%Hungarian
- 290.8%Russian
- 250.7%Dutch
- 170.5%Welsh
- 110.3%Czech
- 110.3%Lithuanian
- 50.1%Danish
- 50.1%Norwegian
Zip codes: 01827.