Races in Durham, New Hampshire (NH) Detailed Stats
Data:
Races - White alone (%)
Races - White alone (% change since 2000)
Races - Black alone (%)
Races - Black alone (% change since 2000)
Races - American Indian alone (%)
Races - American Indian alone (% change since 2000)
Races - Asian alone (%)
Races - Asian alone (% change since 2000)
Races - Hispanic (%)
Races - Hispanic (% change since 2000)
Races - Native Hawaiian and Other Pacific Islander alone (%)
Races - Native Hawaiian and Other Pacific Islander alone (% change since 2000)
Races - Two or more races(%)
Races - Two or more races(% change since 2000)
Races - Other race alone (%)
Races - Other race alone (% change since 2000)
Racial diversity
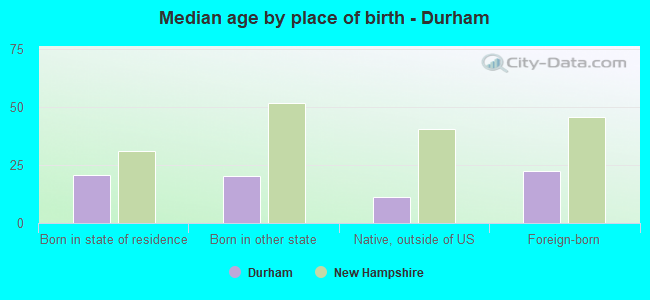
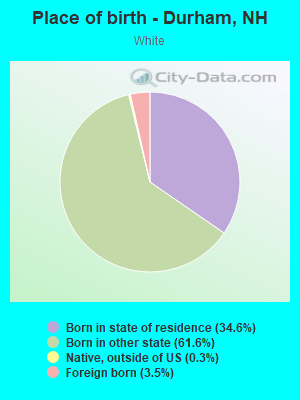
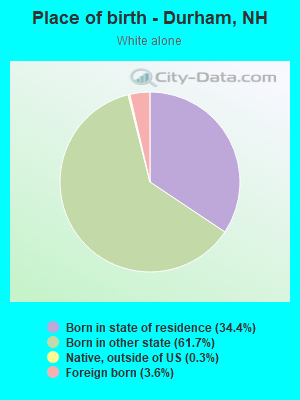
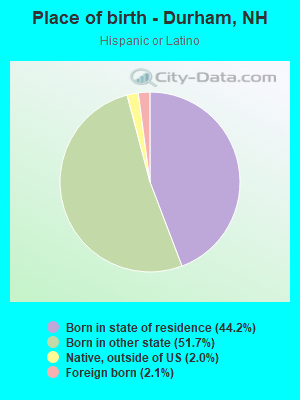
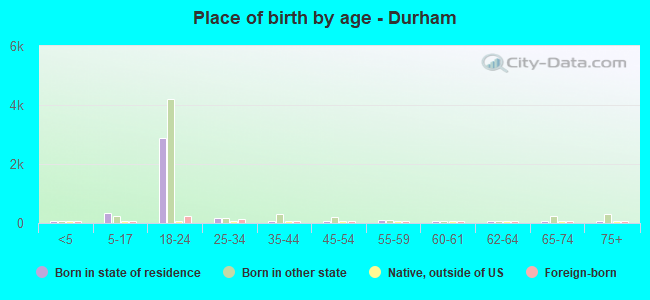
Place of birth - Born in state of residence (%)
Place of birth - Born in state of residence (%) - White
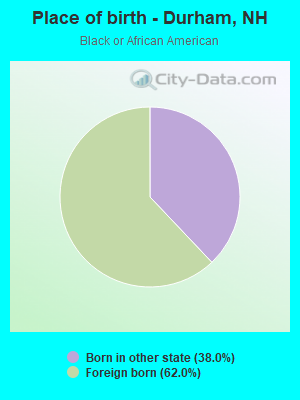
Place of birth - Born in state of residence (%) - Black or African American
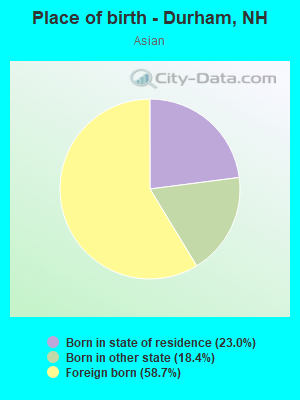
Place of birth - Born in state of residence (%) - Asian
Place of birth - Born in state of residence (%) - Hispanic or Latino
Place of birth - Born in state of residence (%) - American Indian and Alaska Native
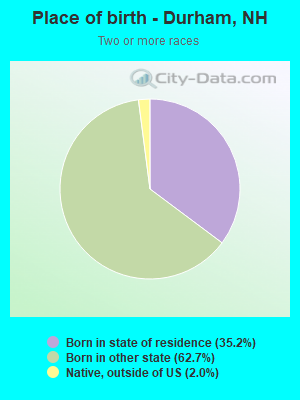
Place of birth - Born in state of residence (%) - Multirace
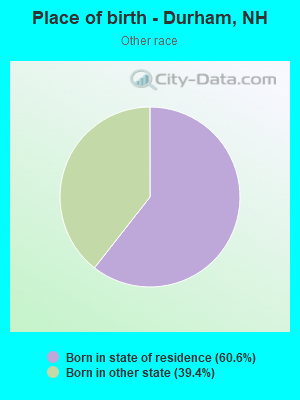
Place of birth - Born in state of residence (%) - Other Race
Place of birth - Born in other state (%)
Place of birth - Born in other state (%) - White
Place of birth - Born in other state (%) - Black or African American
Place of birth - Born in other state (%) - Asian
Place of birth - Born in other state (%) - Hispanic or Latino
Place of birth - Born in other state (%) - American Indian and Alaska Native
Place of birth - Born in other state (%) - Multirace
Place of birth - Born in other state (%) - Other Race
Place of birth - Native, outside of US (%)
Place of birth - Native, outside of US (%) - White
Place of birth - Native, outside of US (%) - Black or African American
Place of birth - Native, outside of US (%) - Asian
Place of birth - Native, outside of US (%) - Hispanic or Latino
Place of birth - Native, outside of US (%) - American Indian and Alaska Native
Place of birth - Native, outside of US (%) - Multirace
Place of birth - Native, outside of US (%) - Other Race
Place of birth - Foreign born (%)
Place of birth - Foreign born (%) - White
Place of birth - Foreign born (%) - Black or African American
Place of birth - Foreign born (%) - Asian
Place of birth - Foreign born (%) - Hispanic or Latino
Place of birth - Foreign born (%) - American Indian and Alaska Native
Place of birth - Foreign born (%) - Multirace
Place of birth - Foreign born (%) - Other Race
Residents speaking English at home (%)
Residents speaking English at home - Born in the United States (%)
Residents speaking English at home - Native, born elsewhere (%)
Residents speaking English at home - Foreign born (%)
Residents speaking Spanish at home (%)
Residents speaking Spanish at home - Born in the United States (%)
Residents speaking Spanish at home - Native, born elsewhere (%)
Residents speaking Spanish at home - Foreign born (%)
Residents speaking other language at home (%)
Residents speaking other language at home - Born in the United States (%)
Residents speaking other language at home - Native, born elsewhere (%)
Residents speaking other language at home - Foreign born (%)
Marital status - Never married (%)
Marital status - Now married (%)
Marital status - Separated (%)
Marital status - Widowed (%)
Marital status - Divorced (%)
Ancestries Reported - Arab (%)
Ancestries Reported - Czech (%)
Ancestries Reported - Danish (%)
Ancestries Reported - Dutch (%)
Ancestries Reported - English (%)
Ancestries Reported - French (%)
Ancestries Reported - French Canadian (%)
Ancestries Reported - German (%)
Ancestries Reported - Greek (%)
Ancestries Reported - Hungarian (%)
Ancestries Reported - Irish (%)
Ancestries Reported - Italian (%)
Ancestries Reported - Lithuanian (%)
Ancestries Reported - Norwegian (%)
Ancestries Reported - Polish (%)
Ancestries Reported - Portuguese (%)
Ancestries Reported - Russian (%)
Ancestries Reported - Scotch-Irish (%)
Ancestries Reported - Scottish (%)
Ancestries Reported - Slovak (%)
Ancestries Reported - Subsaharan African (%)
Ancestries Reported - Swedish (%)
Ancestries Reported - Swiss (%)
Ancestries Reported - Ukrainian (%)
Ancestries Reported - United States (%)
Ancestries Reported - Welsh (%)
Ancestries Reported - West Indian (%)
Ancestries Reported - Other (%)
Geographical mobility - Same house 1 year ago (%)
Geographical mobility - Same house 1 year ago (%) - White
Geographical mobility - Same house 1 year ago (%) - Black or African American
Geographical mobility - Same house 1 year ago (%) - Asian
Geographical mobility - Same house 1 year ago (%) - Hispanic or Latino
Geographical mobility - Same house 1 year ago (%) - American Indian and Alaska Native
Geographical mobility - Same house 1 year ago (%) - Multirace
Geographical mobility - Same house 1 year ago (%) - Other Race
Geographical mobility - Moved within same county (%)
Geographical mobility - Moved within same county (%) - White
Geographical mobility - Moved within same county (%) - Black or African American
Geographical mobility - Moved within same county (%) - Asian
Geographical mobility - Moved within same county (%) - Hispanic or Latino
Geographical mobility - Moved within same county (%) - American Indian and Alaska Native
Geographical mobility - Moved within same county (%) - Multirace
Geographical mobility - Moved within same county (%) - Other Race
Geographical mobility - Moved from different county within same state (%)
Geographical mobility - Moved from different county within same state (%) - White
Geographical mobility - Moved from different county within same state (%) - Black or African American
Geographical mobility - Moved from different county within same state (%) - Asian
Geographical mobility - Moved from different county within same state (%) - Hispanic or Latino
Geographical mobility - Moved from different county within same state (%) - American Indian and Alaska Native
Geographical mobility - Moved from different county within same state (%) - Multirace
Geographical mobility - Moved from different county within same state (%) - Other Race
Geographical mobility - Moved from different state (%)
Geographical mobility - Moved from different state (%) - White
Geographical mobility - Moved from different state (%) - Black or African American
Geographical mobility - Moved from different state (%) - Asian
Geographical mobility - Moved from different state (%) - Hispanic or Latino
Geographical mobility - Moved from different state (%) - American Indian and Alaska Native
Geographical mobility - Moved from different state (%) - Multirace
Geographical mobility - Moved from different state (%) - Other Race
Geographical mobility - Moved from abroad (%)
Geographical mobility - Moved from abroad (%) - White
Geographical mobility - Moved from abroad (%) - Black or African American
Geographical mobility - Moved from abroad (%) - Asian
Geographical mobility - Moved from abroad (%) - Hispanic or Latino
Geographical mobility - Moved from abroad (%) - American Indian and Alaska Native
Geographical mobility - Moved from abroad (%) - Multirace
Geographical mobility - Moved from abroad (%) - Other Race
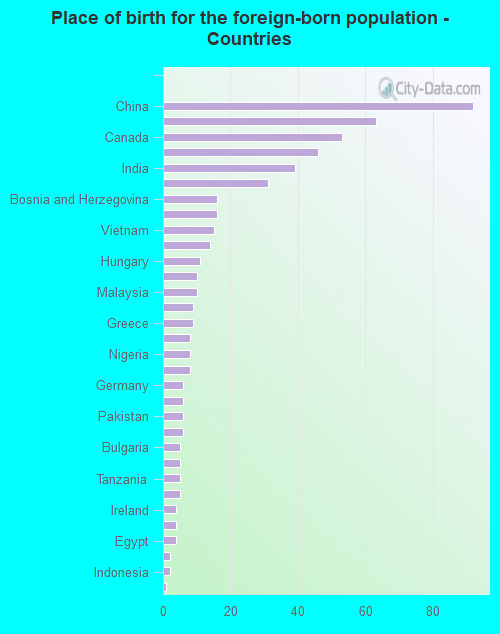
Place of birth for the foreign-born population - Ireland (%)
Place of birth for the foreign-born population - Denmark (%)
Place of birth for the foreign-born population - Norway (%)
Place of birth for the foreign-born population - Sweden (%)
Place of birth for the foreign-born population - United Kingdom (%)
Place of birth for the foreign-born population - England (%)
Place of birth for the foreign-born population - Scotland (%)
Place of birth for the foreign-born population - Other Northern Europe (%)
Place of birth for the foreign-born population - Austria (%)
Place of birth for the foreign-born population - Belgium (%)
Place of birth for the foreign-born population - France (%)
Place of birth for the foreign-born population - Germany (%)
Place of birth for the foreign-born population - Netherlands (%)
Place of birth for the foreign-born population - Switzerland (%)
Place of birth for the foreign-born population - Other Western Europe (%)
Place of birth for the foreign-born population - Greece (%)
Place of birth for the foreign-born population - Italy (%)
Place of birth for the foreign-born population - Portugal (%)
Place of birth for the foreign-born population - Spain (%)
Place of birth for the foreign-born population - Other Southern Europe (%)
Place of birth for the foreign-born population - Albania (%)
Place of birth for the foreign-born population - Belarus (%)
Place of birth for the foreign-born population - Bosnia and Herzegovina (%)
Place of birth for the foreign-born population - Bulgaria (%)
Place of birth for the foreign-born population - Croatia (%)
Place of birth for the foreign-born population - Czechoslovakia (%)
Place of birth for the foreign-born population - Hungary (%)
Place of birth for the foreign-born population - Latvia (%)
Place of birth for the foreign-born population - Lithuania (%)
Place of birth for the foreign-born population - North Macedonia (Macedonia) (%)
Place of birth for the foreign-born population - Moldova (%)
Place of birth for the foreign-born population - Poland (%)
Place of birth for the foreign-born population - Romania (%)
Place of birth for the foreign-born population - Russia (%)
Place of birth for the foreign-born population - Serbia (%)
Place of birth for the foreign-born population - Ukraine (%)
Place of birth for the foreign-born population - Other Eastern Europe (%)
Place of birth for the foreign-born population - China (%)
Place of birth for the foreign-born population - Hong Kong (%)
Place of birth for the foreign-born population - Taiwan (%)
Place of birth for the foreign-born population - Japan (%)
Place of birth for the foreign-born population - Korea (%)
Place of birth for the foreign-born population - Other Eastern Asia (%)
Place of birth for the foreign-born population - Afghanistan (%)
Place of birth for the foreign-born population - Bangladesh (%)
Place of birth for the foreign-born population - India (%)
Place of birth for the foreign-born population - Iran (%)
Place of birth for the foreign-born population - Kazakhstan (%)
Place of birth for the foreign-born population - Nepal (%)
Place of birth for the foreign-born population - Pakistan (%)
Place of birth for the foreign-born population - Sri Lanka (%)
Place of birth for the foreign-born population - Uzbekistan (%)
Place of birth for the foreign-born population - Other South Central Asia (%)
Place of birth for the foreign-born population - Burma (%)
Place of birth for the foreign-born population - Cambodia (%)
Place of birth for the foreign-born population - Indonesia (%)
Place of birth for the foreign-born population - Laos (%)
Place of birth for the foreign-born population - Malaysia (%)
Place of birth for the foreign-born population - Philippines (%)
Place of birth for the foreign-born population - Singapore (%)
Place of birth for the foreign-born population - Thailand (%)
Place of birth for the foreign-born population - Vietnam (%)
Place of birth for the foreign-born population - Other South Eastern Asia (%)
Place of birth for the foreign-born population - Armenia (%)
Place of birth for the foreign-born population - Iraq (%)
Place of birth for the foreign-born population - Israel (%)
Place of birth for the foreign-born population - Jordan (%)
Place of birth for the foreign-born population - Kuwait (%)
Place of birth for the foreign-born population - Lebanon (%)
Place of birth for the foreign-born population - Saudi Arabia (%)
Place of birth for the foreign-born population - Syria (%)
Place of birth for the foreign-born population - Turkey (%)
Place of birth for the foreign-born population - Yemen (%)
Place of birth for the foreign-born population - Other Western Asia (%)
Place of birth for the foreign-born population - Eritrea (%)
Place of birth for the foreign-born population - Ethiopia (%)
Place of birth for the foreign-born population - Kenya (%)
Place of birth for the foreign-born population - Somalia (%)
Place of birth for the foreign-born population - Uganda (%)
Place of birth for the foreign-born population - Zimbabwe (%)
Place of birth for the foreign-born population - Other Eastern Africa (%)
Place of birth for the foreign-born population - Cameroon (%)
Place of birth for the foreign-born population - Congo (%)
Place of birth for the foreign-born population - Democratic Republic of Congo (Zaire) (%)
Place of birth for the foreign-born population - Other Middle Africa (%)
Place of birth for the foreign-born population - Egypt (%)
Place of birth for the foreign-born population - Morocco (%)
Place of birth for the foreign-born population - Sudan (%)
Place of birth for the foreign-born population - Other Northern Africa (%)
Place of birth for the foreign-born population - South Africa (%)
Place of birth for the foreign-born population - Other Southern Africa (%)
Place of birth for the foreign-born population - Cabo Verde (%)
Place of birth for the foreign-born population - Ghana (%)
Place of birth for the foreign-born population - Liberia (%)
Place of birth for the foreign-born population - Nigeria (%)
Place of birth for the foreign-born population - Senegal (%)
Place of birth for the foreign-born population - Sierra Leone (%)
Place of birth for the foreign-born population - Other Western Africa (%)
Place of birth for the foreign-born population - Australia (%)
Place of birth for the foreign-born population - New Zealand (%)
Place of birth for the foreign-born population - Fiji (%)
Place of birth for the foreign-born population - Micronesia (%)
Place of birth for the foreign-born population - Bahamas (%)
Place of birth for the foreign-born population - Barbados (%)
Place of birth for the foreign-born population - Cuba (%)
Place of birth for the foreign-born population - Dominica (%)
Place of birth for the foreign-born population - Dominican Republic (%)
Place of birth for the foreign-born population - Grenada (%)
Place of birth for the foreign-born population - Haiti (%)
Place of birth for the foreign-born population - Jamaica (%)
Place of birth for the foreign-born population - St. Vincent and the Grenadines (%)
Place of birth for the foreign-born population - Trinidad and Tobago (%)
Place of birth for the foreign-born population - West Indies (%)
Place of birth for the foreign-born population - Other Caribbean (%)
Place of birth for the foreign-born population - Belize (%)
Place of birth for the foreign-born population - Costa Rica (%)
Place of birth for the foreign-born population - El Salvador (%)
Place of birth for the foreign-born population - Guatemala (%)
Place of birth for the foreign-born population - Honduras (%)
Place of birth for the foreign-born population - Mexico (%)
Place of birth for the foreign-born population - Nicaragua (%)
Place of birth for the foreign-born population - Panama (%)
Place of birth for the foreign-born population - Other Central America (%)
Place of birth for the foreign-born population - Argentina (%)
Place of birth for the foreign-born population - Bolivia (%)
Place of birth for the foreign-born population - Brazil (%)
Place of birth for the foreign-born population - Chile (%)
Place of birth for the foreign-born population - Colombia (%)
Place of birth for the foreign-born population - Ecuador (%)
Place of birth for the foreign-born population - Guyana (%)
Place of birth for the foreign-born population - Peru (%)
Place of birth for the foreign-born population - Uruguay (%)
Place of birth for the foreign-born population - Venezuela (%)
Place of birth for the foreign-born population - Other South America (%)
Place of birth for the foreign-born population - Canada (%)
Place of birth for the foreign-born population - Other Northern America (%)
Place of birth for the foreign-born population - Other (%)
Durham, Lee, & Madbury; similarities & differences. (17 replies)Moving to southeast NH, looking for suggestions (22 replies)Well NH, it's been fun.. (164 replies)Thinking of Moving my Family to New Hampshire. Looking for Thoughts from Residents. (21 replies)Life in Durham, Exexter, Keene, Hanover, NH? (25 replies)Moving to New Hampshire (Lebanon, Hanover, Keene, Grantham, Plainfield, Enfield, Etna) (38 replies)
Latest news about races in Durham, NH collected exclusively by city-data.com from local newspapers, TV, and radio stations
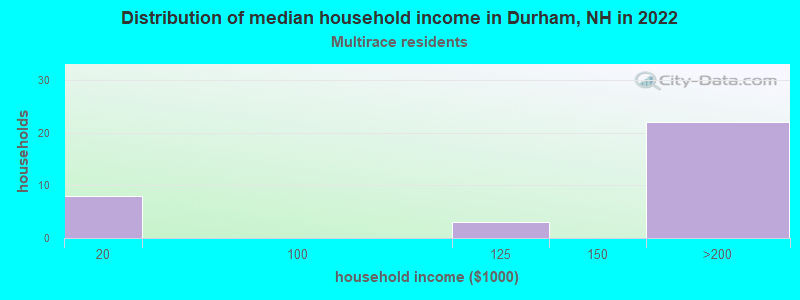
According to 2022 data, the most numerous races in Durham, NH are White alone (9,454 residents), Hispanic (426 residents), and Two or more races (472 residents). 91.3% of Durham residents speak English at home. 4.8% of Durham, NH residents are foreign-born (2.3% born in Asia, 1.6% born in Europe), which is 3.6% less than the foreign-born rate of 5.0% across the entire state of New Hampshire.
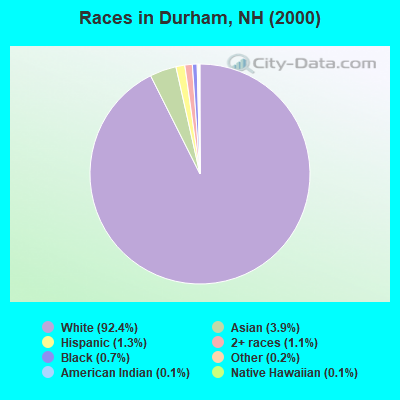
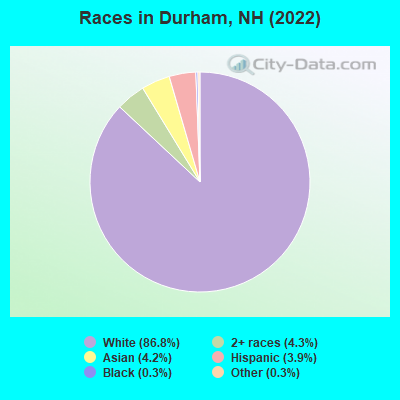
Race distribution in Durham
2000 2022
1,175,252 95.1% White alone 20,489 1.7% Hispanic 15,803 1.3% Asian alone 11,606 0.9% Two or more races 8,354 0.7% Black alone 2,698 0.2% American Indian alone 1,254 0.1% Other race alone 330 0.03% Native Hawaiian and Other
1,208,101 86.6% White alone 63,479 4.5% Hispanic 60,724 4.4% Two or more races 36,519 2.6% Asian alone 17,931 1.3% Black alone 6,615 0.5% Other race alone 1,014 0.07% American Indian alone 848 0.06% Native Hawaiian and Other
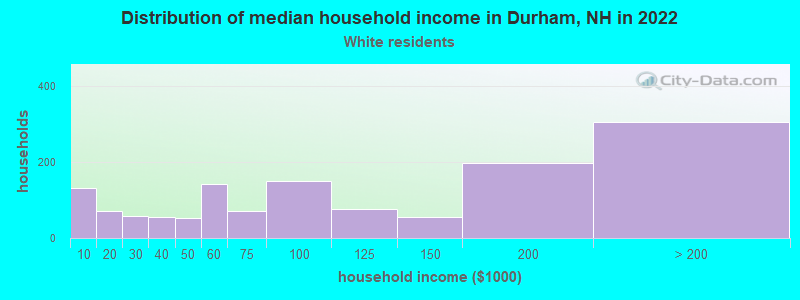
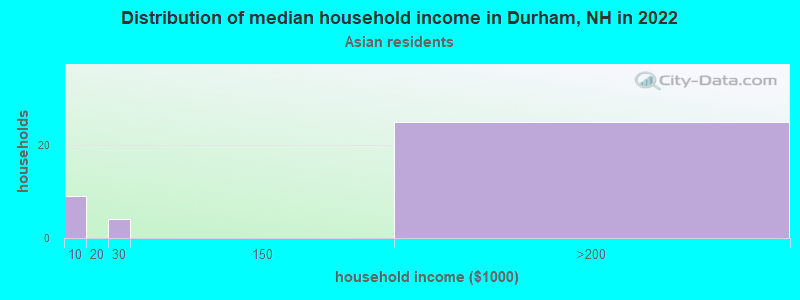
Income and house value in Durham Median household income in 2022 $93,286 White non-Hispanic householdersover $200,000 Two or more races householdersMedian 2022 house value $500,200 White Non-Hispanic householders$535,317 Black or African American householders$535,317 Two or more races householders
Median age by race in Durham
20.4 Median age for White residents20.1 21.1 23.1 Median age for Black or African American residents24.3 -772,779,699.3 -671,296,295.6 Median age for American Indian / Alaska Native residents-772,357,722.8 -763,157,894.0 26.7 Median age for Asian residents22.4 27.6 -666,666,666.0 Median age for Native Hawaiian / Pacific Islander residents-666,666,666.0 -666,666,666.0 20.3 Median age for Other race residents-672,531,768.6 19.6 19.4 Median age for Two or more races residents22.3 17.1 20.3 Median age for White alone residents19.9 20.8 20.7 Median age for Hispanic or Latino residents20.3 19.6
Owner/renter occupied households by race in Durham
House owners and renters - White residents 700 51.4% Owner occupied662 48.6% Renter occupiedHouse owners and renters - Black or African American residents 6 100.0% Renter occupiedHouse owners and renters - American Indian / Alaska Native residents 1 100.0% Owner occupiedHouse owners and renters - Asian residents 79 93.7% Owner occupied5 6.3% Renter occupiedHouse owners and renters - Two or more races residents 28 88.2% Owner occupied4 11.8% Renter occupiedHouse owners and renters - White alone residents 702 52.0% Owner occupied647 48.0% Renter occupiedHouse owners and renters - Hispanic or Latino residents 15 52.8% Owner occupied14 47.2% Renter occupied
Language usage in Durham
English speakers - Total 91.3% of residents of Durham speak English at home.
2.9% of residents speak Spanish at home 289 92.6% Speak English very well23 7.4% Speak English less than very well6.5% of residents speak other language at home 616 87.6% Speak English very well87 12.4% Speak English less than very well
English speakers - Born in the United States 94.8% of residents of Durham speak English at home.
4.1% of residents speak Spanish at home 256 97.7% Speak English very well6 2.3% Speak English less than very well1.6% of residents speak other language at home 98 98.0% Speak English very well2 2.0% Speak English less than very well
English speakers - Native, born elsewhere 17.4% of residents of Durham speak English at home.
4.3% of residents speak Spanish at home 2 100.0% Speak English very well78.3% of residents speak other language at home 36 100.0% Speak English very well
English speakers - Foreign-born 48.5% of residents of Durham speak English at home.
53.5% of residents speak other language at home 260 76.0% Speak English very well82 24.0% Speak English less than very well
White (Caucasian) - Speak only English Native:
97.3% (9,005)Foreign-born:
51.8% (173)
White (Caucasian) - Speak another language Native:
2.6% (240)Foreign-born:
46.7% (156)
Black or African American - Speak another language Native:
6.4% (1)Foreign-born:
73.2% (11)
Asian - Speak only English Native:
44.4% (86)Foreign-born:
46.6% (119)
Asian - Speak another language Native:
58.1% (112)Foreign-born:
56.8% (145)
White alone - Speak only English Native:
97.6% (8,906)Foreign-born:
51.9% (176)
White alone - Speak another language Native:
2.4% (219)Foreign-born:
47.6% (162)
Hispanic or Latino - Speak another language Native:
50.3% (192)Foreign-born:
100.0% (9)
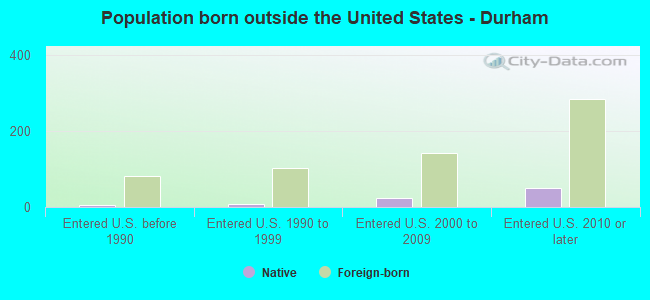
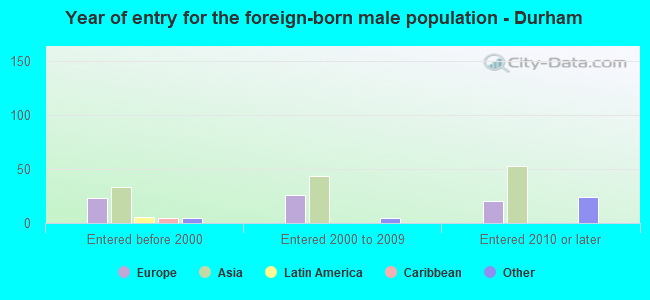
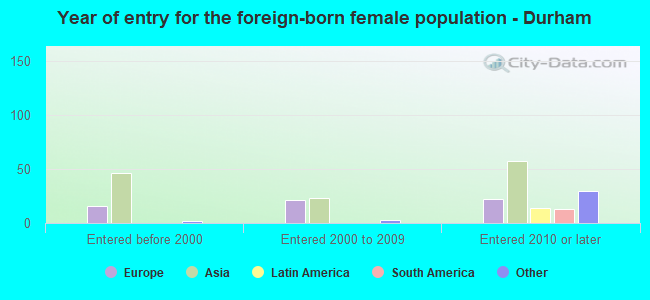
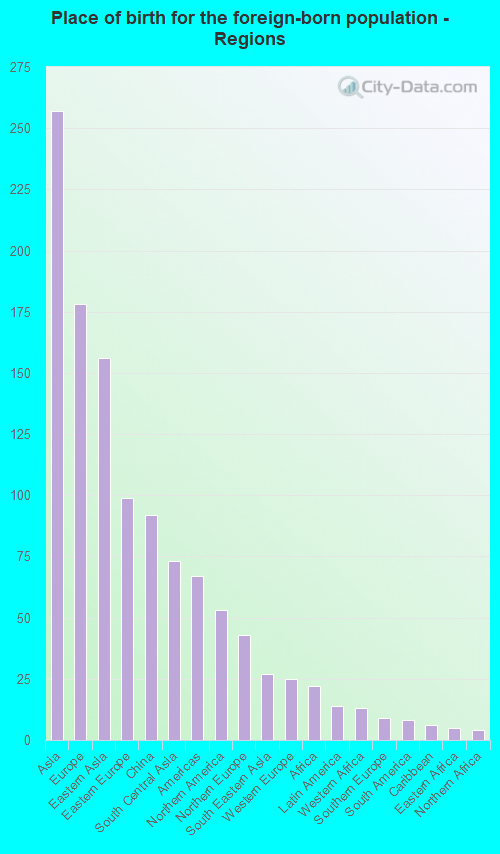
Foreign-born residents in Durham 526 residents are foreign born (2.3% Asia , 1.6% Europe ).
This city:
4.8%New Hampshire:
6.0%
Marital status for residents in Durham Marital status - White (Caucasian) population 15 years and over
Males 83.6% Never married14.6% Now married0.2% Separated0.1% Widowed1.5% DivorcedFemales 81.8% Never married12.0% Now married0.1% Separated2.4% Widowed3.7% DivorcedWomen who gave birth in the past 12 months Now married:
100.0% (13)Unmarried:
0.0% (0)
Women who did not give birth in the past 12 months Now married:
4.3% (185)Unmarried:
95.7% (4,128)
Marital status - Black or African American population 15 years and over
Males 100.0% Never married0.0% Now married0.0% Separated0.0% Widowed0.0% DivorcedFemales 100.0% Never married0.0% Now married0.0% Separated0.0% Widowed0.0% DivorcedWomen who did not give birth in the past 12 months Now married:
0.0% (0)Unmarried:
100.0% (6)
Marital status - Asian population 15 years and over
Males 73.4% Never married26.6% Now married0.0% Separated0.0% Widowed0.0% DivorcedFemales 83.6% Never married16.4% Now married0.0% Separated0.0% Widowed0.0% DivorcedWomen who did not give birth in the past 12 months Now married:
15.4% (26)Unmarried:
84.6% (145)
Marital status - Other race population 15 years and over
Males 100.0% Never married0.0% Now married0.0% Separated0.0% Widowed0.0% DivorcedFemales 67.9% Never married21.4% Now married0.0% Separated10.7% Widowed0.0% DivorcedWomen who did not give birth in the past 12 months Now married:
24.0% (11)Unmarried:
76.0% (34)
Marital status - Two or more races population 15 years and over
Males 93.5% Never married6.5% Now married0.0% Separated0.0% Widowed0.0% DivorcedFemales 96.5% Never married3.5% Now married0.0% Separated0.0% Widowed0.0% DivorcedWomen who did not give birth in the past 12 months Now married:
2.7% (9)Unmarried:
97.3% (327)
Marital status - White alone, not Hispanic / Latino population 15 years and over
Males 83.7% Never married14.6% Now married0.2% Separated0.1% Widowed1.4% DivorcedFemales 81.6% Never married12.2% Now married0.1% Separated2.4% Widowed3.8% DivorcedWomen who gave birth in the past 12 months Now married:
100.0% (14)Unmarried:
0.0% (0)
Women who did not give birth in the past 12 months Now married:
4.4% (186)Unmarried:
95.6% (4,088)
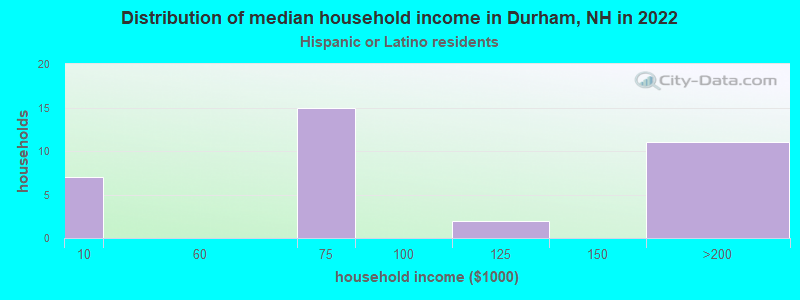
Marital status - Hispanic or Latino population 15 years and over
Males 83.1% Never married14.1% Now married0.0% Separated0.0% Widowed2.8% DivorcedFemales 95.7% Never married4.3% Now married0.0% Separated0.0% Widowed0.0% DivorcedWomen who did not give birth in the past 12 months Now married:
3.3% (7)Unmarried:
96.7% (191)
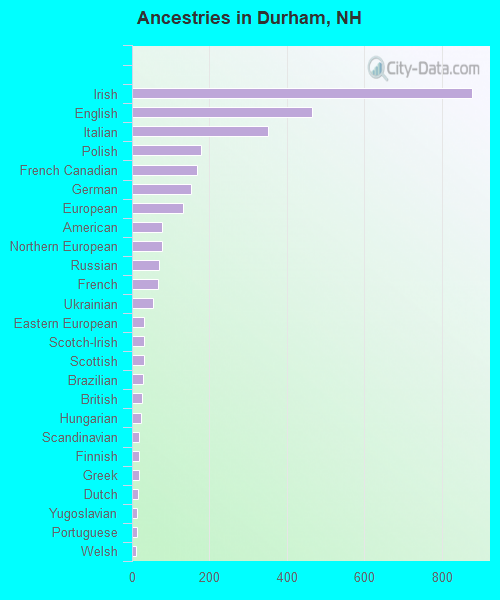
Ancestries in Durham
878 22.4% Irish465 11.9% English350 8.9% Italian179 4.6% Polish169 4.3% French Canadian153 3.9% German131 3.3% European78 2.0% American78 2.0% Northern European69 1.8% Russian66 1.7% French54 1.4% Ukrainian32 0.8% Eastern European32 0.8% Scotch-Irish32 0.8% Scottish28 0.7% Brazilian25 0.6% British23 0.6% Hungarian19 0.5% Scandinavian18 0.5% Finnish18 0.5% Greek16 0.4% Dutch14 0.4% Yugoslavian12 0.3% Portuguese11 0.3% Welsh10 0.3% Turkish10 0.3% Albanian10 0.3% Swedish9 0.2% Nigerian8 0.2% Canadian6 0.2% Armenian6 0.2% Iranian5 0.1% Austrian5 0.1% Ghanaian5 0.1% Croatian4 0.1% Norwegian4 0.1% Egyptian1 0.03% Haitian
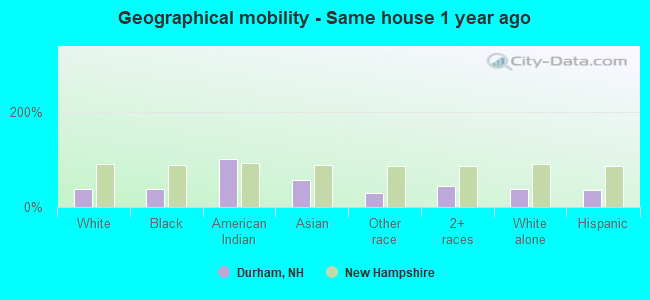
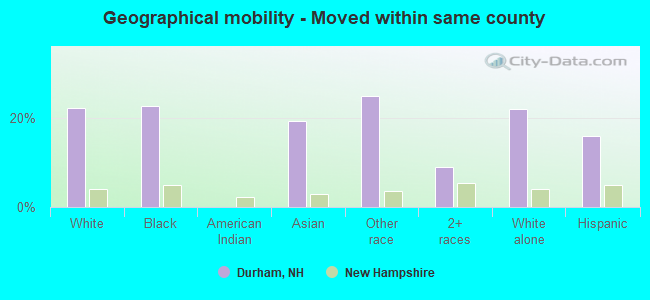
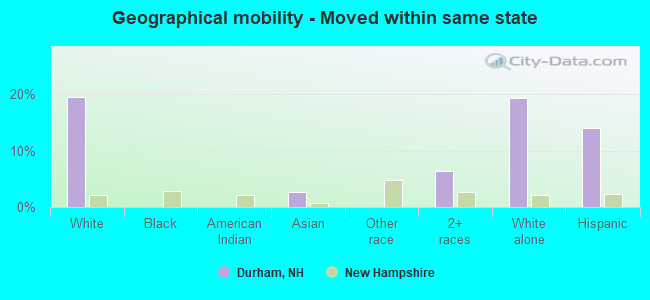
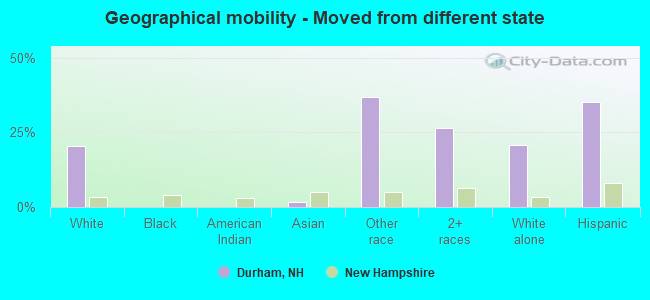
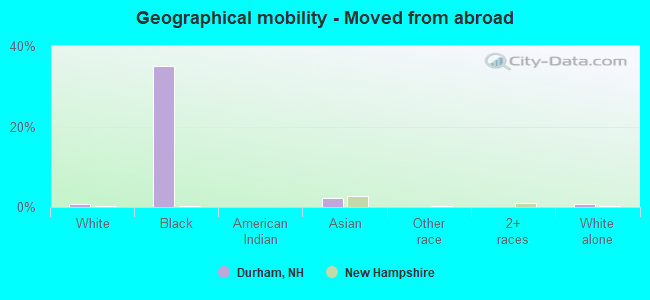
Geographical mobility in Durham Same house 1 year ago 3,528 36.9% White (Caucasian)10 37.9% Black or African American2 100.0% American Indian / Alaska Native253 55.5% Asian15 28.7% Other race328 43.2% Two or more races3,506 37.1% White alone, not Hispanic / Latino153 36.3% Hispanic or LatinoMoved within same county 2,118 22.2% White / Caucasian6 22.5% Black or African American87 19.2% Asian13 24.8% Other race69 9.0% Two or more races2,065 21.9% White alone, not Hispanic / Latino67 15.9% Hispanic or LatinoMoved within same state 1,865 19.5% White / Caucasian12 2.6% Asian49 6.4% Two or more races1,828 19.4% White alone, not Hispanic / Latino59 14.1% Hispanic or LatinoMoved from different state 1,945 20.4% White / Caucasian8 1.8% Asian20 36.9% Other race201 26.4% Two or more races1,953 20.7% White alone, not Hispanic / Latino148 35.1% Hispanic or LatinoMoved from abroad 65 0.7% White9 34.9% Black or African American10 2.2% Asian74 0.8% White alone, not Hispanic / Latino
Children Nativity (place of birth) in Durham
Children under 6 years - Living with two parents Both parents native 85 100.0% NativeBoth parents foreign-born 11 100.0% NativeOne native, one foreign-born parent 6 100.0% NativeChildren under 6 years - Living with one parent Native parent 4 100.0% Native
Children 6 to 17 years - Living with two parents Both parents native 355 100.0% NativeBoth parents foreign-born 22 100.0% NativeOne native, one foreign-born parent 8 100.0% NativeChildren 6 to 17 years - Living with one parent Native parent 142 100.0% Native
Grandparents responsible for own grandchildren in Durham
Grandparents (30 to 59 years) White / Caucasian 6 100.0% Not responsible for grandchildrenTwo or more races 3 100.0% Not responsible for grandchildrenWhite alone, not Hispanic / Latino 6 100.0% Not responsible for grandchildrenHispanic or Latino 2 100.0% Not responsible for grandchildren
Grandparents (60 years and over) White / Caucasian 28 100.0% Not responsible for grandchildrenWhite alone, not Hispanic / Latino 28 100.0% Not responsible for grandchildren