Races in East Flat Rock, North Carolina (NC) Detailed Stats
Data:
Races - White alone (%)
Races - White alone (% change since 2000)
Races - Black alone (%)
Races - Black alone (% change since 2000)
Races - American Indian alone (%)
Races - American Indian alone (% change since 2000)
Races - Asian alone (%)
Races - Asian alone (% change since 2000)
Races - Hispanic (%)
Races - Hispanic (% change since 2000)
Races - Native Hawaiian and Other Pacific Islander alone (%)
Races - Native Hawaiian and Other Pacific Islander alone (% change since 2000)
Races - Two or more races(%)
Races - Two or more races(% change since 2000)
Races - Other race alone (%)
Races - Other race alone (% change since 2000)
Racial diversity
Place of birth - Born in state of residence (%)
Place of birth - Born in state of residence (%) - White
Place of birth - Born in state of residence (%) - Black or African American
Place of birth - Born in state of residence (%) - Asian
Place of birth - Born in state of residence (%) - Hispanic or Latino
Place of birth - Born in state of residence (%) - American Indian and Alaska Native
Place of birth - Born in state of residence (%) - Multirace
Place of birth - Born in state of residence (%) - Other Race
Place of birth - Born in other state (%)
Place of birth - Born in other state (%) - White
Place of birth - Born in other state (%) - Black or African American
Place of birth - Born in other state (%) - Asian
Place of birth - Born in other state (%) - Hispanic or Latino
Place of birth - Born in other state (%) - American Indian and Alaska Native
Place of birth - Born in other state (%) - Multirace
Place of birth - Born in other state (%) - Other Race
Place of birth - Native, outside of US (%)
Place of birth - Native, outside of US (%) - White
Place of birth - Native, outside of US (%) - Black or African American
Place of birth - Native, outside of US (%) - Asian
Place of birth - Native, outside of US (%) - Hispanic or Latino
Place of birth - Native, outside of US (%) - American Indian and Alaska Native
Place of birth - Native, outside of US (%) - Multirace
Place of birth - Native, outside of US (%) - Other Race
Place of birth - Foreign born (%)
Place of birth - Foreign born (%) - White
Place of birth - Foreign born (%) - Black or African American
Place of birth - Foreign born (%) - Asian
Place of birth - Foreign born (%) - Hispanic or Latino
Place of birth - Foreign born (%) - American Indian and Alaska Native
Place of birth - Foreign born (%) - Multirace
Place of birth - Foreign born (%) - Other Race
Residents speaking English at home (%)
Residents speaking English at home - Born in the United States (%)
Residents speaking English at home - Native, born elsewhere (%)
Residents speaking English at home - Foreign born (%)
Residents speaking Spanish at home (%)
Residents speaking Spanish at home - Born in the United States (%)
Residents speaking Spanish at home - Native, born elsewhere (%)
Residents speaking Spanish at home - Foreign born (%)
Residents speaking other language at home (%)
Residents speaking other language at home - Born in the United States (%)
Residents speaking other language at home - Native, born elsewhere (%)
Residents speaking other language at home - Foreign born (%)
Marital status - Never married (%)
Marital status - Now married (%)
Marital status - Separated (%)
Marital status - Widowed (%)
Marital status - Divorced (%)
Ancestries Reported - Arab (%)
Ancestries Reported - Czech (%)
Ancestries Reported - Danish (%)
Ancestries Reported - Dutch (%)
Ancestries Reported - English (%)
Ancestries Reported - French (%)
Ancestries Reported - French Canadian (%)
Ancestries Reported - German (%)
Ancestries Reported - Greek (%)
Ancestries Reported - Hungarian (%)
Ancestries Reported - Irish (%)
Ancestries Reported - Italian (%)
Ancestries Reported - Lithuanian (%)
Ancestries Reported - Norwegian (%)
Ancestries Reported - Polish (%)
Ancestries Reported - Portuguese (%)
Ancestries Reported - Russian (%)
Ancestries Reported - Scotch-Irish (%)
Ancestries Reported - Scottish (%)
Ancestries Reported - Slovak (%)
Ancestries Reported - Subsaharan African (%)
Ancestries Reported - Swedish (%)
Ancestries Reported - Swiss (%)
Ancestries Reported - Ukrainian (%)
Ancestries Reported - United States (%)
Ancestries Reported - Welsh (%)
Ancestries Reported - West Indian (%)
Ancestries Reported - Other (%)
Geographical mobility - Same house 1 year ago (%)
Geographical mobility - Same house 1 year ago (%) - White
Geographical mobility - Same house 1 year ago (%) - Black or African American
Geographical mobility - Same house 1 year ago (%) - Asian
Geographical mobility - Same house 1 year ago (%) - Hispanic or Latino
Geographical mobility - Same house 1 year ago (%) - American Indian and Alaska Native
Geographical mobility - Same house 1 year ago (%) - Multirace
Geographical mobility - Same house 1 year ago (%) - Other Race
Geographical mobility - Moved within same county (%)
Geographical mobility - Moved within same county (%) - White
Geographical mobility - Moved within same county (%) - Black or African American
Geographical mobility - Moved within same county (%) - Asian
Geographical mobility - Moved within same county (%) - Hispanic or Latino
Geographical mobility - Moved within same county (%) - American Indian and Alaska Native
Geographical mobility - Moved within same county (%) - Multirace
Geographical mobility - Moved within same county (%) - Other Race
Geographical mobility - Moved from different county within same state (%)
Geographical mobility - Moved from different county within same state (%) - White
Geographical mobility - Moved from different county within same state (%) - Black or African American
Geographical mobility - Moved from different county within same state (%) - Asian
Geographical mobility - Moved from different county within same state (%) - Hispanic or Latino
Geographical mobility - Moved from different county within same state (%) - American Indian and Alaska Native
Geographical mobility - Moved from different county within same state (%) - Multirace
Geographical mobility - Moved from different county within same state (%) - Other Race
Geographical mobility - Moved from different state (%)
Geographical mobility - Moved from different state (%) - White
Geographical mobility - Moved from different state (%) - Black or African American
Geographical mobility - Moved from different state (%) - Asian
Geographical mobility - Moved from different state (%) - Hispanic or Latino
Geographical mobility - Moved from different state (%) - American Indian and Alaska Native
Geographical mobility - Moved from different state (%) - Multirace
Geographical mobility - Moved from different state (%) - Other Race
Geographical mobility - Moved from abroad (%)
Geographical mobility - Moved from abroad (%) - White
Geographical mobility - Moved from abroad (%) - Black or African American
Geographical mobility - Moved from abroad (%) - Asian
Geographical mobility - Moved from abroad (%) - Hispanic or Latino
Geographical mobility - Moved from abroad (%) - American Indian and Alaska Native
Geographical mobility - Moved from abroad (%) - Multirace
Geographical mobility - Moved from abroad (%) - Other Race
Place of birth for the foreign-born population - Ireland (%)
Place of birth for the foreign-born population - Denmark (%)
Place of birth for the foreign-born population - Norway (%)
Place of birth for the foreign-born population - Sweden (%)
Place of birth for the foreign-born population - United Kingdom (%)
Place of birth for the foreign-born population - England (%)
Place of birth for the foreign-born population - Scotland (%)
Place of birth for the foreign-born population - Other Northern Europe (%)
Place of birth for the foreign-born population - Austria (%)
Place of birth for the foreign-born population - Belgium (%)
Place of birth for the foreign-born population - France (%)
Place of birth for the foreign-born population - Germany (%)
Place of birth for the foreign-born population - Netherlands (%)
Place of birth for the foreign-born population - Switzerland (%)
Place of birth for the foreign-born population - Other Western Europe (%)
Place of birth for the foreign-born population - Greece (%)
Place of birth for the foreign-born population - Italy (%)
Place of birth for the foreign-born population - Portugal (%)
Place of birth for the foreign-born population - Spain (%)
Place of birth for the foreign-born population - Other Southern Europe (%)
Place of birth for the foreign-born population - Albania (%)
Place of birth for the foreign-born population - Belarus (%)
Place of birth for the foreign-born population - Bosnia and Herzegovina (%)
Place of birth for the foreign-born population - Bulgaria (%)
Place of birth for the foreign-born population - Croatia (%)
Place of birth for the foreign-born population - Czechoslovakia (%)
Place of birth for the foreign-born population - Hungary (%)
Place of birth for the foreign-born population - Latvia (%)
Place of birth for the foreign-born population - Lithuania (%)
Place of birth for the foreign-born population - North Macedonia (Macedonia) (%)
Place of birth for the foreign-born population - Moldova (%)
Place of birth for the foreign-born population - Poland (%)
Place of birth for the foreign-born population - Romania (%)
Place of birth for the foreign-born population - Russia (%)
Place of birth for the foreign-born population - Serbia (%)
Place of birth for the foreign-born population - Ukraine (%)
Place of birth for the foreign-born population - Other Eastern Europe (%)
Place of birth for the foreign-born population - China (%)
Place of birth for the foreign-born population - Hong Kong (%)
Place of birth for the foreign-born population - Taiwan (%)
Place of birth for the foreign-born population - Japan (%)
Place of birth for the foreign-born population - Korea (%)
Place of birth for the foreign-born population - Other Eastern Asia (%)
Place of birth for the foreign-born population - Afghanistan (%)
Place of birth for the foreign-born population - Bangladesh (%)
Place of birth for the foreign-born population - India (%)
Place of birth for the foreign-born population - Iran (%)
Place of birth for the foreign-born population - Kazakhstan (%)
Place of birth for the foreign-born population - Nepal (%)
Place of birth for the foreign-born population - Pakistan (%)
Place of birth for the foreign-born population - Sri Lanka (%)
Place of birth for the foreign-born population - Uzbekistan (%)
Place of birth for the foreign-born population - Other South Central Asia (%)
Place of birth for the foreign-born population - Burma (%)
Place of birth for the foreign-born population - Cambodia (%)
Place of birth for the foreign-born population - Indonesia (%)
Place of birth for the foreign-born population - Laos (%)
Place of birth for the foreign-born population - Malaysia (%)
Place of birth for the foreign-born population - Philippines (%)
Place of birth for the foreign-born population - Singapore (%)
Place of birth for the foreign-born population - Thailand (%)
Place of birth for the foreign-born population - Vietnam (%)
Place of birth for the foreign-born population - Other South Eastern Asia (%)
Place of birth for the foreign-born population - Armenia (%)
Place of birth for the foreign-born population - Iraq (%)
Place of birth for the foreign-born population - Israel (%)
Place of birth for the foreign-born population - Jordan (%)
Place of birth for the foreign-born population - Kuwait (%)
Place of birth for the foreign-born population - Lebanon (%)
Place of birth for the foreign-born population - Saudi Arabia (%)
Place of birth for the foreign-born population - Syria (%)
Place of birth for the foreign-born population - Turkey (%)
Place of birth for the foreign-born population - Yemen (%)
Place of birth for the foreign-born population - Other Western Asia (%)
Place of birth for the foreign-born population - Eritrea (%)
Place of birth for the foreign-born population - Ethiopia (%)
Place of birth for the foreign-born population - Kenya (%)
Place of birth for the foreign-born population - Somalia (%)
Place of birth for the foreign-born population - Uganda (%)
Place of birth for the foreign-born population - Zimbabwe (%)
Place of birth for the foreign-born population - Other Eastern Africa (%)
Place of birth for the foreign-born population - Cameroon (%)
Place of birth for the foreign-born population - Congo (%)
Place of birth for the foreign-born population - Democratic Republic of Congo (Zaire) (%)
Place of birth for the foreign-born population - Other Middle Africa (%)
Place of birth for the foreign-born population - Egypt (%)
Place of birth for the foreign-born population - Morocco (%)
Place of birth for the foreign-born population - Sudan (%)
Place of birth for the foreign-born population - Other Northern Africa (%)
Place of birth for the foreign-born population - South Africa (%)
Place of birth for the foreign-born population - Other Southern Africa (%)
Place of birth for the foreign-born population - Cabo Verde (%)
Place of birth for the foreign-born population - Ghana (%)
Place of birth for the foreign-born population - Liberia (%)
Place of birth for the foreign-born population - Nigeria (%)
Place of birth for the foreign-born population - Senegal (%)
Place of birth for the foreign-born population - Sierra Leone (%)
Place of birth for the foreign-born population - Other Western Africa (%)
Place of birth for the foreign-born population - Australia (%)
Place of birth for the foreign-born population - New Zealand (%)
Place of birth for the foreign-born population - Fiji (%)
Place of birth for the foreign-born population - Micronesia (%)
Place of birth for the foreign-born population - Bahamas (%)
Place of birth for the foreign-born population - Barbados (%)
Place of birth for the foreign-born population - Cuba (%)
Place of birth for the foreign-born population - Dominica (%)
Place of birth for the foreign-born population - Dominican Republic (%)
Place of birth for the foreign-born population - Grenada (%)
Place of birth for the foreign-born population - Haiti (%)
Place of birth for the foreign-born population - Jamaica (%)
Place of birth for the foreign-born population - St. Vincent and the Grenadines (%)
Place of birth for the foreign-born population - Trinidad and Tobago (%)
Place of birth for the foreign-born population - West Indies (%)
Place of birth for the foreign-born population - Other Caribbean (%)
Place of birth for the foreign-born population - Belize (%)
Place of birth for the foreign-born population - Costa Rica (%)
Place of birth for the foreign-born population - El Salvador (%)
Place of birth for the foreign-born population - Guatemala (%)
Place of birth for the foreign-born population - Honduras (%)
Place of birth for the foreign-born population - Mexico (%)
Place of birth for the foreign-born population - Nicaragua (%)
Place of birth for the foreign-born population - Panama (%)
Place of birth for the foreign-born population - Other Central America (%)
Place of birth for the foreign-born population - Argentina (%)
Place of birth for the foreign-born population - Bolivia (%)
Place of birth for the foreign-born population - Brazil (%)
Place of birth for the foreign-born population - Chile (%)
Place of birth for the foreign-born population - Colombia (%)
Place of birth for the foreign-born population - Ecuador (%)
Place of birth for the foreign-born population - Guyana (%)
Place of birth for the foreign-born population - Peru (%)
Place of birth for the foreign-born population - Uruguay (%)
Place of birth for the foreign-born population - Venezuela (%)
Place of birth for the foreign-born population - Other South America (%)
Place of birth for the foreign-born population - Canada (%)
Place of birth for the foreign-born population - Other Northern America (%)
Place of birth for the foreign-born population - Other (%)
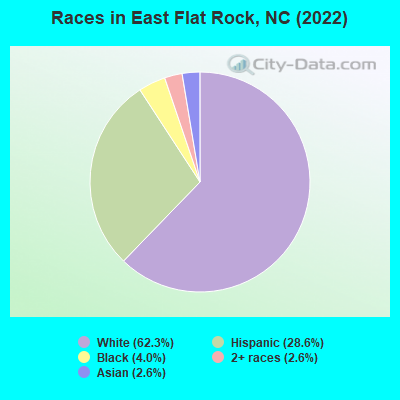
According to 2022 data, the most numerous races in East Flat Rock, NC are White alone (3,747 residents), Black alone (239 residents), and Hispanic (1,720 residents). 77.7% of East Flat Rock residents speak English at home. 16.4% of East Flat Rock, NC residents are foreign-born (12.0% born in Latin America, 2.5% born in Asia), which is 51.3% greater than the foreign-born rate of 8.0% across the entire state of North Carolina.
Race distribution in East Flat Rock
2000 2022
5,647,155 70.2% White alone 1,723,301 21.4% Black alone 378,963 4.7% Hispanic 112,416 1.4% Asian alone 95,333 1.2% American Indian alone 79,965 1.0% Two or more races 9,015 0.1% Other race alone 3,165 0.04% Native Hawaiian and Other
6,497,519 60.7% White alone 2,155,650 20.1% Black alone 1,114,799 10.4% Hispanic 438,061 4.1% Two or more races 341,052 3.2% Asian alone 91,758 0.9% American Indian alone 50,180 0.5% Other race alone 9,954 0.09% Native Hawaiian and Other
Income and house value in East Flat Rock Median household income in 2022 $51,740 White non-Hispanic householdersover $200,000 Asian householders$45,894 Hispanic or Latino race householdersMedian 2022 house value $277,505 White Non-Hispanic householders$147,784 Some other race householders$215,764 Two or more races householders$212,152 Hispanic or Latino householders
Median age by race in East Flat Rock
35.9 Median age for White residents38.4 32.5 34.9 Median age for Black or African American residents-653,753,026.0 44.3 -666,666,666.0 Median age for American Indian / Alaska Native residents-668,604,650.5 -682,971,013.8 38.5 Median age for Asian residents43.4 42.0 -743,471,581.4 Median age for Native Hawaiian / Pacific Islander residents-669,767,441.2 -666,666,666.0 27.2 Median age for Other race residents14.0 56.5 32.2 Median age for Two or more races residents40.7 20.6 37.6 Median age for White alone residents43.5 35.5 24.8 Median age for Hispanic or Latino residents23.2 21.6
Owner/renter occupied households by race in East Flat Rock
House owners and renters - White residents 976 57.6% Owner occupied718 42.4% Renter occupiedHouse owners and renters - Black or African American residents 8 15.1% Owner occupied43 84.9% Renter occupiedHouse owners and renters - Asian residents 107 91.3% Owner occupied10 8.7% Renter occupiedHouse owners and renters - Other race residents 134 74.2% Owner occupied47 25.8% Renter occupiedHouse owners and renters - Two or more races residents 141 88.0% Owner occupied19 12.0% Renter occupiedHouse owners and renters - White alone residents 961 66.2% Owner occupied490 33.8% Renter occupiedHouse owners and renters - Hispanic or Latino residents 221 37.1% Owner occupied375 62.9% Renter occupied
Language usage in East Flat Rock
English speakers - Total 77.7% of residents of East Flat Rock speak English at home.
18.6% of residents speak Spanish at home 456 42.2% Speak English very well624 57.8% Speak English less than very well3.7% of residents speak other language at home 23 10.6% Speak English very well193 89.4% Speak English less than very well
English speakers - Born in the United States 92.4% of residents of East Flat Rock speak English at home.
6.1% of residents speak Spanish at home 90 100.0% Speak English very well
English speakers - Native, born elsewhere 83.8% of residents of East Flat Rock speak English at home.
English speakers - Foreign-born 13.9% of residents of East Flat Rock speak English at home.
64.6% of residents speak Spanish at home 40 5.9% Speak English very well640 94.1% Speak English less than very well17.6% of residents speak other language at home 9 4.9% Speak English very well176 95.1% Speak English less than very well
White (Caucasian) - Speak only English Native:
92.8% (3,749)Foreign-born:
16.8% (53)
White (Caucasian) - Speak another language Native:
6.9% (280)Foreign-born:
63.9% (201)
Black or African American - Speak another language Native:
10.0% (36)Foreign-born:
100.0% (10)
Asian - Speak only English Native:
63.0% (23)Foreign-born:
11.2% (13)
Asian - Speak another language Native:
54.5% (20)Foreign-born:
59.5% (71)
Other race - Speak only English Native:
52.2% (123)Foreign-born:
14.6% (64)
Other race - Speak another language Native:
48.3% (114)Foreign-born:
84.4% (371)
White alone - Speak only English Native:
97.4% (3,445)Foreign-born:
65.2% (56)
White alone - Speak another language Native:
2.7% (95)Foreign-born:
35.9% (31)
Hispanic or Latino - Speak only English Native:
78.1% (727)Foreign-born:
10.2% (75)
Hispanic or Latino - Speak another language Native:
29.1% (271)Foreign-born:
90.7% (670)
Foreign-born residents in East Flat Rock 988 residents are foreign born (12.0% Latin America , 2.5% Asia ).
This city:
16.4%North Carolina:
8.3%
Marital status for residents in East Flat Rock Marital status - White (Caucasian) population 15 years and over
Males 29.3% Never married56.6% Now married6.5% Separated0.8% Widowed6.7% DivorcedFemales 29.6% Never married37.9% Now married1.0% Separated8.6% Widowed23.0% DivorcedWomen who gave birth in the past 12 months Now married:
79.6% (37)Unmarried:
20.4% (10)
Women who did not give birth in the past 12 months Now married:
35.0% (418)Unmarried:
65.0% (777)
Marital status - Black or African American population 15 years and over
Males 0.0% Never married100.0% Now married0.0% Separated0.0% Widowed0.0% DivorcedFemales 42.1% Never married6.8% Now married13.2% Separated35.3% Widowed2.6% DivorcedWomen who did not give birth in the past 12 months Now married:
14.9% (13)Unmarried:
85.1% (74)
Marital status - Asian population 15 years and over
Males 20.8% Never married79.2% Now married0.0% Separated0.0% Widowed0.0% DivorcedFemales 2.8% Never married91.0% Now married0.0% Separated6.2% Widowed0.0% DivorcedWomen who did not give birth in the past 12 months Now married:
97.1% (138)Unmarried:
2.9% (4)
Marital status - Other race population 15 years and over
Males 34.7% Never married65.3% Now married0.0% Separated0.0% Widowed0.0% DivorcedFemales 88.8% Never married11.2% Now married0.0% Separated0.0% Widowed0.0% DivorcedWomen who did not give birth in the past 12 months Now married:
0.0% (0)Unmarried:
100.0% (241)
Marital status - Two or more races population 15 years and over
Males 78.9% Never married21.1% Now married0.0% Separated0.0% Widowed0.0% DivorcedFemales 25.8% Never married74.2% Now married0.0% Separated0.0% Widowed0.0% DivorcedWomen who did not give birth in the past 12 months Now married:
0.0% (0)Unmarried:
100.0% (11)
Marital status - White alone, not Hispanic / Latino population 15 years and over
Males 26.0% Never married56.5% Now married8.1% Separated1.0% Widowed8.4% DivorcedFemales 26.1% Never married39.1% Now married1.2% Separated10.4% Widowed23.2% DivorcedWomen who gave birth in the past 12 months Now married:
79.6% (39)Unmarried:
20.4% (10)
Women who did not give birth in the past 12 months Now married:
34.7% (316)Unmarried:
65.3% (596)
Marital status - Hispanic or Latino population 15 years and over
Males 47.6% Never married52.4% Now married0.0% Separated0.0% Widowed0.0% DivorcedFemales 62.0% Never married25.0% Now married0.0% Separated0.0% Widowed13.0% DivorcedWomen who did not give birth in the past 12 months Now married:
25.0% (140)Unmarried:
75.0% (421)
Ancestries in East Flat Rock
762 23.2% Irish263 8.0% English212 6.5% American119 3.6% Scotch-Irish93 2.8% German78 2.4% Portuguese65 2.0% Scottish40 1.2% Canadian34 1.0% Italian26 0.8% European26 0.8% African13 0.4% Nigerian10 0.3% French9 0.3% Greek8 0.2% Czech8 0.2% Dutch
Children Nativity (place of birth) in East Flat Rock
Children under 6 years - Living with two parents Both parents native 147 100.0% NativeBoth parents foreign-born 39 100.0% NativeChildren under 6 years - Living with one parent Native parent 41 100.0% NativeChildren 6 to 17 years - Living with two parents Both parents native 358 100.0% NativeBoth parents foreign-born 148 100.0% NativeChildren 6 to 17 years - Living with one parent Native parent 502 100.0% NativeForeign-born parent 155 51.0% Native149 49.0% Foreign-born
Grandparents responsible for own grandchildren in East Flat Rock
Grandparents (30 to 59 years) White / Caucasian 94 75.5% Responsible for grandchildren31 24.5% Not responsible for grandchildrenBlack or African American 30 100.0% Responsible for grandchildrenTwo or more races 34 100.0% Responsible for grandchildrenWhite alone, not Hispanic / Latino 94 71.3% Responsible for grandchildren38 28.7% Not responsible for grandchildren
Grandparents (60 years and over) White / Caucasian 39 100.0% Responsible for grandchildrenBlack or African American 66 100.0% Not responsible for grandchildrenWhite alone, not Hispanic / Latino 42 100.0% Responsible for grandchildren