Estimated zip code population in 2022: 4,009 Zip code population in 2010: 3,203 Zip code population in 2000: 3,021
Houses and condos: 1,388 Renter-occupied apartments: 575
% of renters here:
41%
State:
33%
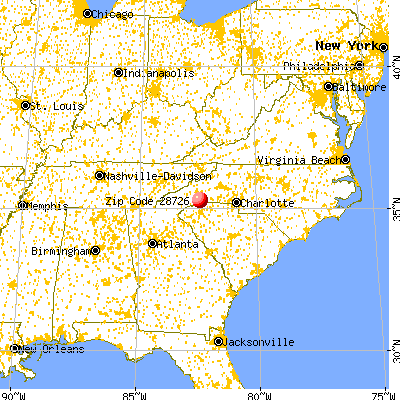
March 2022 cost of living index in zip code 28726: 89.5 (less than average, U.S. average is 100)
Land area: 2.4 sq. mi. Water area: 0.0 sq. mi.
Population density: 1,681 people per square mile
(low).
OSM Map
General Map
Google Map
MSN Map
OSM Map
General Map
Google Map
MSN Map
OSM Map
General Map
Google Map
MSN Map
OSM Map
General Map
Google Map
MSN Map
Please wait while loading the map...
Real estate property taxes paid for housing units in 2022:
This zip code:
0.5% ($1,021)
North Carolina:
0.6% ($1,769)
Median real estate property taxes paid for housing units with mortgages in 2022: $949 (0.5%) Median real estate property taxes paid for housing units with no mortgage in 2022: $1,098 (0.5%)
Business Search- 14 Million verified businesses
Males: 1,524
(38.0%)
Females: 2,487
(62.0%)
For population 25 years and over in 28726:
High school or higher: 83.5%
Bachelor's degree or higher: 10.7%
Graduate or professional degree: 1.4%
Unemployed: 4.9%
Mean travel time to work (commute): 16.5 minutes
For population 15 years and over in 28726:
Never married: 33.5%
Now married: 41.6%
Separated: 3.6%
Widowed: 6.0%
Divorced: 15.2%
Zip code 28726 compared to state average:
Black race population percentage significantly below state average.
Hispanic race population percentage above state average.
Median age significantly below state average.
Foreign-born population percentage above state average.
Number of college students significantly below state average.
Percentage of population with a bachelor's degree or higher significantly below state average.
Estimated median house/condo value in 2022: $205,463
28726:
$205,463
North Carolina:
$280,600
According to our research of North Carolina and other state lists, there were 4 registered sex offenders living in 28726 zip code as of May 28, 2024. The ratio of all residents to sex offenders in zip code 28726 is 553 to 1. The ratio of registered sex offenders to all residents in this zip code is near the state average.
Median resident age:
This zip code:
31.2 years
North Carolina median age:
39.2 years
Average household size:
This zip code:
2.8 people
North Carolina:
2.4 people
Averages for the 2020 tax year for zip code 28726, filed in 2021:
Average Adjusted Gross Income (AGI) in 2020: $36,852 (Individual Income Tax Returns)
Here:
$36,852
State:
$70,020
Salary/wage: $32,970 (reported on 80.9% of returns)
Here:
$32,970
State:
$58,387
(% of AGI for various income ranges: 1257.0% for AGIs below $25k, 3914.9% for AGIs $25k-50k, 6921.8% for AGIs $50k-75k, 7848.6% for AGIs $75k-100k, 17012.5% for AGIs $100k-200k)
Taxable interest for individuals: $459 (reported on 18.5% of returns)
This zip code:
$459
North Carolina:
$1,479
(% of AGI for various income ranges: 6.6% for AGIs below $25k, 8.3% for AGIs $25k-50k, 14.5% for AGIs $50k-75k, 48.6% for AGIs $75k-100k, 45.0% for AGIs $100k-200k)
Ordinary dividends: $1,988 (reported on 5.1% of returns)
Here:
$1,988
State:
$7,888
(% of AGI for various income ranges: 5.7% for AGIs below $25k, 7.3% for AGIs $25k-50k, 145.7% for AGIs $75k-100k)
Net capital gain/loss in AGI: +$3,422 (reported on 5.7% of returns)
Here:
+$3,422
State:
+$23,652
(% of AGI for various income ranges: 4.1% for AGIs $25k-50k, 417.1% for AGIs $75k-100k)
Profit/loss from business: +$12,352 (reported on 17.2% of returns)
Here:
+$12,352
State:
+$11,710
(% of AGI for various income ranges: 207.2% for AGIs below $25k, 248.8% for AGIs $25k-50k, 459.1% for AGIs $50k-75k, 1194.3% for AGIs $75k-100k)
Taxable individual retirement arrangement distribution: $11,412 (reported on 5.1% of returns)
28726:
$11,412
North Carolina:
$20,247
(% of AGI for various income ranges: 38.3% for AGIs below $25k, 79.5% for AGIs $25k-50k, 581.4% for AGIs $75k-100k)
Total itemized deductions: $33,900 (reported on 1.9% of returns)
Here:
$33,900
State:
$34,549
(% of AGI for various income ranges: 1452.9% for AGIs $75k-100k)
Charity contributions: $7,267 (reported on 1.9% of returns)
Here:
$7,267
State:
$13,360
(% of AGI for various income ranges: 198.2% for AGIs $50k-75k)
Taxes paid: $5,350 (reported on 2.5% of returns)
28726:
$5,350
State:
$7,586
(% of AGI for various income ranges: 305.7% for AGIs $75k-100k)
Earned income credit: $2,239 (reported on 26.1% of returns)
Here:
$2,239
State:
$2,337
(% of AGI for various income ranges: 114.5% for AGIs below $25k, 92.7% for AGIs $25k-50k)
Percentage of individuals using paid preparers for their 2020 taxes: 93.0%
Here:
93%
State:
93%
(% for various income ranges: 92.5% for AGIs below $25k, 94.5% for AGIs $25k-50k, 94.1% for AGIs $50k-75k, 90.0% for AGIs $75k-100k, 87.5% for AGIs $100k-200k)
Averages for the 2012 tax year for zip code 28726, filed in 2013:
Average Adjusted Gross Income (AGI) in 2012: $30,212 (Individual Income Tax Returns)
Here:
$30,212
State:
$54,937
Salary/wage: $27,308 (reported on 84.5% of returns)
Here:
$27,308
State:
$46,336
(% of AGI for various income ranges: 76.0% for AGIs below $25k, 84.7% for AGIs $25k-50k, 71.1% for AGIs $50k-75k, 75.3% for AGIs $75k-100k, 67.1% for AGIs $100k-200k)
Taxable interest for individuals: $700 (reported on 19.0% of returns)
This zip code:
$700
North Carolina:
$1,298
(% of AGI for various income ranges: 0.6% for AGIs below $25k, 0.3% for AGIs $25k-50k, 0.6% for AGIs $50k-75k, 0.1% for AGIs $75k-100k, 0.3% for AGIs $100k-200k)
Ordinary dividends: $820 (reported on 7.0% of returns)
Here:
$820
State:
$6,213
(% of AGI for various income ranges: 0.2% for AGIs below $25k, 0.1% for AGIs $25k-50k, 0.5% for AGIs $50k-75k)
Profit/loss from business: +$7,558 (reported on 13.4% of returns)
Here:
+$7,558
State:
+$10,311
(% of AGI for various income ranges: 9.2% for AGIs below $25k, 2.9% for AGIs $25k-50k, 0.9% for AGIs $50k-75k)
Taxable individual retirement arrangement distribution: $10,244 (reported on 6.3% of returns)
28726:
$10,244
North Carolina:
$15,575
Total itemized deductions: $16,535 (28% of AGI, reported on 16.2% of returns)
Here:
$16,535
State:
$23,438
Here:
27.8% of AGI
State:
21.5% of AGI
(% of AGI for various income ranges: 6.3% for AGIs below $25k, 6.4% for AGIs $25k-50k, 8.3% for AGIs $50k-75k, 14.9% for AGIs $75k-100k, 15.5% for AGIs $100k-200k)
Charity contributions: $4,011 (reported on 12.7% of returns)
Here:
$4,011
State:
$4,687
(% of AGI for various income ranges: 0.6% for AGIs below $25k, 1.1% for AGIs $25k-50k, 1.9% for AGIs $50k-75k, 2.8% for AGIs $75k-100k, 3.7% for AGIs $100k-200k)
Taxes paid: $4,209 (reported on 16.2% of returns)
28726:
$4,209
State:
$8,823
(% of AGI for various income ranges: 0.8% for AGIs below $25k, 1.1% for AGIs $25k-50k, 2.3% for AGIs $50k-75k, 4.4% for AGIs $75k-100k, 5.9% for AGIs $100k-200k)
Earned income credit: $2,383 (reported on 28.9% of returns)
Here:
$2,383
State:
$2,376
(% of AGI for various income ranges: 7.4% for AGIs below $25k, 1.5% for AGIs $25k-50k)
Percentage of individuals using paid preparers for their 2012 taxes: 64.1%
Here:
64%
State:
53%
(% for various income ranges: 62.0% for AGIs below $25k, 64.9% for AGIs $25k-50k, 68.8% for AGIs $50k-75k, 66.7% for AGIs $75k-100k, 75.0% for AGIs $100k-200k)
Averages for the 2004 tax year for zip code 28726, filed in 2005:
Average Adjusted Gross Income (AGI) in 2004: $28,634 (Individual Income Tax Returns)
Here:
$28,634
State:
$45,376
Salary/wage: $26,682 (reported on 86.2% of returns)
Here:
$26,682
State:
$39,442
(% of AGI for various income ranges: 86.1% for AGIs below $10k, 77.5% for AGIs $10k-25k, 85.7% for AGIs $25k-50k, 79.9% for AGIs $50k-75k, 79.0% for AGIs $75k-100k, 59.7% for AGIs over 100k)
Taxable interest for individuals: $997 (reported on 28.4% of returns)
This zip code:
$997
North Carolina:
$1,515
(% of AGI for various income ranges: 4.7% for AGIs below $10k, 1.2% for AGIs $10k-25k, 0.6% for AGIs $25k-50k, 1.3% for AGIs $50k-75k, 0.2% for AGIs $75k-100k, 0.4% for AGIs over 100k)
Taxable dividends: $1,255 (reported on 11.7% of returns)
Here:
$1,255
State:
$4,016
(% of AGI for various income ranges: 1.0% for AGIs below $10k, 0.4% for AGIs $10k-25k, 0.4% for AGIs $25k-50k, 0.7% for AGIs $50k-75k, 0.5% for AGIs $75k-100k, 0.1% for AGIs over 100k)
Net capital gain/loss: +$2,925 (reported on 8.0% of returns)
Here:
+$2,925
State:
+$11,152
(% of AGI for various income ranges: -0.9% for AGIs below $10k, 0.0% for AGIs $10k-25k, 0.2% for AGIs $25k-50k, 0.3% for AGIs $50k-75k, 5.9% for AGIs $75k-100k)
Profit/loss from business: +$6,076 (reported on 15.6% of returns)
Here:
+$6,076
State:
+$9,490
(% of AGI for various income ranges: 7.4% for AGIs below $10k, 6.8% for AGIs $10k-25k, 3.0% for AGIs $25k-50k, 1.3% for AGIs $50k-75k, 3.1% for AGIs $75k-100k)
IRA payment deduction: $2,643 (reported on 1.0% of returns)
28726:
$2,643
North Carolina:
$2,967
Total itemized deductions: $13,356 (26% of AGI, reported on 19.9% of returns)
Here:
$13,356
State:
$19,464
Here:
25.8% of AGI
State:
22.7% of AGI
(% of AGI for various income ranges: 7.1% for AGIs below $10k, 5.6% for AGIs $10k-25k, 7.8% for AGIs $25k-50k, 12.2% for AGIs $50k-75k, 13.1% for AGIs $75k-100k, 11.3% for AGIs over 100k)
Charity contributions deductions: $3,394 (6% of AGI, reported on 16.1% of returns)
Here:
$3,394
State:
$4,035
Here:
6.3% of AGI
State:
4.5% of AGI
(% of AGI for various income ranges: 1.1% for AGIs $10k-25k, 1.5% for AGIs $25k-50k, 2.3% for AGIs $50k-75k, 4.2% for AGIs $75k-100k, 1.6% for AGIs over 100k)
Total tax: $3,075 (reported on 65.4% of returns)
28726:
$3,075
State:
$7,257
(% of AGI for various income ranges: 2.8% for AGIs below $10k, 3.6% for AGIs $10k-25k, 5.9% for AGIs $25k-50k, 8.6% for AGIs $50k-75k, 10.5% for AGIs $75k-100k, 13.9% for AGIs over 100k)
Earned income credit: $1,722 (reported on 23.3% of returns)
Here:
$1,722
State:
$1,851
Percentage of individuals using paid preparers for their 2004 taxes: 63.6%
Here:
64%
State:
62%
(% for various income ranges: 56.8% for AGIs below $10k, 67.1% for AGIs $10k-25k, 63.2% for AGIs $25k-50k, 68.2% for AGIs $50k-75k, 65.5% for AGIs $75k-100k, 61.1% for AGIs over 100k)
Household received Food Stamps/SNAP in the past 12 months: 344 Household did not receive Food Stamps/SNAP in the past 12 months: 1,079
Women who had a birth in the past 12 months: 50 (41 now married, 9 unmarried) Women who did not have a birth in the past 12 months: 1,124 (284 now married, 835 unmarried)
Housing units in zip code 28726 with a mortgage: 334 (26 second mortgage, 27 both second mortgage and home equity loan) Median monthly owner costs for units with a mortgage: $1,267 Median monthly owner costs for units without a mortgage: $402
Residents with income below the poverty level in 2022:
This zip code:
12.4%
Whole state:
12.8%
Residents with income below 50% of the poverty level in 2022:
This zip code:
3.3%
Whole state:
6.8%
Median number of rooms in houses and condos:
Here:
5.6
State:
6.4
Median number of rooms in apartments:
Here:
5.1
State:
4.4
Notable locations in this zip code not listed on our city pages
In group quarters: 12 (-1 institutionalized population)
Size of family households: 425 2-persons, 311 3-persons, 265 4-persons, 92 5-persons, 41 7-or-more-persons
Size of nonfamily households: 171 1-person, 24 2-persons, 68 3-persons
312 married couples with children.
652 single-parent households (67 men, 585 women).
76.6% of residents of 28726 zip code speak English at home.
18.4% of residents speak Spanish at home (42% very well, 13% well, 14% not well, 31% not at all).
3.8% of residents speak Asian or Pacific Island language at home (9% very well, 85% well, 5% not well).
Foreign born population: 658 (16.4%) (38.1% of them are naturalized citizens)
This zip code:
16.4%
Whole state:
8.6%
42%Honduras
17%Singapore
16%El Salvador
10%Guatemala
8%Burma (Myanmar)
4%Thailand
2%Belgium
31%Irish
7%English
6%American
3%German
3%Portuguese
2%Scotch-Irish
2%Scottish
Year of entry for the foreign-born population
2582010 or later
2912000 to 2009
601990 to 1999
164Before 1990
Facilities with environmental interests located in this zip code:
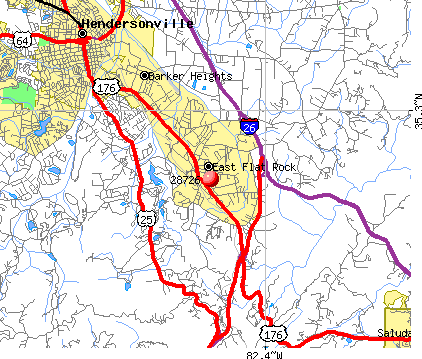
BTG (2040 SPARTANBURG HWY in EAST FLAT ROCK, NC)
AIR MAJOR (AIRS/AFS) STATE MASTER (North Carolina facility info) - AIR PROGRAM Business SIC classification: THREAD MILLS
Housing units lacking complete plumbing facilities: 0.8% Housing units lacking complete kitchen facilities: 0.8%
66.1%Electricity
15.1%Utility gas
14.2%Fuel oil, kerosene, etc.
3.7%Bottled, tank, or LP gas
1.2%Wood
Population in 1990: 3,770.
Place of birth for U.S.-born residents:
This state: 2,409
Northeast: 128
Midwest: 96
South: 553
West: 39
56% of the 28726 zip code residents lived in the same house 5 years ago. Out of people who lived in different houses, 62% lived in this county. Out of people who lived in different counties, 50% lived in North Carolina.
88% of the 28726 zip code residents lived in the same house 1 year ago. Out of people who lived in different houses, 50% moved from this county. Out of people who lived in different houses, 39% moved from different county within same state. Out of people who lived in different houses, 7% moved from different state.
Private vs. public school enrollment:
Students in private schools in grades 1 to 8 (elementary and middle school): 127
Here:
18.2%
North Carolina:
13.8%
Students in private schools in grades 9 to 12 (high school):
Here:
0.0%
North Carolina:
11.9%
Students in private undergraduate colleges:
Here:
0.0%
North Carolina:
19.3%
Occupation by median earnings in the past 12 months ($)
72,154Health diagnosing and treating practitioners and other technical occupations
44,203Health technologists and technicians
44,046Installation, maintenance, and repair occupations
42,704Construction and extraction occupations
35,924Management occupations
33,656Production occupations
Top industries in this zip code by the number of employees in 2005:
Health Care and Social Assistance: Vocational Rehabilitation Services (100-249 employees: 1 establishment)
Other Services (except Public Administration): Religious Organizations (20-49: 1, 1-4: 3)
Construction: Roofing Contractors (20-49: 1)
Construction: Plumbing, Heating, and Air-Conditioning Contractors (20-49: 1)
Health Care and Social Assistance: Child Day Care Services (10-19: 2, 1-4: 1)
Other Services (except Public Administration): Automotive Body, Paint, and Interior Repair and Maintenance (10-19: 1, 1-4: 1)
Home Mortgage Disclosure Act Aggregated Statistics For Year 2009 (Based on 2 partial tracts)
A) FHA, FSA/RHS & VA Home Purchase Loans
B) Conventional Home Purchase Loans
C) Refinancings
D) Home Improvement Loans
F) Non-occupant Loans on < 5 Family Dwellings (A B C & D)
G) Loans On Manufactured Home Dwelling (A B C & D)
Number
Average Value
Number
Average Value
Number
Average Value
Number
Average Value
Number
Average Value
Number
Average Value
LOANS ORIGINATED
8
$142,136
13
$185,877
41
$148,874
3
$87,450
12
$196,707
1
$133,940
APPLICATIONS APPROVED, NOT ACCEPTED
0
$0
0
$0
1
$147,060
0
$0
0
$0
0
$0
APPLICATIONS DENIED
1
$100,110
1
$234,740
19
$176,888
1
$51,780
1
$119,440
1
$81,470
APPLICATIONS WITHDRAWN
0
$0
1
$173,290
12
$114,492
0
$0
1
$58,680
1
$18,640
FILES CLOSED FOR INCOMPLETENESS
0
$0
0
$0
4
$146,538
0
$0
0
$0
0
$0
Aggregated Statistics For Year 2008 (Based on 2 partial tracts)
A) FHA, FSA/RHS & VA Home Purchase Loans
B) Conventional Home Purchase Loans
C) Refinancings
D) Home Improvement Loans
E) Loans on Dwellings For 5+ Families
F) Non-occupant Loans on < 5 Family Dwellings (A B C & D)
G) Loans On Manufactured Home Dwelling (A B C & D)
Number
Average Value
Number
Average Value
Number
Average Value
Number
Average Value
Number
Average Value
Number
Average Value
Number
Average Value
LOANS ORIGINATED
7
$146,660
26
$182,345
41
$179,201
5
$105,770
1
$1,509,900
14
$193,214
2
$61,445
APPLICATIONS APPROVED, NOT ACCEPTED
0
$0
3
$157,180
6
$112,420
1
$6,210
0
$0
1
$99,420
0
$0
APPLICATIONS DENIED
1
$117,370
10
$132,695
27
$156,619
2
$33,830
0
$0
1
$286,520
4
$94,585
APPLICATIONS WITHDRAWN
1
$91,130
4
$190,722
8
$184,250
2
$30,380
0
$0
1
$314,130
0
$0
FILES CLOSED FOR INCOMPLETENESS
0
$0
0
$0
2
$148,090
0
$0
0
$0
0
$0
0
$0
Aggregated Statistics For Year 2007 (Based on 2 partial tracts)
A) FHA, FSA/RHS & VA Home Purchase Loans
B) Conventional Home Purchase Loans
C) Refinancings
D) Home Improvement Loans
F) Non-occupant Loans on < 5 Family Dwellings (A B C & D)
G) Loans On Manufactured Home Dwelling (A B C & D)
Number
Average Value
Number
Average Value
Number
Average Value
Number
Average Value
Number
Average Value
Number
Average Value
LOANS ORIGINATED
1
$212,640
44
$162,244
55
$131,929
6
$77,095
21
$170,890
12
$66,278
APPLICATIONS APPROVED, NOT ACCEPTED
0
$0
3
$133,017
10
$104,665
2
$68,350
3
$96,657
1
$98,040
APPLICATIONS DENIED
0
$0
11
$119,000
35
$111,194
4
$82,848
3
$153,270
6
$64,322
APPLICATIONS WITHDRAWN
1
$95,970
6
$153,960
12
$128,817
0
$0
3
$144,753
1
$60,060
FILES CLOSED FOR INCOMPLETENESS
0
$0
1
$192,620
5
$153,130
0
$0
0
$0
0
$0
Aggregated Statistics For Year 2006 (Based on 2 partial tracts)
A) FHA, FSA/RHS & VA Home Purchase Loans
B) Conventional Home Purchase Loans
C) Refinancings
D) Home Improvement Loans
F) Non-occupant Loans on < 5 Family Dwellings (A B C & D)
G) Loans On Manufactured Home Dwelling (A B C & D)
Number
Average Value
Number
Average Value
Number
Average Value
Number
Average Value
Number
Average Value
Number
Average Value
LOANS ORIGINATED
3
$102,640
46
$127,874
43
$120,451
8
$93,549
17
$151,116
7
$78,509
APPLICATIONS APPROVED, NOT ACCEPTED
0
$0
6
$99,533
3
$101,490
1
$20,710
1
$280,300
4
$76,808
APPLICATIONS DENIED
1
$70,420
14
$92,908
34
$120,292
3
$67,200
1
$73,870
11
$66,969
APPLICATIONS WITHDRAWN
1
$97,350
4
$100,452
11
$114,732
0
$0
0
$0
1
$44,880
FILES CLOSED FOR INCOMPLETENESS
0
$0
1
$48,330
3
$118,290
0
$0
1
$110,460
0
$0
Aggregated Statistics For Year 2005 (Based on 2 partial tracts)
A) FHA, FSA/RHS & VA Home Purchase Loans
B) Conventional Home Purchase Loans
C) Refinancings
D) Home Improvement Loans
E) Loans on Dwellings For 5+ Families
F) Non-occupant Loans on < 5 Family Dwellings (A B C & D)
G) Loans On Manufactured Home Dwelling (A B C & D)
Number
Average Value
Number
Average Value
Number
Average Value
Number
Average Value
Number
Average Value
Number
Average Value
Number
Average Value
LOANS ORIGINATED
0
$0
52
$99,909
56
$114,138
5
$26,236
1
$58,680
11
$142,725
13
$55,922
APPLICATIONS APPROVED, NOT ACCEPTED
0
$0
11
$81,530
6
$90,673
1
$75,250
0
$0
1
$40,730
4
$44,185
APPLICATIONS DENIED
1
$76,630
23
$64,027
21
$96,886
3
$28,537
0
$0
3
$66,510
16
$53,031
APPLICATIONS WITHDRAWN
0
$0
8
$130,485
16
$105,588
0
$0
0
$0
1
$23,470
1
$138,080
FILES CLOSED FOR INCOMPLETENESS
0
$0
7
$77,423
8
$90,960
0
$0
0
$0
1
$18,640
0
$0
Aggregated Statistics For Year 2004 (Based on 2 partial tracts)
A) FHA, FSA/RHS & VA Home Purchase Loans
B) Conventional Home Purchase Loans
C) Refinancings
D) Home Improvement Loans
F) Non-occupant Loans on < 5 Family Dwellings (A B C & D)
G) Loans On Manufactured Home Dwelling (A B C & D)
Detailed PMIC statistics for the following Tracts:9914.00
2004 - 2018 National Fire Incident Reporting System (NFIRS) incidents
Based on the data from the years 2004 - 2018 the average number of fires per year is 40. The highest number of reported fires - 78 took place in 2011, and the least - 5 in 2013. The data has a dropping trend.
When looking into fire subcategories, the most reports belonged to: Structure Fires (50.8%), and Outside Fires (28.2%).
Fire incident types reported to NFIRS in Zip Code 28726


 Nearest zip codes: 28731, 28773, 28792, 28790, 28791, 28739.


 Based on the data from the years 2004 - 2018 the average number of fires per year is 40. The highest number of reported fires - 78 took place in 2011, and the least - 5 in 2013. The data has a dropping trend.
 When looking into fire subcategories, the most reports belonged to: Structure Fires (50.8%), and Outside Fires (28.2%).