Races in Enterprise, Nevada (NV) Detailed Stats
Data:
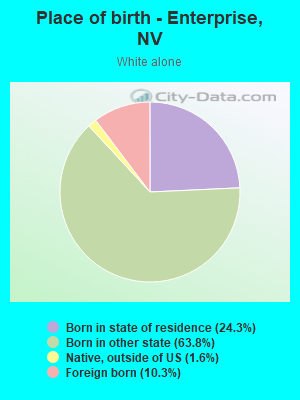
Races - White alone (%)
Races - White alone (% change since 2000)
Races - Black alone (%)
Races - Black alone (% change since 2000)
Races - American Indian alone (%)
Races - American Indian alone (% change since 2000)
Races - Asian alone (%)
Races - Asian alone (% change since 2000)
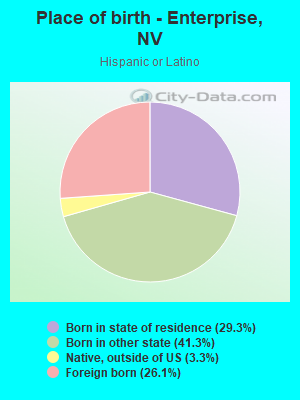
Races - Hispanic (%)
Races - Hispanic (% change since 2000)
Races - Native Hawaiian and Other Pacific Islander alone (%)
Races - Native Hawaiian and Other Pacific Islander alone (% change since 2000)
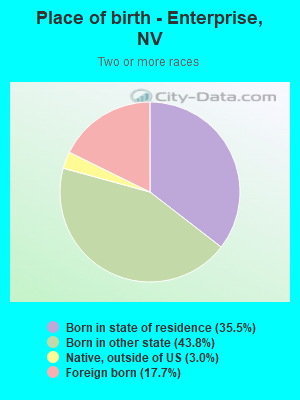
Races - Two or more races(%)
Races - Two or more races(% change since 2000)
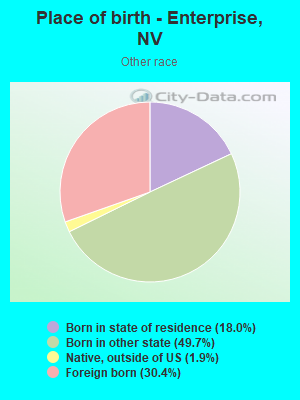
Races - Other race alone (%)
Races - Other race alone (% change since 2000)
Racial diversity
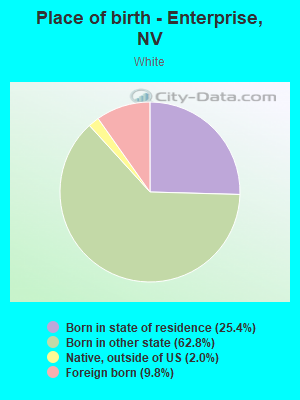
Place of birth - Born in state of residence (%)
Place of birth - Born in state of residence (%) - White
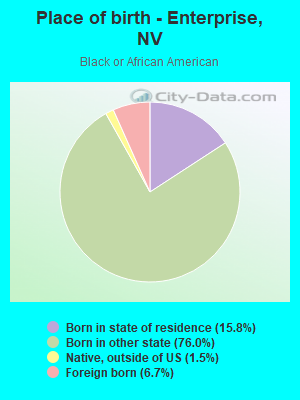
Place of birth - Born in state of residence (%) - Black or African American
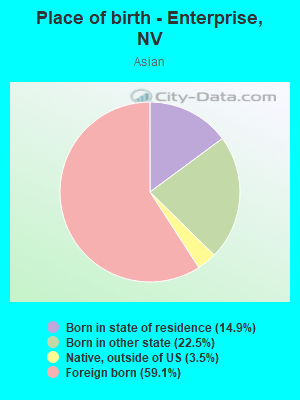
Place of birth - Born in state of residence (%) - Asian
Place of birth - Born in state of residence (%) - Hispanic or Latino
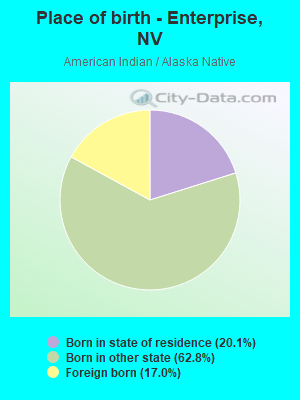
Place of birth - Born in state of residence (%) - American Indian and Alaska Native
Place of birth - Born in state of residence (%) - Multirace
Place of birth - Born in state of residence (%) - Other Race
Place of birth - Born in other state (%)
Place of birth - Born in other state (%) - White
Place of birth - Born in other state (%) - Black or African American
Place of birth - Born in other state (%) - Asian
Place of birth - Born in other state (%) - Hispanic or Latino
Place of birth - Born in other state (%) - American Indian and Alaska Native
Place of birth - Born in other state (%) - Multirace
Place of birth - Born in other state (%) - Other Race
Place of birth - Native, outside of US (%)
Place of birth - Native, outside of US (%) - White
Place of birth - Native, outside of US (%) - Black or African American
Place of birth - Native, outside of US (%) - Asian
Place of birth - Native, outside of US (%) - Hispanic or Latino
Place of birth - Native, outside of US (%) - American Indian and Alaska Native
Place of birth - Native, outside of US (%) - Multirace
Place of birth - Native, outside of US (%) - Other Race
Place of birth - Foreign born (%)
Place of birth - Foreign born (%) - White
Place of birth - Foreign born (%) - Black or African American
Place of birth - Foreign born (%) - Asian
Place of birth - Foreign born (%) - Hispanic or Latino
Place of birth - Foreign born (%) - American Indian and Alaska Native
Place of birth - Foreign born (%) - Multirace
Place of birth - Foreign born (%) - Other Race
Residents speaking English at home (%)
Residents speaking English at home - Born in the United States (%)
Residents speaking English at home - Native, born elsewhere (%)
Residents speaking English at home - Foreign born (%)
Residents speaking Spanish at home (%)
Residents speaking Spanish at home - Born in the United States (%)
Residents speaking Spanish at home - Native, born elsewhere (%)
Residents speaking Spanish at home - Foreign born (%)
Residents speaking other language at home (%)
Residents speaking other language at home - Born in the United States (%)
Residents speaking other language at home - Native, born elsewhere (%)
Residents speaking other language at home - Foreign born (%)
Marital status - Never married (%)
Marital status - Now married (%)
Marital status - Separated (%)
Marital status - Widowed (%)
Marital status - Divorced (%)
Ancestries Reported - Arab (%)
Ancestries Reported - Czech (%)
Ancestries Reported - Danish (%)
Ancestries Reported - Dutch (%)
Ancestries Reported - English (%)
Ancestries Reported - French (%)
Ancestries Reported - French Canadian (%)
Ancestries Reported - German (%)
Ancestries Reported - Greek (%)
Ancestries Reported - Hungarian (%)
Ancestries Reported - Irish (%)
Ancestries Reported - Italian (%)
Ancestries Reported - Lithuanian (%)
Ancestries Reported - Norwegian (%)
Ancestries Reported - Polish (%)
Ancestries Reported - Portuguese (%)
Ancestries Reported - Russian (%)
Ancestries Reported - Scotch-Irish (%)
Ancestries Reported - Scottish (%)
Ancestries Reported - Slovak (%)
Ancestries Reported - Subsaharan African (%)
Ancestries Reported - Swedish (%)
Ancestries Reported - Swiss (%)
Ancestries Reported - Ukrainian (%)
Ancestries Reported - United States (%)
Ancestries Reported - Welsh (%)
Ancestries Reported - West Indian (%)
Ancestries Reported - Other (%)
Geographical mobility - Same house 1 year ago (%)
Geographical mobility - Same house 1 year ago (%) - White
Geographical mobility - Same house 1 year ago (%) - Black or African American
Geographical mobility - Same house 1 year ago (%) - Asian
Geographical mobility - Same house 1 year ago (%) - Hispanic or Latino
Geographical mobility - Same house 1 year ago (%) - American Indian and Alaska Native
Geographical mobility - Same house 1 year ago (%) - Multirace
Geographical mobility - Same house 1 year ago (%) - Other Race
Geographical mobility - Moved within same county (%)
Geographical mobility - Moved within same county (%) - White
Geographical mobility - Moved within same county (%) - Black or African American
Geographical mobility - Moved within same county (%) - Asian
Geographical mobility - Moved within same county (%) - Hispanic or Latino
Geographical mobility - Moved within same county (%) - American Indian and Alaska Native
Geographical mobility - Moved within same county (%) - Multirace
Geographical mobility - Moved within same county (%) - Other Race
Geographical mobility - Moved from different county within same state (%)
Geographical mobility - Moved from different county within same state (%) - White
Geographical mobility - Moved from different county within same state (%) - Black or African American
Geographical mobility - Moved from different county within same state (%) - Asian
Geographical mobility - Moved from different county within same state (%) - Hispanic or Latino
Geographical mobility - Moved from different county within same state (%) - American Indian and Alaska Native
Geographical mobility - Moved from different county within same state (%) - Multirace
Geographical mobility - Moved from different county within same state (%) - Other Race
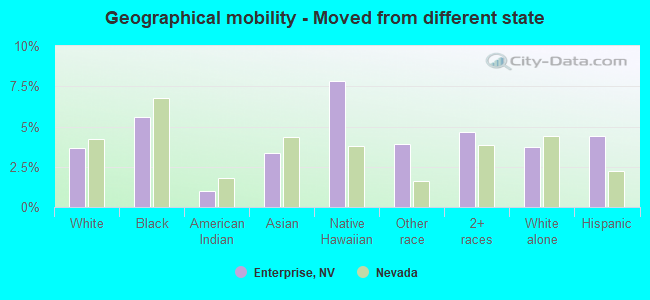
Geographical mobility - Moved from different state (%)
Geographical mobility - Moved from different state (%) - White
Geographical mobility - Moved from different state (%) - Black or African American
Geographical mobility - Moved from different state (%) - Asian
Geographical mobility - Moved from different state (%) - Hispanic or Latino
Geographical mobility - Moved from different state (%) - American Indian and Alaska Native
Geographical mobility - Moved from different state (%) - Multirace
Geographical mobility - Moved from different state (%) - Other Race
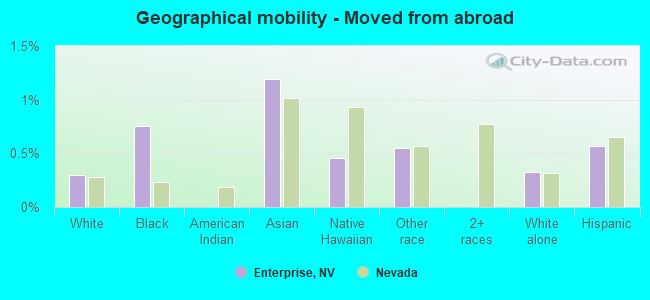
Geographical mobility - Moved from abroad (%)
Geographical mobility - Moved from abroad (%) - White
Geographical mobility - Moved from abroad (%) - Black or African American
Geographical mobility - Moved from abroad (%) - Asian
Geographical mobility - Moved from abroad (%) - Hispanic or Latino
Geographical mobility - Moved from abroad (%) - American Indian and Alaska Native
Geographical mobility - Moved from abroad (%) - Multirace
Geographical mobility - Moved from abroad (%) - Other Race
Place of birth for the foreign-born population - Ireland (%)
Place of birth for the foreign-born population - Denmark (%)
Place of birth for the foreign-born population - Norway (%)
Place of birth for the foreign-born population - Sweden (%)
Place of birth for the foreign-born population - United Kingdom (%)
Place of birth for the foreign-born population - England (%)
Place of birth for the foreign-born population - Scotland (%)
Place of birth for the foreign-born population - Other Northern Europe (%)
Place of birth for the foreign-born population - Austria (%)
Place of birth for the foreign-born population - Belgium (%)
Place of birth for the foreign-born population - France (%)
Place of birth for the foreign-born population - Germany (%)
Place of birth for the foreign-born population - Netherlands (%)
Place of birth for the foreign-born population - Switzerland (%)
Place of birth for the foreign-born population - Other Western Europe (%)
Place of birth for the foreign-born population - Greece (%)
Place of birth for the foreign-born population - Italy (%)
Place of birth for the foreign-born population - Portugal (%)
Place of birth for the foreign-born population - Spain (%)
Place of birth for the foreign-born population - Other Southern Europe (%)
Place of birth for the foreign-born population - Albania (%)
Place of birth for the foreign-born population - Belarus (%)
Place of birth for the foreign-born population - Bosnia and Herzegovina (%)
Place of birth for the foreign-born population - Bulgaria (%)
Place of birth for the foreign-born population - Croatia (%)
Place of birth for the foreign-born population - Czechoslovakia (%)
Place of birth for the foreign-born population - Hungary (%)
Place of birth for the foreign-born population - Latvia (%)
Place of birth for the foreign-born population - Lithuania (%)
Place of birth for the foreign-born population - North Macedonia (Macedonia) (%)
Place of birth for the foreign-born population - Moldova (%)
Place of birth for the foreign-born population - Poland (%)
Place of birth for the foreign-born population - Romania (%)
Place of birth for the foreign-born population - Russia (%)
Place of birth for the foreign-born population - Serbia (%)
Place of birth for the foreign-born population - Ukraine (%)
Place of birth for the foreign-born population - Other Eastern Europe (%)
Place of birth for the foreign-born population - China (%)
Place of birth for the foreign-born population - Hong Kong (%)
Place of birth for the foreign-born population - Taiwan (%)
Place of birth for the foreign-born population - Japan (%)
Place of birth for the foreign-born population - Korea (%)
Place of birth for the foreign-born population - Other Eastern Asia (%)
Place of birth for the foreign-born population - Afghanistan (%)
Place of birth for the foreign-born population - Bangladesh (%)
Place of birth for the foreign-born population - India (%)
Place of birth for the foreign-born population - Iran (%)
Place of birth for the foreign-born population - Kazakhstan (%)
Place of birth for the foreign-born population - Nepal (%)
Place of birth for the foreign-born population - Pakistan (%)
Place of birth for the foreign-born population - Sri Lanka (%)
Place of birth for the foreign-born population - Uzbekistan (%)
Place of birth for the foreign-born population - Other South Central Asia (%)
Place of birth for the foreign-born population - Burma (%)
Place of birth for the foreign-born population - Cambodia (%)
Place of birth for the foreign-born population - Indonesia (%)
Place of birth for the foreign-born population - Laos (%)
Place of birth for the foreign-born population - Malaysia (%)
Place of birth for the foreign-born population - Philippines (%)
Place of birth for the foreign-born population - Singapore (%)
Place of birth for the foreign-born population - Thailand (%)
Place of birth for the foreign-born population - Vietnam (%)
Place of birth for the foreign-born population - Other South Eastern Asia (%)
Place of birth for the foreign-born population - Armenia (%)
Place of birth for the foreign-born population - Iraq (%)
Place of birth for the foreign-born population - Israel (%)
Place of birth for the foreign-born population - Jordan (%)
Place of birth for the foreign-born population - Kuwait (%)
Place of birth for the foreign-born population - Lebanon (%)
Place of birth for the foreign-born population - Saudi Arabia (%)
Place of birth for the foreign-born population - Syria (%)
Place of birth for the foreign-born population - Turkey (%)
Place of birth for the foreign-born population - Yemen (%)
Place of birth for the foreign-born population - Other Western Asia (%)
Place of birth for the foreign-born population - Eritrea (%)
Place of birth for the foreign-born population - Ethiopia (%)
Place of birth for the foreign-born population - Kenya (%)
Place of birth for the foreign-born population - Somalia (%)
Place of birth for the foreign-born population - Uganda (%)
Place of birth for the foreign-born population - Zimbabwe (%)
Place of birth for the foreign-born population - Other Eastern Africa (%)
Place of birth for the foreign-born population - Cameroon (%)
Place of birth for the foreign-born population - Congo (%)
Place of birth for the foreign-born population - Democratic Republic of Congo (Zaire) (%)
Place of birth for the foreign-born population - Other Middle Africa (%)
Place of birth for the foreign-born population - Egypt (%)
Place of birth for the foreign-born population - Morocco (%)
Place of birth for the foreign-born population - Sudan (%)
Place of birth for the foreign-born population - Other Northern Africa (%)
Place of birth for the foreign-born population - South Africa (%)
Place of birth for the foreign-born population - Other Southern Africa (%)
Place of birth for the foreign-born population - Cabo Verde (%)
Place of birth for the foreign-born population - Ghana (%)
Place of birth for the foreign-born population - Liberia (%)
Place of birth for the foreign-born population - Nigeria (%)
Place of birth for the foreign-born population - Senegal (%)
Place of birth for the foreign-born population - Sierra Leone (%)
Place of birth for the foreign-born population - Other Western Africa (%)
Place of birth for the foreign-born population - Australia (%)
Place of birth for the foreign-born population - New Zealand (%)
Place of birth for the foreign-born population - Fiji (%)
Place of birth for the foreign-born population - Micronesia (%)
Place of birth for the foreign-born population - Bahamas (%)
Place of birth for the foreign-born population - Barbados (%)
Place of birth for the foreign-born population - Cuba (%)
Place of birth for the foreign-born population - Dominica (%)
Place of birth for the foreign-born population - Dominican Republic (%)
Place of birth for the foreign-born population - Grenada (%)
Place of birth for the foreign-born population - Haiti (%)
Place of birth for the foreign-born population - Jamaica (%)
Place of birth for the foreign-born population - St. Vincent and the Grenadines (%)
Place of birth for the foreign-born population - Trinidad and Tobago (%)
Place of birth for the foreign-born population - West Indies (%)
Place of birth for the foreign-born population - Other Caribbean (%)
Place of birth for the foreign-born population - Belize (%)
Place of birth for the foreign-born population - Costa Rica (%)
Place of birth for the foreign-born population - El Salvador (%)
Place of birth for the foreign-born population - Guatemala (%)
Place of birth for the foreign-born population - Honduras (%)
Place of birth for the foreign-born population - Mexico (%)
Place of birth for the foreign-born population - Nicaragua (%)
Place of birth for the foreign-born population - Panama (%)
Place of birth for the foreign-born population - Other Central America (%)
Place of birth for the foreign-born population - Argentina (%)
Place of birth for the foreign-born population - Bolivia (%)
Place of birth for the foreign-born population - Brazil (%)
Place of birth for the foreign-born population - Chile (%)
Place of birth for the foreign-born population - Colombia (%)
Place of birth for the foreign-born population - Ecuador (%)
Place of birth for the foreign-born population - Guyana (%)
Place of birth for the foreign-born population - Peru (%)
Place of birth for the foreign-born population - Uruguay (%)
Place of birth for the foreign-born population - Venezuela (%)
Place of birth for the foreign-born population - Other South America (%)
Place of birth for the foreign-born population - Canada (%)
Place of birth for the foreign-born population - Other Northern America (%)
Place of birth for the foreign-born population - Other (%)
Latest news about races in Enterprise, NV collected exclusively by city-data.com from local newspapers, TV, and radio stations
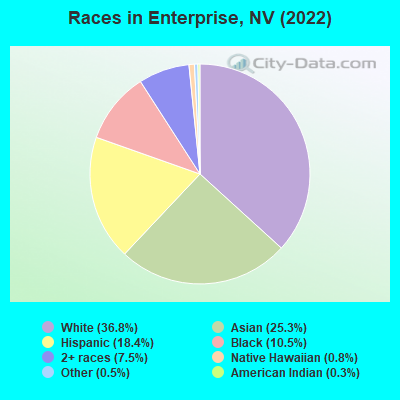
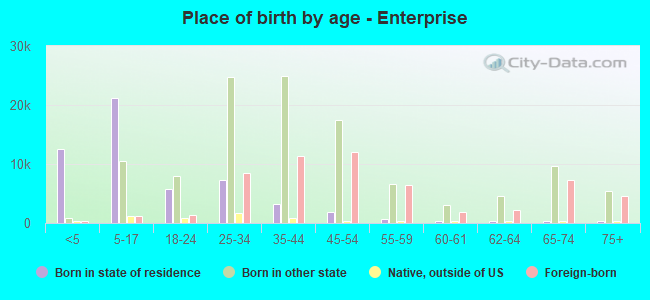
According to 2022 data, the most numerous races in Enterprise, NV are White alone (85,081 residents), Hispanic (42,660 residents), and Black alone (24,393 residents). 67.1% of Enterprise residents speak English at home. 23.6% of Enterprise, NV residents are foreign-born (14.4% born in Asia, 5.2% born in Latin America), which is 23.8% greater than the foreign-born rate of 18.0% across the entire state of Nevada.
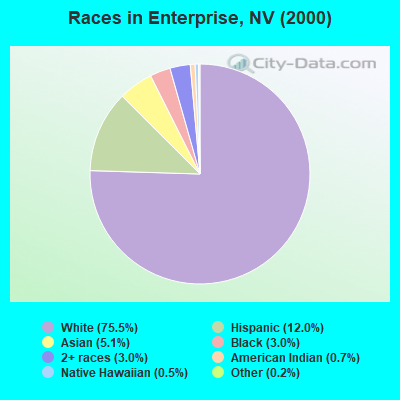
Race distribution in Enterprise
2000 2022
1,303,001 65.2% White alone 393,970 19.7% Hispanic 131,509 6.6% Black alone 88,593 4.4% Asian alone 49,231 2.5% Two or more races 21,397 1.1% American Indian alone 7,769 0.4% Native Hawaiian and Other 2,787 0.1% Other race alone
1,410,145 44.4% White alone 961,357 30.3% Hispanic 286,471 9.0% Black alone 281,149 8.8% Asian alone 182,151 5.7% Two or more races 20,102 0.6% Native Hawaiian and Other 18,781 0.6% Other race alone 17,616 0.6% American Indian alone
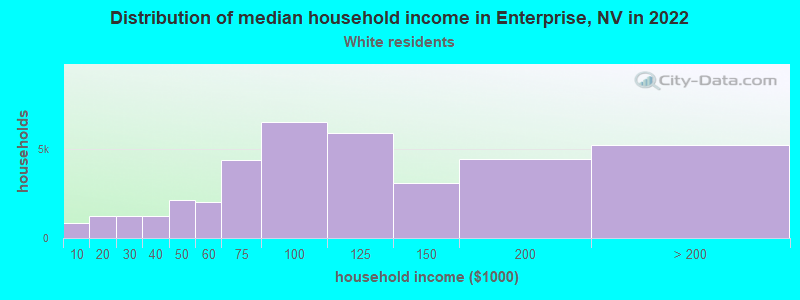
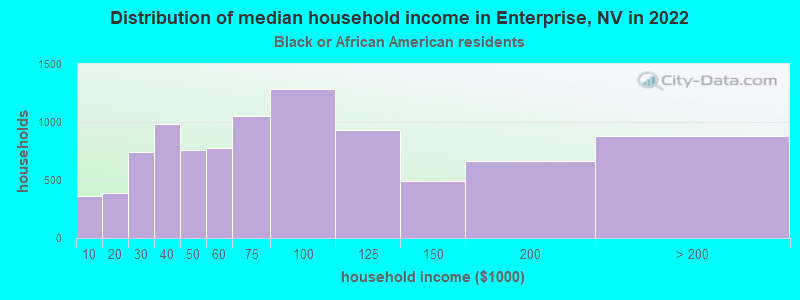
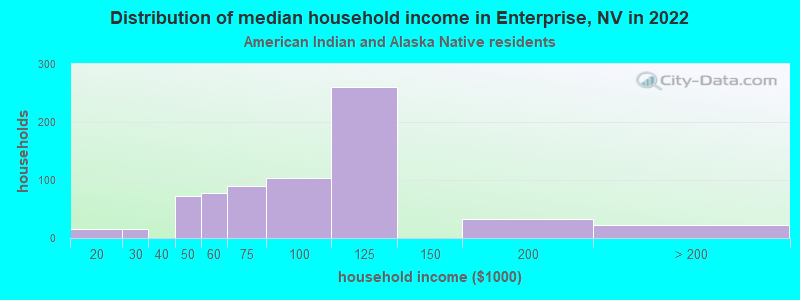
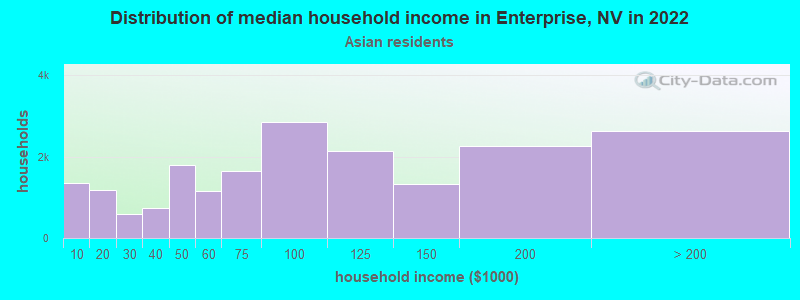
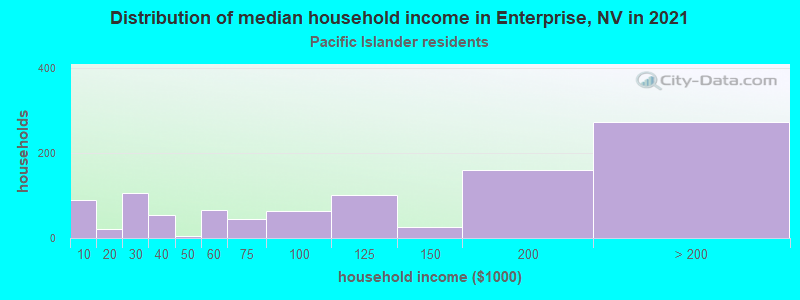
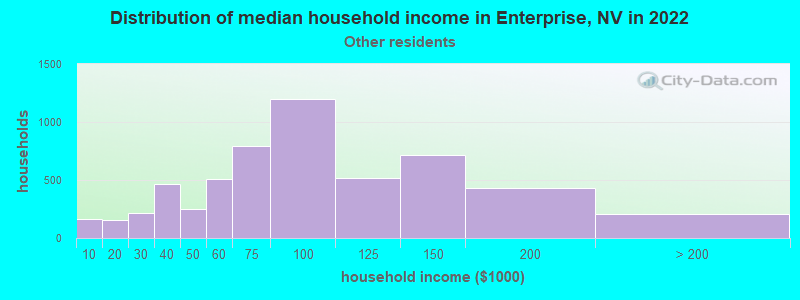
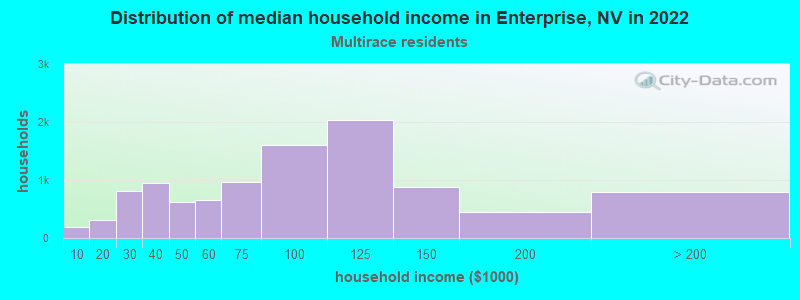
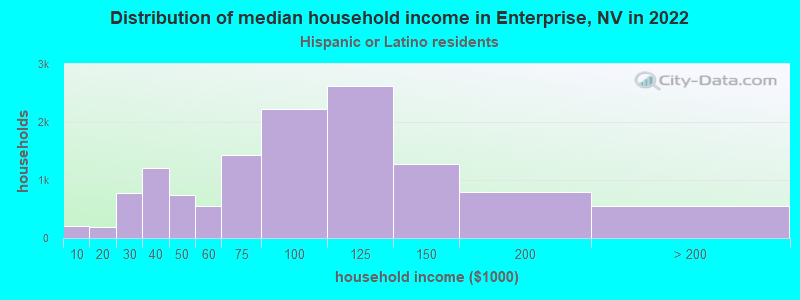
Income and house value in Enterprise Median household income in 2022 $94,544 White non-Hispanic householders$62,811 Black householders$90,221 American Indian and Alaska Native householders$90,641 Asian householders$125,077 Native Hawaiian and other Pacific Islander householders$62,159 Some other race householders$89,280 Two or more races householders$91,178 Hispanic or Latino race householdersMedian 2022 house value $589,797 White Non-Hispanic householders$384,128 Black or African American householders$430,277 American Indian or Alaska Native householders $313,705 Asian householders$439,880 Some other race householders$583,662 Two or more races householders$440,947 Hispanic or Latino householders
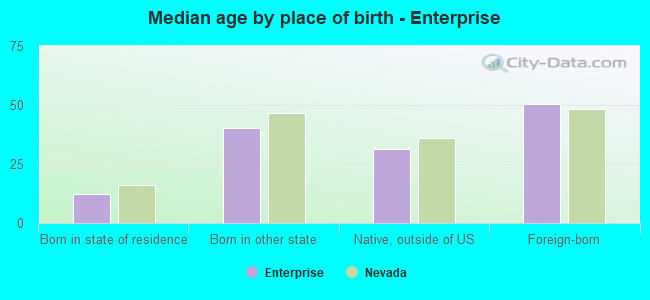
Median age by race in Enterprise
39.6 Median age for White residents40.8 38.4 38.9 Median age for Black or African American residents38.3 39.0 45.0 Median age for American Indian / Alaska Native residents30.5 55.4 40.3 Median age for Asian residents39.0 41.5 35.4 Median age for Native Hawaiian / Pacific Islander residents35.2 39.6 32.9 Median age for Other race residents36.7 31.4 23.2 Median age for Two or more races residents25.5 22.5 41.3 Median age for White alone residents42.5 39.3 30.5 Median age for Hispanic or Latino residents31.0 30.0
Owner/renter occupied households by race in Enterprise
House owners and renters - White residents 25,121 65.9% Owner occupied13,026 34.1% Renter occupiedHouse owners and renters - Black or African American residents 4,399 44.3% Owner occupied5,536 55.7% Renter occupiedHouse owners and renters - American Indian / Alaska Native residents 408 57.9% Owner occupied297 42.1% Renter occupiedHouse owners and renters - Asian residents 15,647 79.7% Owner occupied3,989 20.3% Renter occupiedHouse owners and renters - Native Hawaiian / Pacific Islander residents 507 56.3% Owner occupied393 43.7% Renter occupiedHouse owners and renters - Other race residents 1,546 38.4% Owner occupied2,478 61.6% Renter occupiedHouse owners and renters - Two or more races residents 4,781 46.5% Owner occupied5,507 53.5% Renter occupiedHouse owners and renters - White alone residents 23,559 66.2% Owner occupied12,054 33.8% Renter occupiedHouse owners and renters - Hispanic or Latino residents 5,350 42.5% Owner occupied7,236 57.5% Renter occupied
Language usage in Enterprise
English speakers - Total 67.1% of residents of Enterprise speak English at home.
10.3% of residents speak Spanish at home 15,422 68.6% Speak English very well7,061 31.4% Speak English less than very well22.6% of residents speak other language at home 28,207 57.5% Speak English very well20,881 42.5% Speak English less than very well
English speakers - Born in the United States 89.2% of residents of Enterprise speak English at home.
6.3% of residents speak Spanish at home 6,066 84.4% Speak English very well1,118 15.6% Speak English less than very well4.5% of residents speak other language at home 4,139 80.2% Speak English very well1,023 19.8% Speak English less than very well
English speakers - Native, born elsewhere 64.6% of residents of Enterprise speak English at home.
14.9% of residents speak Spanish at home 467 56.5% Speak English very well359 43.5% Speak English less than very well20.5% of residents speak other language at home 569 50.0% Speak English very well570 50.0% Speak English less than very well
English speakers - Foreign-born 12.0% of residents of Enterprise speak English at home.
18.8% of residents speak Spanish at home 5,725 53.5% Speak English very well4,975 46.5% Speak English less than very well69.2% of residents speak other language at home 20,905 53.1% Speak English very well18,487 46.9% Speak English less than very well
White (Caucasian) - Speak only English Native:
92.4% (72,995)Foreign-born:
21.2% (1,917)
White (Caucasian) - Speak another language Native:
7.6% (6,001)Foreign-born:
78.8% (7,125)
Black or African American - Speak only English Native:
95.1% (19,322)Foreign-born:
12.1% (392)
Black or African American - Speak another language Native:
4.6% (936)Foreign-born:
88.8% (2,871)
American Indian / Alaska Native - Speak another language Native:
23.5% (423)Foreign-born:
100.0% (410)
Asian - Speak only English Native:
76.8% (16,772)Foreign-born:
10.7% (3,768)
Asian - Speak another language Native:
23.2% (5,054)Foreign-born:
89.3% (31,396)
Native Hawaiian / Pacific Islander - Speak only English Native:
70.9% (1,415)Foreign-born:
85.4% (174)
Native Hawaiian / Pacific Islander - Speak another language Native:
29.5% (588)Foreign-born:
39.2% (80)
Other race - Speak only English Native:
51.5% (3,964)Foreign-born:
2.7% (96)
Other race - Speak another language Native:
48.5% (3,730)Foreign-born:
97.3% (3,426)
Two or more races - Speak only English Native:
77.0% (20,409)Foreign-born:
7.5% (504)
Two or more races - Speak another language Native:
23.0% (6,097)Foreign-born:
92.5% (6,213)
White alone - Speak only English Native:
93.7% (68,773)Foreign-born:
21.9% (1,917)
White alone - Speak another language Native:
6.3% (4,597)Foreign-born:
78.1% (6,855)
Hispanic or Latino - Speak only English Native:
62.2% (17,084)Foreign-born:
3.6% (392)
Hispanic or Latino - Speak another language Native:
37.8% (10,382)Foreign-born:
96.4% (10,618)
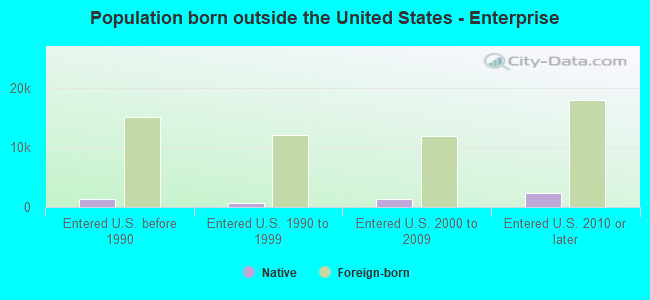
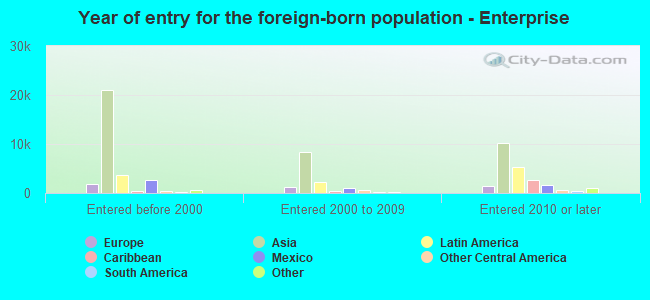
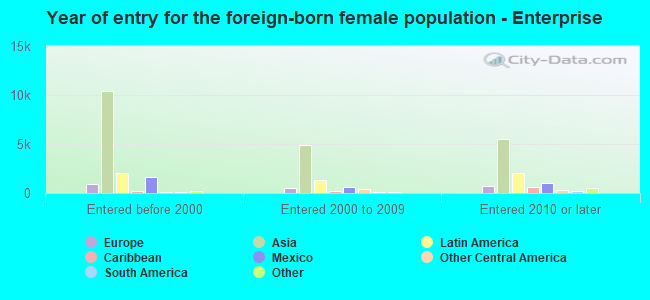
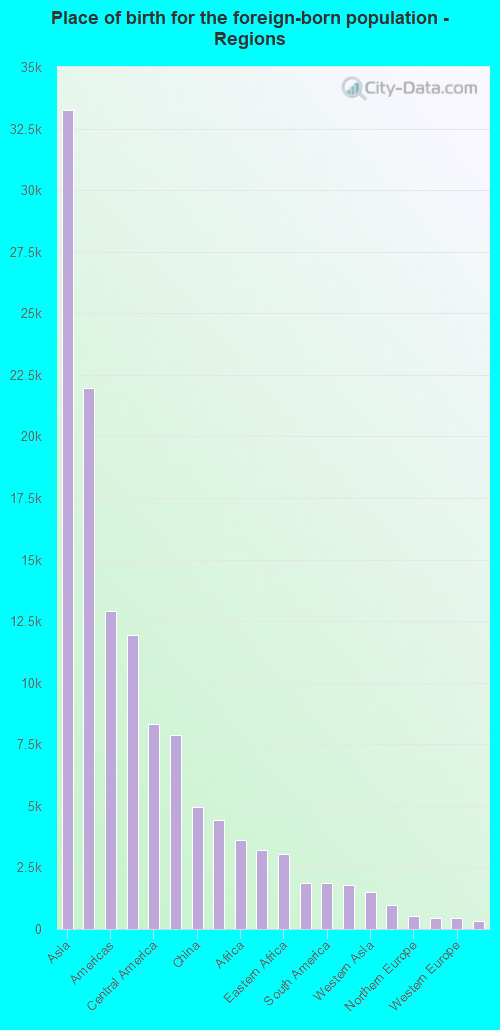
Foreign-born residents in Enterprise 54,625 residents are foreign born (14.4% Asia , 5.2% Latin America ).
This city:
23.6%Nevada:
19.1%
Marital status for residents in Enterprise Marital status - White (Caucasian) population 15 years and over
Males 34.5% Never married52.5% Now married0.4% Separated2.3% Widowed10.4% DivorcedFemales 26.0% Never married53.7% Now married1.0% Separated6.5% Widowed12.9% DivorcedWomen who gave birth in the past 12 months Now married:
100.0% (991)Unmarried:
0.0% (0)
Women who did not give birth in the past 12 months Now married:
51.2% (11,668)Unmarried:
48.8% (11,099)
Marital status - Black or African American population 15 years and over
Males 50.6% Never married33.5% Now married0.6% Separated3.1% Widowed12.1% DivorcedFemales 35.0% Never married33.6% Now married6.0% Separated4.2% Widowed21.3% DivorcedWomen who gave birth in the past 12 months Now married:
100.0% (571)Unmarried:
0.0% (0)
Women who did not give birth in the past 12 months Now married:
26.6% (1,593)Unmarried:
73.4% (4,396)
Marital status - American Indian / Alaska Native population 15 years and over
Males 41.0% Never married50.6% Now married0.0% Separated0.0% Widowed8.3% DivorcedFemales 40.4% Never married54.2% Now married0.0% Separated3.0% Widowed2.5% DivorcedWomen who gave birth in the past 12 months Now married:
0.0% (0)Unmarried:
100.0% (55)
Women who did not give birth in the past 12 months Now married:
51.5% (427)Unmarried:
48.5% (402)
Marital status - Asian population 15 years and over
Males 34.8% Never married57.0% Now married1.5% Separated1.3% Widowed5.4% DivorcedFemales 26.5% Never married55.9% Now married1.5% Separated4.4% Widowed11.8% DivorcedWomen who gave birth in the past 12 months Now married:
87.6% (812)Unmarried:
12.4% (115)
Women who did not give birth in the past 12 months Now married:
49.0% (7,871)Unmarried:
51.0% (8,205)
Marital status - Native Hawaiian / Pacific Islander population 15 years and over
Males 35.2% Never married59.1% Now married0.0% Separated0.0% Widowed5.7% DivorcedFemales 41.8% Never married49.4% Now married4.0% Separated2.4% Widowed2.4% DivorcedWomen who gave birth in the past 12 months Now married:
65.6% (23)Unmarried:
34.4% (12)
Women who did not give birth in the past 12 months Now married:
45.3% (347)Unmarried:
54.7% (420)
Marital status - Other race population 15 years and over
Males 35.1% Never married53.6% Now married0.0% Separated0.0% Widowed11.3% DivorcedFemales 27.8% Never married61.9% Now married0.0% Separated0.9% Widowed9.3% DivorcedWomen who gave birth in the past 12 months Now married:
100.0% (263)Unmarried:
0.0% (0)
Women who did not give birth in the past 12 months Now married:
57.0% (1,918)Unmarried:
43.0% (1,449)
Marital status - Two or more races population 15 years and over
Males 43.8% Never married43.9% Now married1.7% Separated0.0% Widowed10.6% DivorcedFemales 42.2% Never married37.1% Now married2.0% Separated2.2% Widowed16.5% DivorcedWomen who gave birth in the past 12 months Now married:
75.8% (476)Unmarried:
24.2% (152)
Women who did not give birth in the past 12 months Now married:
32.4% (2,837)Unmarried:
67.6% (5,921)
Marital status - White alone, not Hispanic / Latino population 15 years and over
Males 33.6% Never married52.9% Now married0.4% Separated2.4% Widowed10.6% DivorcedFemales 25.7% Never married53.6% Now married1.0% Separated6.4% Widowed13.2% DivorcedWomen who gave birth in the past 12 months Now married:
100.0% (899)Unmarried:
0.0% (0)
Women who did not give birth in the past 12 months Now married:
50.6% (10,503)Unmarried:
49.4% (10,270)
Marital status - Hispanic or Latino population 15 years and over
Males 45.8% Never married44.1% Now married0.9% Separated0.0% Widowed9.1% DivorcedFemales 35.5% Never married45.9% Now married0.0% Separated3.8% Widowed14.8% DivorcedWomen who gave birth in the past 12 months Now married:
77.6% (399)Unmarried:
22.4% (115)
Women who did not give birth in the past 12 months Now married:
40.9% (4,630)Unmarried:
59.1% (6,687)
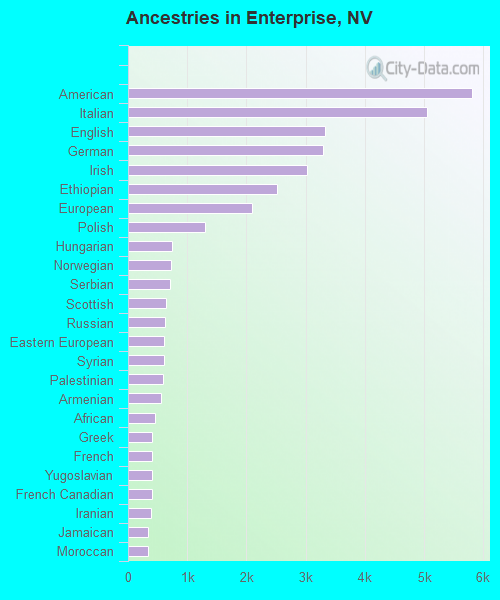
Ancestries in Enterprise
5,803 4.5% American5,047 4.0% Italian3,320 2.6% English3,290 2.6% German3,015 2.4% Irish2,507 2.0% Ethiopian2,088 1.6% European1,308 1.0% Polish741 0.6% Hungarian728 0.6% Norwegian708 0.6% Serbian633 0.5% Scottish623 0.5% Russian608 0.5% Eastern European608 0.5% Syrian596 0.5% Palestinian563 0.4% Armenian448 0.4% African411 0.3% Greek408 0.3% French405 0.3% Yugoslavian402 0.3% French Canadian383 0.3% Iranian335 0.3% Jamaican334 0.3% Moroccan331 0.3% Ukrainian275 0.2% Portuguese261 0.2% Scotch-Irish244 0.2% Danish234 0.2% Turkish215 0.2% Swedish210 0.2% Lebanese209 0.2% West Indian198 0.2% Dutch188 0.1% Nigerian175 0.1% British174 0.1% Romanian170 0.1% Canadian151 0.1% Brazilian133 0.1% Scandinavian128 0.1% Latvian121 0.09% Czech115 0.09% Trinidadian and Tobagonian102 0.08% Haitian97 0.08% Lithuanian94 0.07% Northern European94 0.07% Swiss87 0.07% Australian86 0.07% Croatian86 0.07% Bulgarian80 0.06% Austrian78 0.06% Afghan68 0.05% Slovene65 0.05% Egyptian56 0.04% Slavic56 0.04% Welsh50 0.04% Basque44 0.03% Arab35 0.03% South African31 0.02% Kenyan29 0.02% Icelander27 0.02% Iraqi26 0.02% Barbadian22 0.02% Finnish21 0.02% Guyanese18 0.01% Ghanaian15 0.01% Maltese15 0.01% Czechoslovakian11 0.01% Sierra Leonean11 0.01% Assyrian10 0.01% Belizean9 0.01% German Russian7 0.01% Albanian7 0.01% Celtic
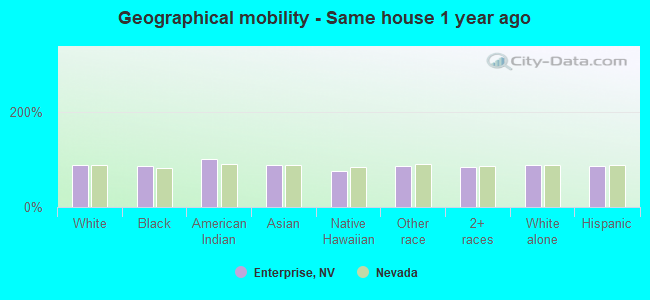
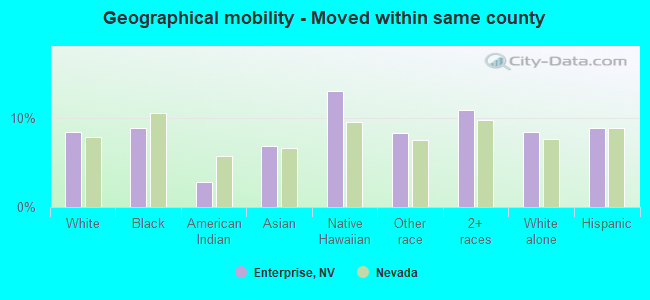
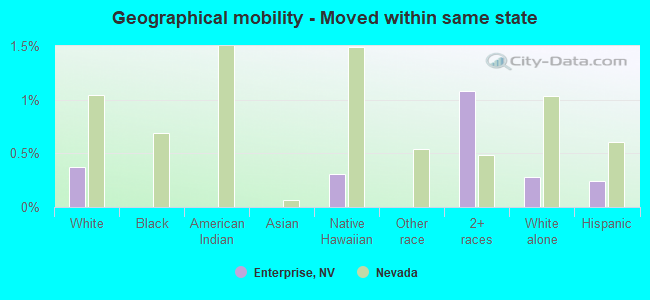
Geographical mobility in Enterprise Same house 1 year ago 79,904 87.3% White (Caucasian)21,596 84.8% Black or African American2,423 100.0% American Indian / Alaska Native52,399 88.6% Asian1,718 74.7% Native Hawaiian / Pacific Islander14,804 86.0% Other race31,064 83.4% Two or more races73,776 87.2% White alone, not Hispanic / Latino35,796 85.9% Hispanic or LatinoMoved within same county 7,687 8.4% White / Caucasian2,244 8.8% Black or African American68 2.8% American Indian / Alaska Native4,037 6.8% Asian297 12.9% Native Hawaiian / Pacific Islander1,426 8.3% Other race4,049 10.9% Two or more races7,138 8.4% White alone, not Hispanic / Latino3,678 8.8% Hispanic or LatinoMoved within same state 341 0.4% White / Caucasian7 0.3% Native Hawaiian / Pacific Islander403 1.1% Two or more races240 0.3% White alone, not Hispanic / Latino101 0.2% Hispanic or LatinoMoved from different state 3,363 3.7% White / Caucasian1,431 5.6% Black or African American23 1.0% American Indian / Alaska Native1,997 3.4% Asian180 7.8% Native Hawaiian / Pacific Islander676 3.9% Other race1,743 4.7% Two or more races3,141 3.7% White alone, not Hispanic / Latino1,839 4.4% Hispanic or LatinoMoved from abroad 274 0.3% White193 0.8% Black or African American706 1.2% Asian10 0.5% Native Hawaiian / Pacific Islander94 0.5% Other race274 0.3% White alone, not Hispanic / Latino237 0.6% Hispanic or Latino
Children Nativity (place of birth) in Enterprise
Children under 6 years - Living with two parents Both parents native 6,457 100.0% NativeBoth parents foreign-born 2,650 93.5% Native183 6.5% Foreign-bornOne native, one foreign-born parent 2,194 100.0% NativeChildren under 6 years - Living with one parent Native parent 4,322 100.0% NativeForeign-born parent 469 100.0% NativeChildren 6 to 17 years - Living with two parents Both parents native 11,382 100.0% NativeBoth parents foreign-born 5,654 94.0% Native359 6.0% Foreign-bornOne native, one foreign-born parent 3,328 96.5% Native119 3.5% Foreign-bornChildren 6 to 17 years - Living with one parent Native parent 6,112 100.0% NativeForeign-born parent 2,490 55.0% Native2,037 45.0% Foreign-born
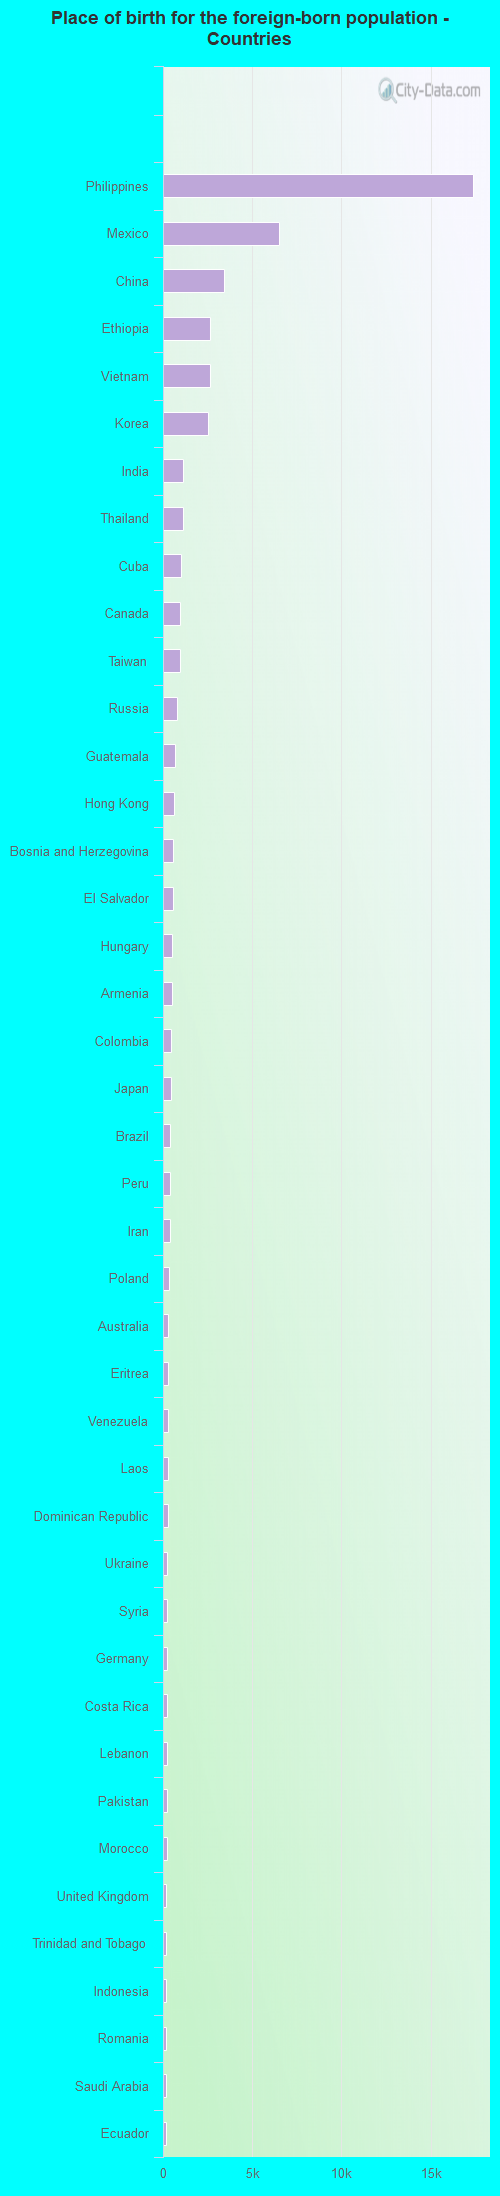
Place of birth for residents in Enterprise 33,244 Asia21,948 South Eastern Asia12,919 Americas11,941 Latin America8,317 Central America7,893 Eastern Asia4,941 China4,416 Europe3,601 Africa3,221 Eastern Europe3,030 Eastern Africa1,871 South Central Asia1,854 South America1,769 Caribbean1,503 Western Asia978 Northern America511 Northern Europe443 Oceania441 Western Europe327 Australia and New Zealand Subregion268 Northern Africa242 Southern Europe201 Western Africa48 Southern Africa34 Middle Africa17,409 Philippines6,506 Mexico3,396 China2,643 Ethiopia2,624 Vietnam2,529 Korea1,132 India1,125 Thailand993 Cuba978 Canada952 Taiwan772 Russia687 Guatemala592 Hong Kong582 Bosnia and Herzegovina550 El Salvador492 Hungary484 Armenia426 Colombia422 Japan383 Brazil381 Peru372 Iran338 Poland298 Australia287 Eritrea284 Venezuela260 Laos253 Dominican Republic241 Ukraine235 Syria225 Germany222 Costa Rica218 Lebanon209 Pakistan201 Morocco189 United Kingdom179 Trinidad and Tobago175 Indonesia174 Romania160 Saudi Arabia159 Ecuador156 Italy154 England154 Cambodia153 Nicaragua144 Jamaica140 Israel132 Turkey126 Chile124 Nigeria123 Bulgaria112 Panama109 Haiti102 Lithuania102 France88 Croatia77 Burma (Myanmar)72 Honduras70 Latvia67 Egypt66 Denmark66 Ghana61 Malaysia59 Singapore55 Serbia53 Portugal49 Switzerland48 South Africa47 Bangladesh45 Uruguay45 Bahamas45 Tanzania44 Austria42 Scotland42 Micronesia41 Kenya39 Kazakhstan33 Norway28 Iraq28 New Zealand28 United Arab Emirates25 Afghanistan25 Argentina24 Sweden24 Spain23 West Indies23 Moldova21 Guyana19 Uzbekistan19 Netherlands18 Democratic Republic of Congo (Zaire)16 Congo15 Fiji13 Georgia12 Uganda11 Belize10 Czechoslovakia10 Sri Lanka10 Sierra Leone8 Barbados7 Albania5 Belarus
Grandparents responsible for own grandchildren in Enterprise
Grandparents (30 to 59 years) White / Caucasian 250 33.7% Responsible for grandchildren492 66.3% Not responsible for grandchildrenBlack or African American 230 82.6% Responsible for grandchildren48 17.4% Not responsible for grandchildrenAmerican Indian / Alaska Native 41 47.6% Responsible for grandchildren46 52.4% Not responsible for grandchildrenAsian 99 26.3% Responsible for grandchildren277 73.7% Not responsible for grandchildrenNative Hawaiian / Pacific Islander 7 100.0% Not responsible for grandchildrenOther race 166 74.7% Responsible for grandchildren56 25.3% Not responsible for grandchildrenTwo or more races 1 0.5% Responsible for grandchildren304 99.5% Not responsible for grandchildrenWhite alone, not Hispanic / Latino 382 47.8% Responsible for grandchildren417 52.2% Not responsible for grandchildrenHispanic or Latino 135 26.4% Responsible for grandchildren377 73.6% Not responsible for grandchildrenGrandparents (60 years and over) White / Caucasian 154 15.8% Responsible for grandchildren822 84.2% Not responsible for grandchildrenBlack or African American 171 45.0% Responsible for grandchildren208 55.0% Not responsible for grandchildrenAmerican Indian / Alaska Native 59 100.0% Not responsible for grandchildrenAsian 290 14.6% Responsible for grandchildren1,700 85.4% Not responsible for grandchildrenNative Hawaiian / Pacific Islander 49 35.1% Responsible for grandchildren91 64.9% Not responsible for grandchildrenOther race 34 8.3% Responsible for grandchildren379 91.7% Not responsible for grandchildrenTwo or more races 58 10.5% Responsible for grandchildren497 89.5% Not responsible for grandchildrenWhite alone, not Hispanic / Latino 186 17.6% Responsible for grandchildren870 82.4% Not responsible for grandchildrenHispanic or Latino 51 6.3% Responsible for grandchildren764 93.7% Not responsible for grandchildren
Zip codes: 89044 , 89052 , 89054 , 89113 , 89118 , 89119 , 89123 , 89139 , 89141 , 89148 , 89161 , 89178 , 89179 , 89183 .