Races in Fairborn, Ohio (OH) Detailed Stats
Data:
Races - White alone (%)
Races - White alone (% change since 2000)
Races - Black alone (%)
Races - Black alone (% change since 2000)
Races - American Indian alone (%)
Races - American Indian alone (% change since 2000)
Races - Asian alone (%)
Races - Asian alone (% change since 2000)
Races - Hispanic (%)
Races - Hispanic (% change since 2000)
Races - Native Hawaiian and Other Pacific Islander alone (%)
Races - Native Hawaiian and Other Pacific Islander alone (% change since 2000)
Races - Two or more races(%)
Races - Two or more races(% change since 2000)
Races - Other race alone (%)
Races - Other race alone (% change since 2000)
Racial diversity
Place of birth - Born in state of residence (%)
Place of birth - Born in state of residence (%) - White
Place of birth - Born in state of residence (%) - Black or African American
Place of birth - Born in state of residence (%) - Asian
Place of birth - Born in state of residence (%) - Hispanic or Latino
Place of birth - Born in state of residence (%) - American Indian and Alaska Native
Place of birth - Born in state of residence (%) - Multirace
Place of birth - Born in state of residence (%) - Other Race
Place of birth - Born in other state (%)
Place of birth - Born in other state (%) - White
Place of birth - Born in other state (%) - Black or African American
Place of birth - Born in other state (%) - Asian
Place of birth - Born in other state (%) - Hispanic or Latino
Place of birth - Born in other state (%) - American Indian and Alaska Native
Place of birth - Born in other state (%) - Multirace
Place of birth - Born in other state (%) - Other Race
Place of birth - Native, outside of US (%)
Place of birth - Native, outside of US (%) - White
Place of birth - Native, outside of US (%) - Black or African American
Place of birth - Native, outside of US (%) - Asian
Place of birth - Native, outside of US (%) - Hispanic or Latino
Place of birth - Native, outside of US (%) - American Indian and Alaska Native
Place of birth - Native, outside of US (%) - Multirace
Place of birth - Native, outside of US (%) - Other Race
Place of birth - Foreign born (%)
Place of birth - Foreign born (%) - White
Place of birth - Foreign born (%) - Black or African American
Place of birth - Foreign born (%) - Asian
Place of birth - Foreign born (%) - Hispanic or Latino
Place of birth - Foreign born (%) - American Indian and Alaska Native
Place of birth - Foreign born (%) - Multirace
Place of birth - Foreign born (%) - Other Race
Residents speaking English at home (%)
Residents speaking English at home - Born in the United States (%)
Residents speaking English at home - Native, born elsewhere (%)
Residents speaking English at home - Foreign born (%)
Residents speaking Spanish at home (%)
Residents speaking Spanish at home - Born in the United States (%)
Residents speaking Spanish at home - Native, born elsewhere (%)
Residents speaking Spanish at home - Foreign born (%)
Residents speaking other language at home (%)
Residents speaking other language at home - Born in the United States (%)
Residents speaking other language at home - Native, born elsewhere (%)
Residents speaking other language at home - Foreign born (%)
Marital status - Never married (%)
Marital status - Now married (%)
Marital status - Separated (%)
Marital status - Widowed (%)
Marital status - Divorced (%)
Ancestries Reported - Arab (%)
Ancestries Reported - Czech (%)
Ancestries Reported - Danish (%)
Ancestries Reported - Dutch (%)
Ancestries Reported - English (%)
Ancestries Reported - French (%)
Ancestries Reported - French Canadian (%)
Ancestries Reported - German (%)
Ancestries Reported - Greek (%)
Ancestries Reported - Hungarian (%)
Ancestries Reported - Irish (%)
Ancestries Reported - Italian (%)
Ancestries Reported - Lithuanian (%)
Ancestries Reported - Norwegian (%)
Ancestries Reported - Polish (%)
Ancestries Reported - Portuguese (%)
Ancestries Reported - Russian (%)
Ancestries Reported - Scotch-Irish (%)
Ancestries Reported - Scottish (%)
Ancestries Reported - Slovak (%)
Ancestries Reported - Subsaharan African (%)
Ancestries Reported - Swedish (%)
Ancestries Reported - Swiss (%)
Ancestries Reported - Ukrainian (%)
Ancestries Reported - United States (%)
Ancestries Reported - Welsh (%)
Ancestries Reported - West Indian (%)
Ancestries Reported - Other (%)
Geographical mobility - Same house 1 year ago (%)
Geographical mobility - Same house 1 year ago (%) - White
Geographical mobility - Same house 1 year ago (%) - Black or African American
Geographical mobility - Same house 1 year ago (%) - Asian
Geographical mobility - Same house 1 year ago (%) - Hispanic or Latino
Geographical mobility - Same house 1 year ago (%) - American Indian and Alaska Native
Geographical mobility - Same house 1 year ago (%) - Multirace
Geographical mobility - Same house 1 year ago (%) - Other Race
Geographical mobility - Moved within same county (%)
Geographical mobility - Moved within same county (%) - White
Geographical mobility - Moved within same county (%) - Black or African American
Geographical mobility - Moved within same county (%) - Asian
Geographical mobility - Moved within same county (%) - Hispanic or Latino
Geographical mobility - Moved within same county (%) - American Indian and Alaska Native
Geographical mobility - Moved within same county (%) - Multirace
Geographical mobility - Moved within same county (%) - Other Race
Geographical mobility - Moved from different county within same state (%)
Geographical mobility - Moved from different county within same state (%) - White
Geographical mobility - Moved from different county within same state (%) - Black or African American
Geographical mobility - Moved from different county within same state (%) - Asian
Geographical mobility - Moved from different county within same state (%) - Hispanic or Latino
Geographical mobility - Moved from different county within same state (%) - American Indian and Alaska Native
Geographical mobility - Moved from different county within same state (%) - Multirace
Geographical mobility - Moved from different county within same state (%) - Other Race
Geographical mobility - Moved from different state (%)
Geographical mobility - Moved from different state (%) - White
Geographical mobility - Moved from different state (%) - Black or African American
Geographical mobility - Moved from different state (%) - Asian
Geographical mobility - Moved from different state (%) - Hispanic or Latino
Geographical mobility - Moved from different state (%) - American Indian and Alaska Native
Geographical mobility - Moved from different state (%) - Multirace
Geographical mobility - Moved from different state (%) - Other Race
Geographical mobility - Moved from abroad (%)
Geographical mobility - Moved from abroad (%) - White
Geographical mobility - Moved from abroad (%) - Black or African American
Geographical mobility - Moved from abroad (%) - Asian
Geographical mobility - Moved from abroad (%) - Hispanic or Latino
Geographical mobility - Moved from abroad (%) - American Indian and Alaska Native
Geographical mobility - Moved from abroad (%) - Multirace
Geographical mobility - Moved from abroad (%) - Other Race
Place of birth for the foreign-born population - Ireland (%)
Place of birth for the foreign-born population - Denmark (%)
Place of birth for the foreign-born population - Norway (%)
Place of birth for the foreign-born population - Sweden (%)
Place of birth for the foreign-born population - United Kingdom (%)
Place of birth for the foreign-born population - England (%)
Place of birth for the foreign-born population - Scotland (%)
Place of birth for the foreign-born population - Other Northern Europe (%)
Place of birth for the foreign-born population - Austria (%)
Place of birth for the foreign-born population - Belgium (%)
Place of birth for the foreign-born population - France (%)
Place of birth for the foreign-born population - Germany (%)
Place of birth for the foreign-born population - Netherlands (%)
Place of birth for the foreign-born population - Switzerland (%)
Place of birth for the foreign-born population - Other Western Europe (%)
Place of birth for the foreign-born population - Greece (%)
Place of birth for the foreign-born population - Italy (%)
Place of birth for the foreign-born population - Portugal (%)
Place of birth for the foreign-born population - Spain (%)
Place of birth for the foreign-born population - Other Southern Europe (%)
Place of birth for the foreign-born population - Albania (%)
Place of birth for the foreign-born population - Belarus (%)
Place of birth for the foreign-born population - Bosnia and Herzegovina (%)
Place of birth for the foreign-born population - Bulgaria (%)
Place of birth for the foreign-born population - Croatia (%)
Place of birth for the foreign-born population - Czechoslovakia (%)
Place of birth for the foreign-born population - Hungary (%)
Place of birth for the foreign-born population - Latvia (%)
Place of birth for the foreign-born population - Lithuania (%)
Place of birth for the foreign-born population - North Macedonia (Macedonia) (%)
Place of birth for the foreign-born population - Moldova (%)
Place of birth for the foreign-born population - Poland (%)
Place of birth for the foreign-born population - Romania (%)
Place of birth for the foreign-born population - Russia (%)
Place of birth for the foreign-born population - Serbia (%)
Place of birth for the foreign-born population - Ukraine (%)
Place of birth for the foreign-born population - Other Eastern Europe (%)
Place of birth for the foreign-born population - China (%)
Place of birth for the foreign-born population - Hong Kong (%)
Place of birth for the foreign-born population - Taiwan (%)
Place of birth for the foreign-born population - Japan (%)
Place of birth for the foreign-born population - Korea (%)
Place of birth for the foreign-born population - Other Eastern Asia (%)
Place of birth for the foreign-born population - Afghanistan (%)
Place of birth for the foreign-born population - Bangladesh (%)
Place of birth for the foreign-born population - India (%)
Place of birth for the foreign-born population - Iran (%)
Place of birth for the foreign-born population - Kazakhstan (%)
Place of birth for the foreign-born population - Nepal (%)
Place of birth for the foreign-born population - Pakistan (%)
Place of birth for the foreign-born population - Sri Lanka (%)
Place of birth for the foreign-born population - Uzbekistan (%)
Place of birth for the foreign-born population - Other South Central Asia (%)
Place of birth for the foreign-born population - Burma (%)
Place of birth for the foreign-born population - Cambodia (%)
Place of birth for the foreign-born population - Indonesia (%)
Place of birth for the foreign-born population - Laos (%)
Place of birth for the foreign-born population - Malaysia (%)
Place of birth for the foreign-born population - Philippines (%)
Place of birth for the foreign-born population - Singapore (%)
Place of birth for the foreign-born population - Thailand (%)
Place of birth for the foreign-born population - Vietnam (%)
Place of birth for the foreign-born population - Other South Eastern Asia (%)
Place of birth for the foreign-born population - Armenia (%)
Place of birth for the foreign-born population - Iraq (%)
Place of birth for the foreign-born population - Israel (%)
Place of birth for the foreign-born population - Jordan (%)
Place of birth for the foreign-born population - Kuwait (%)
Place of birth for the foreign-born population - Lebanon (%)
Place of birth for the foreign-born population - Saudi Arabia (%)
Place of birth for the foreign-born population - Syria (%)
Place of birth for the foreign-born population - Turkey (%)
Place of birth for the foreign-born population - Yemen (%)
Place of birth for the foreign-born population - Other Western Asia (%)
Place of birth for the foreign-born population - Eritrea (%)
Place of birth for the foreign-born population - Ethiopia (%)
Place of birth for the foreign-born population - Kenya (%)
Place of birth for the foreign-born population - Somalia (%)
Place of birth for the foreign-born population - Uganda (%)
Place of birth for the foreign-born population - Zimbabwe (%)
Place of birth for the foreign-born population - Other Eastern Africa (%)
Place of birth for the foreign-born population - Cameroon (%)
Place of birth for the foreign-born population - Congo (%)
Place of birth for the foreign-born population - Democratic Republic of Congo (Zaire) (%)
Place of birth for the foreign-born population - Other Middle Africa (%)
Place of birth for the foreign-born population - Egypt (%)
Place of birth for the foreign-born population - Morocco (%)
Place of birth for the foreign-born population - Sudan (%)
Place of birth for the foreign-born population - Other Northern Africa (%)
Place of birth for the foreign-born population - South Africa (%)
Place of birth for the foreign-born population - Other Southern Africa (%)
Place of birth for the foreign-born population - Cabo Verde (%)
Place of birth for the foreign-born population - Ghana (%)
Place of birth for the foreign-born population - Liberia (%)
Place of birth for the foreign-born population - Nigeria (%)
Place of birth for the foreign-born population - Senegal (%)
Place of birth for the foreign-born population - Sierra Leone (%)
Place of birth for the foreign-born population - Other Western Africa (%)
Place of birth for the foreign-born population - Australia (%)
Place of birth for the foreign-born population - New Zealand (%)
Place of birth for the foreign-born population - Fiji (%)
Place of birth for the foreign-born population - Micronesia (%)
Place of birth for the foreign-born population - Bahamas (%)
Place of birth for the foreign-born population - Barbados (%)
Place of birth for the foreign-born population - Cuba (%)
Place of birth for the foreign-born population - Dominica (%)
Place of birth for the foreign-born population - Dominican Republic (%)
Place of birth for the foreign-born population - Grenada (%)
Place of birth for the foreign-born population - Haiti (%)
Place of birth for the foreign-born population - Jamaica (%)
Place of birth for the foreign-born population - St. Vincent and the Grenadines (%)
Place of birth for the foreign-born population - Trinidad and Tobago (%)
Place of birth for the foreign-born population - West Indies (%)
Place of birth for the foreign-born population - Other Caribbean (%)
Place of birth for the foreign-born population - Belize (%)
Place of birth for the foreign-born population - Costa Rica (%)
Place of birth for the foreign-born population - El Salvador (%)
Place of birth for the foreign-born population - Guatemala (%)
Place of birth for the foreign-born population - Honduras (%)
Place of birth for the foreign-born population - Mexico (%)
Place of birth for the foreign-born population - Nicaragua (%)
Place of birth for the foreign-born population - Panama (%)
Place of birth for the foreign-born population - Other Central America (%)
Place of birth for the foreign-born population - Argentina (%)
Place of birth for the foreign-born population - Bolivia (%)
Place of birth for the foreign-born population - Brazil (%)
Place of birth for the foreign-born population - Chile (%)
Place of birth for the foreign-born population - Colombia (%)
Place of birth for the foreign-born population - Ecuador (%)
Place of birth for the foreign-born population - Guyana (%)
Place of birth for the foreign-born population - Peru (%)
Place of birth for the foreign-born population - Uruguay (%)
Place of birth for the foreign-born population - Venezuela (%)
Place of birth for the foreign-born population - Other South America (%)
Place of birth for the foreign-born population - Canada (%)
Place of birth for the foreign-born population - Other Northern America (%)
Place of birth for the foreign-born population - Other (%)
Latest news about races in Fairborn, OH collected exclusively by city-data.com from local newspapers, TV, and radio stations
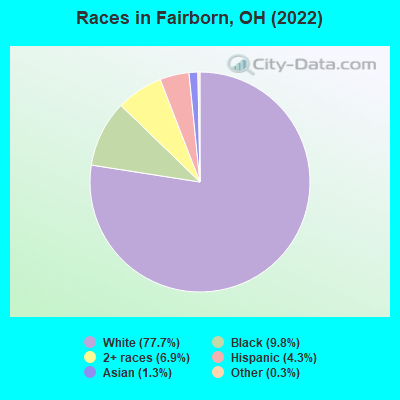
According to 2022 data, the most numerous races in Fairborn, OH are White alone (26,939 residents), Black alone (3,401 residents), and Two or more races (2,398 residents). 94.9% of Fairborn residents speak English at home. 5.2% of Fairborn, OH residents are foreign-born (1.8% born in Asia, 1.1% born in Europe, 1.0% born in Latin America, 0.8% born in Africa), which is 23.3% greater than the foreign-born rate of 4.0% across the entire state of Ohio.
Race distribution in Fairborn
2000 2022
9,538,111 84.0% White alone 1,290,662 11.4% Black alone 217,123 1.9% Hispanic 137,770 1.2% Two or more races 131,670 1.2% Asian alone 21,985 0.2% American Indian alone 13,483 0.1% Other race alone 2,336 0.02% Native Hawaiian and Other
8,948,793 76.1% White alone 1,401,403 11.9% Black alone 529,291 4.5% Two or more races 517,232 4.4% Hispanic 293,387 2.5% Asian alone 52,805 0.4% Other race alone 9,785 0.08% American Indian alone 3,362 0.03% Native Hawaiian and Other
Income and house value in Fairborn Median household income in 2022 $56,640 White non-Hispanic householders$58,716 Black householders$29,589 Asian householders$41,982 Some other race householders$52,007 Two or more races householders$60,691 Hispanic or Latino race householdersMedian 2022 house value $176,762 White Non-Hispanic householders$205,353 Black or African American householders$205,353 American Indian or Alaska Native householders $140,057 Asian householders$189,898 Two or more races householders$215,978 Hispanic or Latino householders
Median age by race in Fairborn
37.6 Median age for White residents36.9 38.3 28.2 Median age for Black or African American residents24.9 36.1 54.1 Median age for American Indian / Alaska Native residents-665,067,945.0 -443,438,913.6 37.5 Median age for Asian residents22.6 55.5 -800,387,596.1 Median age for Native Hawaiian / Pacific Islander residents-666,666,666.0 -805,394,989.6 33.7 Median age for Other race residents43.8 23.8 27.2 Median age for Two or more races residents28.3 27.8 38.6 Median age for White alone residents38.2 38.7 30.2 Median age for Hispanic or Latino residents19.7 33.9
Owner/renter occupied households by race in Fairborn
House owners and renters - White residents 6,660 51.6% Owner occupied6,241 48.4% Renter occupiedHouse owners and renters - Black or African American residents 372 30.3% Owner occupied858 69.7% Renter occupiedHouse owners and renters - American Indian / Alaska Native residents 25 66.9% Owner occupied13 33.1% Renter occupiedHouse owners and renters - Asian residents 149 61.9% Owner occupied92 38.1% Renter occupiedHouse owners and renters - Other race residents 22 12.5% Owner occupied156 87.5% Renter occupiedHouse owners and renters - Two or more races residents 613 51.1% Owner occupied588 48.9% Renter occupiedHouse owners and renters - White alone residents 6,505 51.9% Owner occupied6,040 48.1% Renter occupiedHouse owners and renters - Hispanic or Latino residents 313 50.9% Owner occupied301 49.1% Renter occupied
Language usage in Fairborn
English speakers - Total 94.9% of residents of Fairborn speak English at home.
1.7% of residents speak Spanish at home 384 68.8% Speak English very well174 31.2% Speak English less than very well3.2% of residents speak other language at home 843 81.1% Speak English very well196 18.9% Speak English less than very well
English speakers - Born in the United States 97.0% of residents of Fairborn speak English at home.
2.7% of residents speak Spanish at home 242 95.7% Speak English very well11 4.3% Speak English less than very well0.7% of residents speak other language at home 62 93.9% Speak English very well4 6.1% Speak English less than very well
English speakers - Native, born elsewhere 88.9% of residents of Fairborn speak English at home.
7.8% of residents speak Spanish at home 22 75.9% Speak English very well7 24.1% Speak English less than very well1.6% of residents speak other language at home 6 100.0% Speak English very well
English speakers - Foreign-born 30.7% of residents of Fairborn speak English at home.
14.5% of residents speak Spanish at home 139 59.9% Speak English very well93 40.1% Speak English less than very well50.1% of residents speak other language at home 651 81.2% Speak English very well151 18.8% Speak English less than very well
White (Caucasian) - Speak only English Native:
98.7% (25,055)Foreign-born:
53.0% (370)
White (Caucasian) - Speak another language Native:
1.2% (315)Foreign-born:
42.6% (298)
Black or African American - Speak only English Native:
99.1% (2,567)Foreign-born:
7.5% (19)
Black or African American - Speak another language Native:
0.8% (21)Foreign-born:
90.6% (224)
Asian - Speak only English Native:
98.2% (114)Foreign-born:
26.8% (88)
Asian - Speak another language Native:
11.1% (13)Foreign-born:
74.1% (243)
Other race - Speak only English Native:
77.7% (156)Foreign-born:
9.3% (9)
Other race - Speak another language Native:
20.7% (42)Foreign-born:
90.5% (83)
Two or more races - Speak only English Native:
89.8% (2,487)Foreign-born:
8.6% (26)
Two or more races - Speak another language Native:
10.1% (280)Foreign-born:
93.0% (286)
White alone - Speak only English Native:
98.9% (24,489)Foreign-born:
55.2% (373)
White alone - Speak another language Native:
1.1% (269)Foreign-born:
41.5% (280)
Hispanic or Latino - Speak only English Native:
86.6% (893)Foreign-born:
3.9% (9)
Hispanic or Latino - Speak another language Native:
15.4% (159)Foreign-born:
100.0% (233)
Foreign-born residents in Fairborn 1,809 residents are foreign born (1.8% Asia , 1.1% Europe , 1.0% Latin America , 0.8% Africa ).
Marital status for residents in Fairborn Marital status - White (Caucasian) population 15 years and over
Males 39.5% Never married44.0% Now married1.8% Separated3.9% Widowed10.8% DivorcedFemales 29.7% Never married40.4% Now married1.9% Separated9.4% Widowed18.6% DivorcedWomen who gave birth in the past 12 months Now married:
46.7% (171)Unmarried:
53.3% (196)
Women who did not give birth in the past 12 months Now married:
37.0% (2,444)Unmarried:
63.0% (4,163)
Marital status - Black or African American population 15 years and over
Males 50.5% Never married34.1% Now married3.8% Separated0.8% Widowed10.8% DivorcedFemales 54.2% Never married25.3% Now married3.3% Separated1.4% Widowed15.8% DivorcedWomen who gave birth in the past 12 months Now married:
51.4% (72)Unmarried:
48.6% (68)
Women who did not give birth in the past 12 months Now married:
17.2% (158)Unmarried:
82.8% (760)
Marital status - American Indian / Alaska Native population 15 years and over
Males 0.0% Never married0.0% Now married0.0% Separated0.0% Widowed100.0% DivorcedFemales 100.0% Never married0.0% Now married0.0% Separated0.0% Widowed0.0% DivorcedMarital status - Asian population 15 years and over
Males 72.6% Never married27.4% Now married0.0% Separated0.0% Widowed0.0% DivorcedFemales 32.4% Never married43.0% Now married0.0% Separated8.1% Widowed16.5% DivorcedWomen who gave birth in the past 12 months Now married:
100.0% (4)Unmarried:
0.0% (0)
Women who did not give birth in the past 12 months Now married:
10.9% (15)Unmarried:
89.1% (124)
Marital status - Other race population 15 years and over
Males 51.1% Never married26.6% Now married0.0% Separated0.0% Widowed22.3% DivorcedFemales 0.0% Never married88.8% Now married0.0% Separated0.0% Widowed11.2% DivorcedWomen who gave birth in the past 12 months Now married:
100.0% (20)Unmarried:
0.0% (0)
Women who did not give birth in the past 12 months Now married:
100.0% (67)Unmarried:
0.0% (0)
Marital status - Two or more races population 15 years and over
Males 41.9% Never married39.1% Now married0.0% Separated6.3% Widowed12.7% DivorcedFemales 28.1% Never married26.2% Now married16.0% Separated4.7% Widowed25.0% DivorcedWomen who gave birth in the past 12 months Now married:
100.0% (151)Unmarried:
0.0% (0)
Women who did not give birth in the past 12 months Now married:
29.5% (151)Unmarried:
70.5% (361)
Marital status - White alone, not Hispanic / Latino population 15 years and over
Males 39.3% Never married44.1% Now married1.8% Separated3.8% Widowed11.0% DivorcedFemales 29.7% Never married40.1% Now married2.0% Separated9.4% Widowed18.8% DivorcedWomen who gave birth in the past 12 months Now married:
46.7% (169)Unmarried:
53.3% (193)
Women who did not give birth in the past 12 months Now married:
36.5% (2,322)Unmarried:
63.5% (4,044)
Marital status - Hispanic or Latino population 15 years and over
Males 54.5% Never married33.8% Now married0.0% Separated4.4% Widowed7.3% DivorcedFemales 20.3% Never married43.9% Now married24.5% Separated5.8% Widowed5.4% DivorcedWomen who gave birth in the past 12 months Now married:
100.0% (120)Unmarried:
0.0% (0)
Women who did not give birth in the past 12 months Now married:
70.9% (183)Unmarried:
29.1% (75)
Ancestries in Fairborn
2,030 14.4% English1,921 13.6% American1,881 13.3% German694 4.9% Irish487 3.5% European376 2.7% Italian219 1.6% African215 1.5% Polish135 1.0% Scottish113 0.8% Russian112 0.8% Welsh100 0.7% Greek96 0.7% Ghanaian89 0.6% Nigerian80 0.6% Swedish78 0.6% French77 0.5% Scotch-Irish62 0.4% Austrian49 0.3% Czech47 0.3% British47 0.3% Dutch39 0.3% Iranian37 0.3% Kenyan31 0.2% French Canadian31 0.2% Haitian27 0.2% Lithuanian25 0.2% Portuguese25 0.2% West Indian24 0.2% Slavic24 0.2% Norwegian22 0.2% Romanian22 0.2% Finnish21 0.1% Slovak20 0.1% Australian19 0.1% Hungarian17 0.1% Jamaican16 0.1% Scandinavian14 0.10% Eastern European5 0.04% Canadian
Geographical mobility in Fairborn Same house 1 year ago 21,933 80.1% White (Caucasian)2,466 76.4% Black or African American30 76.4% American Indian / Alaska Native378 79.9% Asian233 74.7% Other race2,488 88.8% Two or more races21,363 80.2% White alone, not Hispanic / Latino1,083 76.9% Hispanic or LatinoMoved within same county 2,249 8.2% White / Caucasian333 10.3% Black or African American11 2.3% Asian74 2.7% Two or more races2,200 8.3% White alone, not Hispanic / Latino60 4.2% Hispanic or LatinoMoved within same state 2,433 8.9% White / Caucasian416 12.9% Black or African American8 20.2% American Indian / Alaska Native47 10.0% Asian36 11.5% Other race210 7.5% Two or more races2,347 8.8% White alone, not Hispanic / Latino97 6.9% Hispanic or LatinoMoved from different state 448 1.6% White / Caucasian72 2.2% Black or African American5 1.0% Asian286 10.2% Two or more races412 1.5% White alone, not Hispanic / Latino95 6.7% Hispanic or LatinoMoved from abroad 510 1.9% White3 0.1% Black or African American41 8.7% Asian85 27.3% Other race59 2.1% Two or more races529 2.0% White alone, not Hispanic / Latino122 8.7% Hispanic or Latino
Children Nativity (place of birth) in Fairborn
Children under 6 years - Living with two parents Both parents native 1,027 100.0% NativeBoth parents foreign-born 37 80.5% Native9 19.5% Foreign-bornOne native, one foreign-born parent 76 100.0% NativeChildren under 6 years - Living with one parent Native parent 1,409 98.7% Native19 1.3% Foreign-bornForeign-born parent 106 100.0% NativeChildren 6 to 17 years - Living with two parents Both parents native 1,462 100.0% NativeBoth parents foreign-born 5 30.0% Native12 70.0% Foreign-bornOne native, one foreign-born parent 210 94.4% Native13 5.6% Foreign-bornChildren 6 to 17 years - Living with one parent Native parent 1,792 100.0% NativeForeign-born parent 19 50.4% Native19 49.6% Foreign-born
Grandparents responsible for own grandchildren in Fairborn
Grandparents (30 to 59 years) White / Caucasian 167 80.1% Responsible for grandchildren41 19.9% Not responsible for grandchildrenBlack or African American 68 83.0% Responsible for grandchildren14 17.0% Not responsible for grandchildrenTwo or more races 49 100.0% Responsible for grandchildrenWhite alone, not Hispanic / Latino 167 80.1% Responsible for grandchildren41 19.9% Not responsible for grandchildrenGrandparents (60 years and over) White / Caucasian 143 48.6% Responsible for grandchildren151 51.4% Not responsible for grandchildrenBlack or African American 11 35.1% Responsible for grandchildren20 64.9% Not responsible for grandchildrenWhite alone, not Hispanic / Latino 143 48.6% Responsible for grandchildren151 51.4% Not responsible for grandchildren