Estimated zip code population in 2022: 39,636 Zip code population in 2010: 37,247 Zip code population in 2000: 35,256
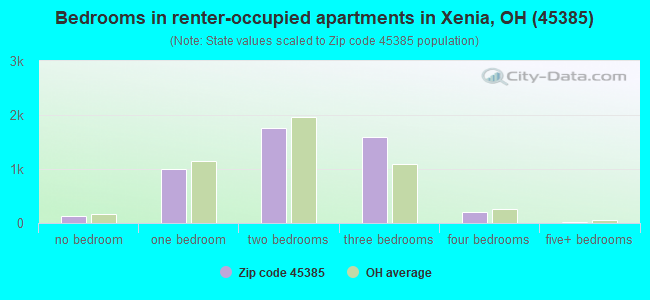
Houses and condos: 16,879 Renter-occupied apartments: 4,699
% of renters here:
30%
State:
33%
March 2022 cost of living index in zip code 45385: 94.1 (less than average, U.S. average is 100)
Land area: 136.7 sq. mi. Water area: 0.9 sq. mi.
Population density: 290 people per square mile
(very low).
OSM Map
General Map
Google Map
MSN Map
OSM Map
General Map
Google Map
MSN Map
OSM Map
General Map
Google Map
MSN Map
OSM Map
General Map
Google Map
MSN Map
Please wait while loading the map...
Real estate property taxes paid for housing units in 2022:
This zip code:
1.3% ($2,640)
Ohio:
1.3% ($2,639)
Median real estate property taxes paid for housing units with mortgages in 2022: $2,636 (1.2%) Median real estate property taxes paid for housing units with no mortgage in 2022: $2,658 (1.4%)
Estimated median house/condo value in 2022: $207,440
45385:
$207,440
Ohio:
$204,100
According to our research of Ohio and other state lists, there were 61 registered sex offenders living in 45385 zip code as of May 23, 2024. The ratio of all residents to sex offenders in zip code 45385 is 636 to 1. The ratio of registered sex offenders to all residents in this zip code is near the state average.
Median resident age:
This zip code:
40.9 years
Ohio median age:
39.9 years
Average household size:
This zip code:
2.4 people
Ohio:
2.4 people
Averages for the 2020 tax year for zip code 45385, filed in 2021:
Average Adjusted Gross Income (AGI) in 2020: $71,252 (Individual Income Tax Returns)
Here:
$71,252
State:
$67,288
Salary/wage: $57,812 (reported on 79.4% of returns)
Here:
$57,812
State:
$55,628
(% of AGI for various income ranges: 1105.1% for AGIs below $25k, 3361.8% for AGIs $25k-50k, 6105.6% for AGIs $50k-75k, 9323.9% for AGIs $75k-100k, 17610.3% for AGIs $100k-200k, 69233.6% for AGIs over 200k)
Taxable interest for individuals: $1,018 (reported on 37.8% of returns)
This zip code:
$1,018
Ohio:
$1,518
(% of AGI for various income ranges: 10.6% for AGIs below $25k, 17.7% for AGIs $25k-50k, 39.2% for AGIs $50k-75k, 51.7% for AGIs $75k-100k, 127.1% for AGIs $100k-200k, 1014.3% for AGIs over 200k)
Ordinary dividends: $6,138 (reported on 18.5% of returns)
Here:
$6,138
State:
$7,167
(% of AGI for various income ranges: 15.2% for AGIs below $25k, 29.2% for AGIs $25k-50k, 71.2% for AGIs $50k-75k, 129.1% for AGIs $75k-100k, 380.6% for AGIs $100k-200k, 3941.1% for AGIs over 200k)
Net capital gain/loss in AGI: +$20,462 (reported on 16.5% of returns)
Here:
+$20,462
State:
+$18,919
(% of AGI for various income ranges: 8.0% for AGIs below $25k, 27.3% for AGIs $25k-50k, 77.0% for AGIs $50k-75k, 138.6% for AGIs $75k-100k, 596.6% for AGIs $100k-200k, 17994.6% for AGIs over 200k)
Profit/loss from business: +$15,655 (reported on 13.3% of returns)
Here:
+$15,655
State:
+$13,744
(% of AGI for various income ranges: 82.5% for AGIs below $25k, 100.3% for AGIs $25k-50k, 192.9% for AGIs $50k-75k, 289.9% for AGIs $75k-100k, 575.6% for AGIs $100k-200k, 5728.9% for AGIs over 200k)
Taxable individual retirement arrangement distribution: $17,514 (reported on 9.7% of returns)
45385:
$17,514
Ohio:
$18,876
(% of AGI for various income ranges: 54.3% for AGIs below $25k, 93.8% for AGIs $25k-50k, 219.4% for AGIs $50k-75k, 344.1% for AGIs $75k-100k, 693.1% for AGIs $100k-200k, 2615.7% for AGIs over 200k)
Self-employed (Keogh) retirement plans: $29,775 (reported on 0.4% of returns)
45385:
$29,775
Ohio:
$24,898
(% of AGI for various income ranges: 30.4% for AGIs $100k-200k, 684.6% for AGIs over 200k)
Total itemized deductions: $35,499 (reported on 6.8% of returns)
Here:
$35,499
State:
$33,869
(% of AGI for various income ranges: 35.6% for AGIs below $25k, 76.4% for AGIs $25k-50k, 210.6% for AGIs $50k-75k, 346.2% for AGIs $75k-100k, 927.1% for AGIs $100k-200k, 6636.1% for AGIs over 200k)
Charity contributions: $14,750 (reported on 5.4% of returns)
Here:
$14,750
State:
$14,577
(% of AGI for various income ranges: 1.7% for AGIs below $25k, 9.9% for AGIs $25k-50k, 47.4% for AGIs $50k-75k, 61.3% for AGIs $75k-100k, 300.8% for AGIs $100k-200k, 3026.8% for AGIs over 200k)
Taxes paid: $7,699 (reported on 6.7% of returns)
45385:
$7,699
State:
$7,681
(% of AGI for various income ranges: 2.8% for AGIs below $25k, 10.6% for AGIs $25k-50k, 43.8% for AGIs $50k-75k, 93.9% for AGIs $75k-100k, 267.0% for AGIs $100k-200k, 1143.2% for AGIs over 200k)
Earned income credit: $2,215 (reported on 15.0% of returns)
Here:
$2,215
State:
$2,304
(% of AGI for various income ranges: 88.3% for AGIs below $25k, 64.3% for AGIs $25k-50k, 1.7% for AGIs $50k-75k)
Percentage of individuals using paid preparers for their 2020 taxes: 94.0%
Here:
94%
State:
94%
(% for various income ranges: 92.9% for AGIs below $25k, 95.6% for AGIs $25k-50k, 95.1% for AGIs $50k-75k, 93.3% for AGIs $75k-100k, 92.9% for AGIs $100k-200k, 93.5% for AGIs over 200k)
Averages for the 2012 tax year for zip code 45385, filed in 2013:
Average Adjusted Gross Income (AGI) in 2012: $54,376 (Individual Income Tax Returns)
Here:
$54,376
State:
$54,926
Salary/wage: $45,150 (reported on 81.4% of returns)
Here:
$45,150
State:
$45,869
(% of AGI for various income ranges: 71.9% for AGIs below $25k, 73.7% for AGIs $25k-50k, 70.2% for AGIs $50k-75k, 73.8% for AGIs $75k-100k, 72.4% for AGIs $100k-200k, 49.4% for AGIs over 200k)
Taxable interest for individuals: $1,042 (reported on 35.8% of returns)
This zip code:
$1,042
Ohio:
$1,297
(% of AGI for various income ranges: 0.7% for AGIs below $25k, 0.4% for AGIs $25k-50k, 0.5% for AGIs $50k-75k, 0.7% for AGIs $75k-100k, 0.8% for AGIs $100k-200k, 0.8% for AGIs over 200k)
Ordinary dividends: $4,728 (reported on 18.3% of returns)
Here:
$4,728
State:
$5,821
(% of AGI for various income ranges: 1.1% for AGIs below $25k, 0.6% for AGIs $25k-50k, 0.8% for AGIs $50k-75k, 1.0% for AGIs $75k-100k, 1.5% for AGIs $100k-200k, 3.6% for AGIs over 200k)
Net capital gain/loss in AGI: +$11,083 (reported on 13.6% of returns)
Here:
+$11,083
State:
+$11,232
(% of AGI for various income ranges: 0.4% for AGIs $50k-75k, 0.7% for AGIs $75k-100k, 1.2% for AGIs $100k-200k, 11.1% for AGIs over 200k)
Profit/loss from business: +$13,650 (reported on 13.0% of returns)
Here:
+$13,650
State:
+$12,773
(% of AGI for various income ranges: 5.8% for AGIs below $25k, 2.2% for AGIs $25k-50k, 2.2% for AGIs $50k-75k, 1.9% for AGIs $75k-100k, 2.4% for AGIs $100k-200k, 5.8% for AGIs over 200k)
Taxable individual retirement arrangement distribution: $12,305 (reported on 10.5% of returns)
45385:
$12,305
Ohio:
$14,511
(% of AGI for various income ranges: 3.1% for AGIs below $25k, 2.2% for AGIs $25k-50k, 2.7% for AGIs $50k-75k, 2.8% for AGIs $75k-100k, 2.8% for AGIs $100k-200k, 1.2% for AGIs over 200k)
Self-employment retirement plans: $19,880 (reported on 0.6% of returns)
45385:
$19,880
Ohio:
$20,257
(% of AGI for various income ranges: 0.1% for AGIs $50k-75k, 0.2% for AGIs $100k-200k, 0.7% for AGIs over 200k)
Total itemized deductions: $20,970 (19% of AGI, reported on 31.7% of returns)
Here:
$20,970
State:
$21,278
Here:
19.5% of AGI
State:
18.8% of AGI
(% of AGI for various income ranges: 7.1% for AGIs below $25k, 9.1% for AGIs $25k-50k, 11.8% for AGIs $50k-75k, 14.1% for AGIs $75k-100k, 15.5% for AGIs $100k-200k, 12.3% for AGIs over 200k)
Charity contributions: $4,286 (reported on 24.5% of returns)
Here:
$4,286
State:
$3,943
(% of AGI for various income ranges: 0.8% for AGIs below $25k, 1.1% for AGIs $25k-50k, 1.7% for AGIs $50k-75k, 2.3% for AGIs $75k-100k, 2.6% for AGIs $100k-200k, 2.3% for AGIs over 200k)
Taxes paid: $8,937 (reported on 31.7% of returns)
45385:
$8,937
State:
$9,568
(% of AGI for various income ranges: 1.3% for AGIs below $25k, 2.6% for AGIs $25k-50k, 4.2% for AGIs $50k-75k, 5.7% for AGIs $75k-100k, 7.1% for AGIs $100k-200k, 7.3% for AGIs over 200k)
Earned income credit: $2,180 (reported on 18.8% of returns)
Here:
$2,180
State:
$2,285
(% of AGI for various income ranges: 6.5% for AGIs below $25k, 1.0% for AGIs $25k-50k)
Percentage of individuals using paid preparers for their 2012 taxes: 44.0%
Here:
44%
State:
51%
(% for various income ranges: 37.0% for AGIs below $25k, 46.3% for AGIs $25k-50k, 49.0% for AGIs $50k-75k, 47.3% for AGIs $75k-100k, 49.4% for AGIs $100k-200k, 71.1% for AGIs over 200k)
Averages for the 2004 tax year for zip code 45385, filed in 2005:
Average Adjusted Gross Income (AGI) in 2004: $43,402 (Individual Income Tax Returns)
Here:
$43,402
State:
$44,480
Salary/wage: $37,931 (reported on 84.7% of returns)
Here:
$37,931
State:
$39,198
(% of AGI for various income ranges: 120.0% for AGIs below $10k, 72.3% for AGIs $10k-25k, 76.6% for AGIs $25k-50k, 79.0% for AGIs $50k-75k, 82.5% for AGIs $75k-100k, 63.2% for AGIs over 100k)
Taxable interest for individuals: $1,295 (reported on 40.6% of returns)
This zip code:
$1,295
Ohio:
$1,532
(% of AGI for various income ranges: 3.7% for AGIs below $10k, 1.7% for AGIs $10k-25k, 1.1% for AGIs $25k-50k, 0.9% for AGIs $50k-75k, 0.9% for AGIs $75k-100k, 1.4% for AGIs over 100k)
Taxable dividends: $2,806 (reported on 22.0% of returns)
Here:
$2,806
State:
$3,496
(% of AGI for various income ranges: 3.3% for AGIs below $10k, 0.9% for AGIs $10k-25k, 0.7% for AGIs $25k-50k, 1.0% for AGIs $50k-75k, 0.8% for AGIs $75k-100k, 2.6% for AGIs over 100k)
Net capital gain/loss: +$5,648 (reported on 16.6% of returns)
Here:
+$5,648
State:
+$8,582
(% of AGI for various income ranges: -0.7% for AGIs below $10k, 0.2% for AGIs $10k-25k, 0.4% for AGIs $25k-50k, 0.8% for AGIs $50k-75k, 0.9% for AGIs $75k-100k, 5.7% for AGIs over 100k)
Profit/loss from business: +$11,470 (reported on 12.9% of returns)
Here:
+$11,470
State:
+$10,813
(% of AGI for various income ranges: 1.9% for AGIs below $10k, 3.3% for AGIs $10k-25k, 2.3% for AGIs $25k-50k, 2.2% for AGIs $50k-75k, 2.7% for AGIs $75k-100k, 5.4% for AGIs over 100k)
IRA payment deduction: $2,885 (reported on 1.4% of returns)
45385:
$2,885
Ohio:
$2,794
(% of AGI for various income ranges: 0.1% for AGIs $10k-25k, 0.1% for AGIs $25k-50k, 0.1% for AGIs $50k-75k, 0.1% for AGIs $75k-100k, 0.1% for AGIs over 100k)
Self-employed pension: $13,640 (reported on 0.7% of returns)
Here:
$13,640
Ohio:
$13,981
(% of AGI for various income ranges: 0.0% for AGIs $25k-50k, 0.0% for AGIs $50k-75k, 0.1% for AGIs $75k-100k, 0.6% for AGIs over 100k)
Total itemized deductions: $17,029 (21% of AGI, reported on 35.5% of returns)
Here:
$17,029
State:
$17,503
Here:
21.4% of AGI
State:
20.8% of AGI
(% of AGI for various income ranges: 16.0% for AGIs below $10k, 6.9% for AGIs $10k-25k, 11.7% for AGIs $25k-50k, 15.3% for AGIs $50k-75k, 16.9% for AGIs $75k-100k, 15.3% for AGIs over 100k)
Charity contributions deductions: $3,091 (4% of AGI, reported on 28.8% of returns)
Here:
$3,091
State:
$3,087
Here:
3.6% of AGI
State:
3.4% of AGI
(% of AGI for various income ranges: 0.9% for AGIs below $10k, 0.8% for AGIs $10k-25k, 1.4% for AGIs $25k-50k, 2.2% for AGIs $50k-75k, 2.4% for AGIs $75k-100k, 2.7% for AGIs over 100k)
Total tax: $6,443 (reported on 75.4% of returns)
45385:
$6,443
State:
$6,781
(% of AGI for various income ranges: 2.6% for AGIs below $10k, 4.0% for AGIs $10k-25k, 7.0% for AGIs $25k-50k, 8.9% for AGIs $50k-75k, 10.3% for AGIs $75k-100k, 18.8% for AGIs over 100k)
Earned income credit: $1,626 (reported on 14.4% of returns)
Here:
$1,626
State:
$1,696
Percentage of individuals using paid preparers for their 2004 taxes: 52.6%
Here:
53%
State:
55%
(% for various income ranges: 44.0% for AGIs below $10k, 55.6% for AGIs $10k-25k, 56.0% for AGIs $25k-50k, 53.1% for AGIs $50k-75k, 48.0% for AGIs $75k-100k, 57.9% for AGIs over 100k)
Likely homosexual households (counted as self-reported same-sex unmarried-partner households)
Lesbian couples: 0.3% of all households
Gay men: 0.1% of all households
Household received Food Stamps/SNAP in the past 12 months: 2,188 Household did not receive Food Stamps/SNAP in the past 12 months: 13,686
Women who had a birth in the past 12 months: 559 (360 now married, 199 unmarried) Women who did not have a birth in the past 12 months: 7,849 (3,581 now married, 4,266 unmarried)
Housing units in zip code 45385 with a mortgage: 7,183 (679 second mortgage, 50 home equity loan, 555 both second mortgage and home equity loan) Houses without a mortgage: 113
Median monthly owner costs for units with a mortgage: $1,379 Median monthly owner costs for units without a mortgage: $542
Residents with income below the poverty level in 2022:
This zip code:
12.3%
Whole state:
13.4%
Residents with income below 50% of the poverty level in 2022:
This zip code:
5.4%
Whole state:
7.0%
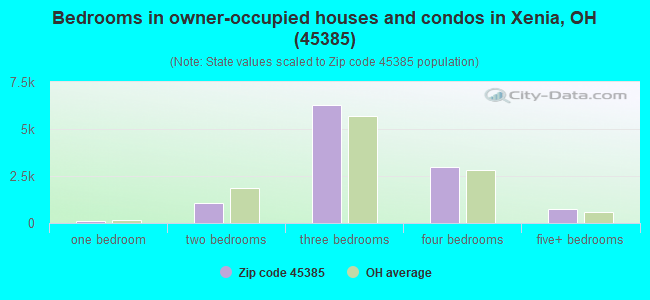
Median number of rooms in houses and condos:
Here:
6.7
State:
6.7
Median number of rooms in apartments:
Here:
4.6
State:
4.4
Notable locations in this zip code not listed on our city pages
5,501 married couples with children.
2,301 single-parent households (591 men, 1,710 women).
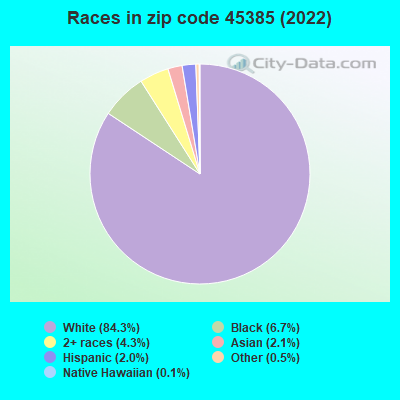
95.3% of residents of 45385 zip code speak English at home.
1.1% of residents speak Spanish at home (62% very well, 19% well, 19% not well).
1.9% of residents speak other Indo-European language at home (85% very well, 7% well, 8% not well).
0.9% of residents speak Asian or Pacific Island language at home (84% very well, 16% well).
0.6% of residents speak other language at home (76% very well, 4% well, 20% not well).
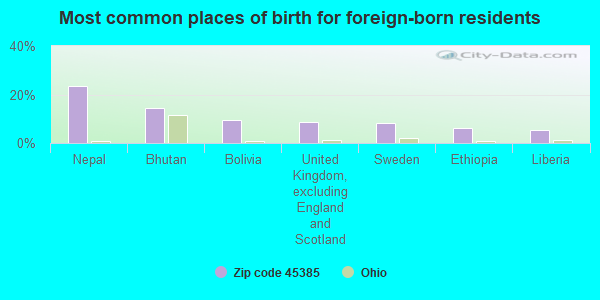
Foreign born population: 1,427 (3.6%) (73.9% of them are naturalized citizens)
This zip code:
3.6%
Whole state:
5.0%
24%Nepal
15%Bhutan
9%Bolivia
9%United Kingdom, excluding England and Scotland
8%Sweden
6%Ethiopia
5%Liberia
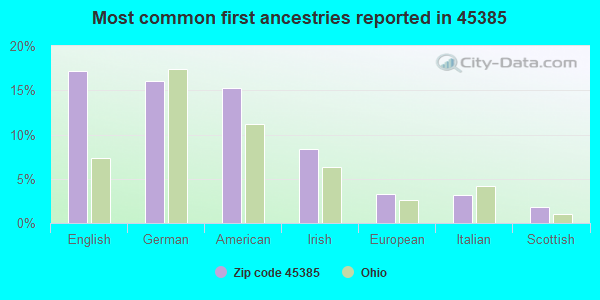
17%English
16%German
15%American
8%Irish
3%European
3%Italian
2%Scottish
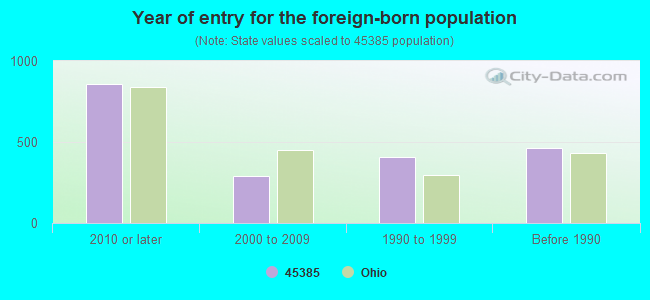
Year of entry for the foreign-born population
8572010 or later
2922000 to 2009
4101990 to 1999
463Before 1990
Facilities with environmental interests located in this zip code:
AMERICAN AGGREGIATES INC * (780 NORTH VALLEY ROAD in XENIA, OH)
AIR MINOR (AIRS/AFS) STATE MASTER (Ohio general info) - PCS-OH0092622, National Pollutant Discharge Elimination System Permit, RCRA-OHD987010287, HAZARDOUS WASTE PROGRAM, AIR MAJOR STATE MASTER (Ohio general info) - SDWIS-2944812, DRINKING WATER PROGRAM STATE MASTER (Ohio general info) - SDWIS-1235412, DRINKING WATER PROGRAM Large Quantity Generators, more that 1000 kg of hazardous waste/month (Resource Conservation and Recovery Act (tracking hazardous waste)) - notification Business SIC classification: INDUSTRIAL SAND Organizations: AMERICAN AGGREGATES (CONTACT/OWNER)
, MARTIN MARIETTA AG (CONTACT/OWNER)
Alternative names: AMERICAN AGGREGATES, AMERICAN AGGREGATES CORP NO 222 BLUEROCK PLANT, AMERICAN AGGREGATES XENIA
ARROWOOD SCHOOL (1694 PAWNEE DR in XENIA, OH)
(Geographic Names Information System) (National Center for Education Statistics) - STATE ID-001032 STATE MASTER (Ohio general info) - AIR MAJOR Organizations: XENIA COMMUNITY CITY SD (SCHOOL DISTRICT)
Alternative names: ARROWOOD ELEMENTARY SCHOOL
BP OIL CO (326 WEST MAIN STREET in XENIA, OH)
AIR MINOR (AIRS/AFS) CRITERIA AND HAZARDOUS AIR POLLUTANT INVENTORY (Inventory of air pollution sources) STATE MASTER (Ohio general info) - RCRA-OHD987015906, HAZARDOUS WASTE PROGRAM, AIR MAJOR, -29-5541-1038-2, EPCRA Conditionally Exempt Small Quantity Generators, less than 100 kg/month of hazardous waste (Resource Conservation and Recovery Act (tracking hazardous waste)) - notification Business SIC classification: GASOLINE SERVICE STATIONS Organizations: BP OIL COMPANY (CONTACT/OWNER)
Alternative names: BP AMOCO #09665
AT & T XENIA (2716 E SPRING VALLEY in XENIA, OH)
STATE MASTER (Ohio general info) - AIR MAJOR, -29-4813-118-1, EPCRA (Resource Conservation and Recovery Act (tracking hazardous waste)) Organizations: AMERICAN TELEPHONE AND TELEGRA (CONTACT/OWNER)
Alternative names: AT&T LONG LINES XENIA OH
BP OIL NO 09833 (281 E MAIN ST in XENIA, OH)
STATE MASTER (Ohio general info) - AIR MAJOR (Resource Conservation and Recovery Act (tracking hazardous waste)) Organizations: BP OIL COMPANY (CONTACT/OWNER)
Alternative names: BP OIL CO
CENTRAL MIDDLE SCHOOL (425 EDISON BLVD in XENIA, OH)
(National Center for Education Statistics) - STATE ID-005678 Organizations: XENIA COMMUNITY CITY SD (SCHOOL DISTRICT)
BENEDICT SLURRY SEAL INC (556 N VALLEY RD in XENIA, OH)
(Resource Conservation and Recovery Act (tracking hazardous waste)) Organizations: ALICE W BENEDICT (CONTACT/OWNER)
CENTRAL JR HIGH SCHOOL (425 EDISON BLVD in XENIA, OH)
Small Quantity Generators, between 100 kg and 1000 kg of hazardous waste/month (Resource Conservation and Recovery Act (tracking hazardous waste)) - notification Organizations: XENIA CITY SCHOOLS (CONTACT/OWNER)
ARMENTROUT EXCAVATING (766 HAWKINS RD in XENIA, OH)
SUPERFUND (Superfund database) Alternative names: ARMENTROUT FRANK LDFL, OHIO XENIA ARMENTROUT
Housing units lacking complete plumbing facilities: 1.3% Housing units lacking complete kitchen facilities: 2.2%
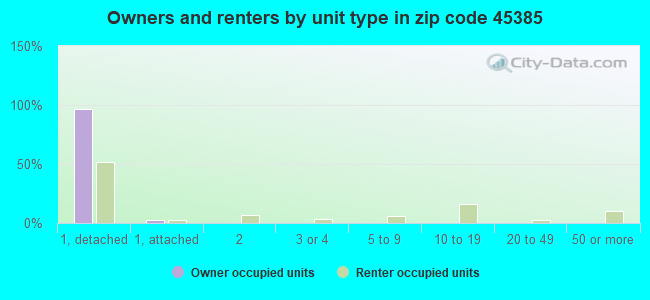
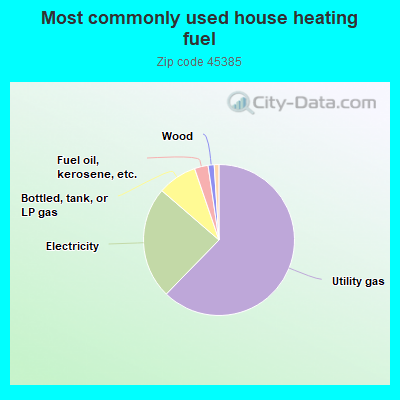
62.0%Utility gas
23.9%Electricity
8.4%Bottled, tank, or LP gas
2.9%Fuel oil, kerosene, etc.
1.3%Wood
1.0%Other fuel
Population in 1990: 36,683.
Place of birth for U.S.-born residents:
This state: 28,915
Northeast: 1,797
Midwest: 1,577
South: 4,222
West: 1,067
59% of the 45385 zip code residents lived in the same house 5 years ago. Out of people who lived in different houses, 64% lived in this county. Out of people who lived in different counties, 50% lived in Ohio.
90% of the 45385 zip code residents lived in the same house 1 year ago. Out of people who lived in different houses, 57% moved from this county. Out of people who lived in different houses, 27% moved from different county within same state. Out of people who lived in different houses, 10% moved from different state. Out of people who lived in different houses, 7% moved from abroad.
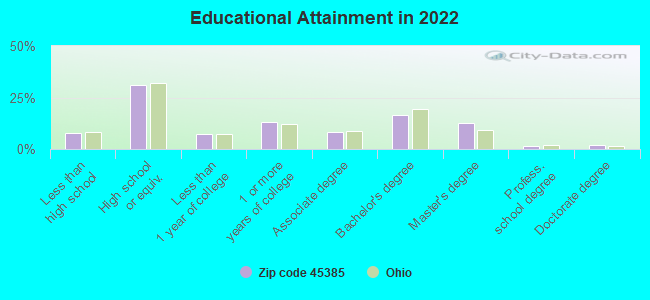
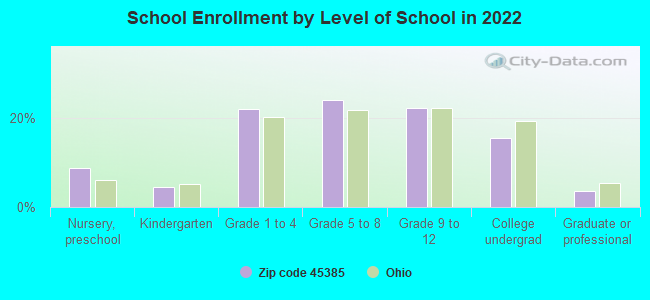
Private vs. public school enrollment:
Students in private schools in grades 1 to 8 (elementary and middle school): 708
Here:
16.4%
Ohio:
16.0%
Students in private schools in grades 9 to 12 (high school): 373
Here:
17.9%
Ohio:
13.1%
Students in private undergraduate colleges: 336
Here:
23.1%
Ohio:
22.3%
Occupation by median earnings in the past 12 months ($)
119,614Architecture and engineering occupations
103,377Fire fighting and prevention, and other protective service workers including supervisors
85,265Computer and mathematical occupations
80,563Health diagnosing and treating practitioners and other technical occupations
79,230Legal occupations
77,911Management occupations
Companies with biggest federal contracts located in this zip code (XENIA, OH):
BURKE PRODUCTS, INC (1355 ENTERPRISE LN; small business) : $5,488,771 in 250 contractsfrom 1999 to 2006
Contracts for Vehicular Brake, Steering, Axle, Wheel, and Track Components, Vehicular Power Transmission Components, Miscellaneous Electric Power and Distribution Equipment, Miscellaneous Alarm, Signal and Security Detection Systems, and moreby Defense Logistics Agency, Army, Navy Signed by year:2000: $771,743; 2001: $566,613; 2002: $643,047; 2003: $2,060,082; 2004: -$410,448; 2005: $1,090,415; 2006: $739,265.
Biggest contracts:
$1,073,367 with Defense Logistics Agency for Vehicular Brake, Steering, Axle, Wheel, and Track Components. Signed on 2003-10-29. Completion date: 2004-10-02.
$566,227, same as above.Signed on 2003-11-14. Completion date: 2004-10-14.
$149,788 with Defense Logistics Agency for Vehicular Power Transmission Components. Signed on 2003-10-01. Completion date: 2004-02-15.
$141,699 with Defense Logistics Agency for Miscellaneous Electric Power and Distribution Equipment. Signed on 2004-05-13. Completion date: 2004-10-10.
BARCO SIMULATION INC (600 BELLBROOK AVENUE; small business) : $2,470,840 in 30 contractsfrom 2000 to 2006
Contracts for Maintenance, Repair and Rebuilding of Equipment -- Training Aids and Devices, Installation of Equipment -- Communication, Detection, and Coherent Radiation Equipment, ADP Central Processing Unit (CPU, Computer), Analog, Electrical and Electronic assemblies, Boards, Cards, and Associated Hardware, and moreby Navy, Minerals Management Service, Federal Highway Administration, Army, and others Signed by year:2000: $123,153; 2001: $0; 2002: $62,248; 2003: $345,849; 2004: $969,585; 2005: $850,806; 2006: $119,199.
Biggest contracts:
$856,130 with Navy for Maintenance, Repair and Rebuilding of Equipment -- Training Aids and Devices. Taking place in VA. Signed on 2004-11-24. Completion date: 2005-05-24.
$563,900 with Minerals Management Service for Installation of Equipment -- Communication, Detection, and Coherent Radiation Equipment. Signed on 2005-08-29. Completion date: 2006-08-28.
$175,955 with Navy for ADP Central Processing Unit (CPU, Computer), Analog. Signed on 2003-05-01. Completion date: 2003-08-29.
$123,153 with Navy for Electrical and Electronic assemblies, Boards, Cards, and Associated Hardware. Signed on 2000-08-30. Completion date: 2001-01-10.
GREENE, INC (121 FAIRGROUND RD; small business) : $2,208,689 in 26 contractsfrom 1999 to 2006
Contracts for Laundry and DryCleaning Services, Miscellaneous Items by Air Force, Department of Veterans Affairs Signed by year:2000: -$38,277; 2001: $599,810; 2002: $357,791; 2003: $316,204; 2004: $239,203; 2005: $404,276; 2006: -$20,668.
Biggest contracts:
$429,203 with Air Force for Laundry and DryCleaning Services. Signed on 2003-10-01. Completion date: 2004-09-30.
$417,074, same as above.Signed on 2002-10-01. Completion date: 2002-09-30.
$394,276, same as above.Signed on 2005-10-01. Completion date: 2006-09-30.
$373,199, same as above.Signed on 2001-10-01. Completion date: 2002-09-30.
VIRTUAL SIMULATION AND TRAININ (1538 SCOTTSGATE CT NORTH; small business) : $1,524,248 in 7 contractsfrom 2002 to 2005
Contracts for Services -- Advanced Development (R&D), Other Research and Development -- Management and Support (R&D), Services -- Management and Support (R&D) by Navy, Air Force Signed by year:2000: $0; 2001: $0; 2002: $99,966; 2003: $375,000; 2004: $644,342; 2005: $404,940; 2006: $0.
Biggest contracts:
$375,000 with Navy for Services -- Advanced Development (R&D). Signed on 2005-09-08. Completion date: 2007-09-06.
$375,000 with Air Force for Other Research and Development -- Management and Support (R&D). Signed on 2003-05-21. Completion date: 2005-05-28.
$374,396, same as above.Signed on 2004-01-13. Completion date: 2005-05-18.
$199,960, same as above.Signed on 2004-09-17. Completion date: 2006-08-21.
CUSTOM MANUFACTURING SOLUTIONS (479 BELLBROOK AVE) : $1,196,648 in 11 contractsfrom 2000 to 2005
Contracts for Bearings, Antifriction, Unmounted by Defense Logistics Agency Signed by year:2000: $216,784; 2001: $224,371; 2002: $107,850; 2003: $37,937; 2004: $346,856; 2005: $262,850; 2006: $0.
Biggest contracts:
$224,913 with Defense Logistics Agency for Bearings, Antifriction, Unmounted. Signed on 2005-06-10. Completion date: 2005-08-24.
$216,784, same as above.Signed on 2000-12-06. Completion date: 2001-02-18.
$112,186, same as above.Signed on 2001-05-07. Completion date: 2001-09-04.
$112,185, same as above.Signed on 2001-05-23. Completion date: 2001-09-27.
WARRIOR TECHNOLOGIES, INC (1253 BELLBROOK AVENUE; small business) : $715,204 in 6 contractsfrom 1999 to 2001
Contracts for Clothing, Special Purpose, Vehicular Furniture and Accessories by Defense Logistics Agency, Army Signed by year:2000: $427,069; 2001: $228,594; 2002: $0; 2003: $0; 2004: $0; 2005: $0; 2006: $0.
Biggest contracts:
$243,713 with Defense Logistics Agency for Clothing, Special Purpose. Signed on 2000-04-04. Completion date: 2001-03-01.
$117,386 with Army for Vehicular Furniture and Accessories. Signed on 2001-12-17. Completion date: 2002-05-13.
$111,208, same as above.Signed on 2001-10-11. Completion date: 2002-04-12.
$103,689, same as above.Signed on 2000-12-13. Completion date: 2001-06-14.
CUSTOM MANUFACTURING SOLUTIONS (479 BELLBROOK AVE) : $367,735 in 4 contractsfrom 2005 to 2006
$92,133 with Defense Logistics Agency for Bearings, Antifriction, Unmounted. Signed on 2006-02-10. Completion date: 2006-04-07.
$92,133, same as above.Signed on 2005-12-29. Completion date: 2006-04-28.
$92,133, same as above.Signed on 2005-11-10. Completion date: 2006-01-14.
$91,336, same as above.Signed on 2005-09-16. Completion date: 2005-11-15.
ESPRIT, JANE (1020 EASTLAND COURT; small business) : $142,000 in 6 contractsfrom 2003 to 2006
Contracts for Program Management/Support Services by Army Signed by year:2000: $0; 2001: $0; 2002: $0; 2003: $40,000; 2004: $48,000; 2005: $50,000; 2006: $4,000.
Biggest contracts:
$48,000 with Army for Program Management/Support Services. Signed on 2005-10-01. Completion date: 2004-09-30.
$40,000, same as above.Signed on 2004-10-01. Completion date: 2004-09-30.
$40,000, same as above.Signed on 2003-10-01. Completion date: 2004-09-30.
$8,000, same as above.Signed on 2004-12-07. Completion date: 2004-09-30.
JCL EQUIPMENT CO INC (915 TRUMBULL ST; small business) : $132,115 in 3 contractsfrom 2002 to 2005
$88,000 with National Park Service for Road Clearing, Cleaning and Marking Equipment. Taking place in CO. Signed on 2002-09-15. Completion date: 2002-12-15.
$33,636 with Air Force for Maintenance, Repair and Rebuilding of Equipment -- Miscellaneous. Taking place in FL. Signed on 2005-09-23. Completion date: 2005-10-23.
$10,479 with Army for Miscellaneous Special Industry Machinery. Taking place in OR. Signed on 2005-09-26. Completion date: 2005-10-31.
THERMAL SYSTEMS INTERNATIONAL (50 S DETROIT ST)
$120,060 with Army for Specialized Shipping and Storage Containers. Signed on 2000-08-04. Completion date: 2000-11-30.
Top industries in this zip code by the number of employees in 2005:
Health Care and Social Assistance: General Medical and Surgical Hospitals (500-999 employees: 1 establishment)
2002 - 2018 National Fire Incident Reporting System (NFIRS) incidents
According to the data from the years 2002 - 2018 the average number of fires per year is 195. The highest number of reported fire incidents - 260 took place in 2008, and the least - 152 in 2017. The data has a declining trend.
When looking into fire subcategories, the most reports belonged to: Structure Fires (50.1%), and Outside Fires (30.9%).
Fire incident types reported to NFIRS in Zip Code 45385

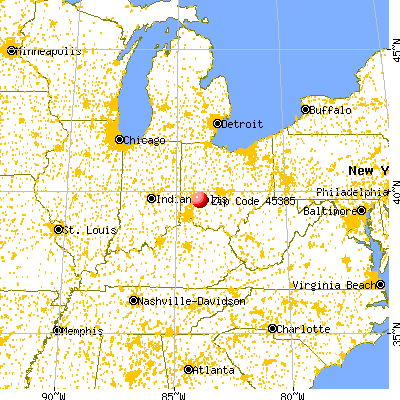


 Nearest zip codes: 45384, 45301, 45434, 45387, 45370, 45316.


 According to the data from the years 2002 - 2018 the average number of fires per year is 195. The highest number of reported fire incidents - 260 took place in 2008, and the least - 152 in 2017. The data has a declining trend.
 When looking into fire subcategories, the most reports belonged to: Structure Fires (50.1%), and Outside Fires (30.9%).