Races in Fairmont Mills, South Carolina (SC) Detailed Stats
Ancestries, Foreign-born residents, place of birth
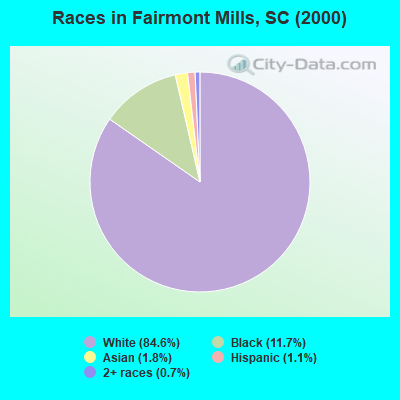
Race distribution in Fairmont Mills

- 6,71984.6%White alone
- 93111.7%Black alone
- 1451.8%Asian alone
- 841.1%Hispanic
- 570.7%Two or more races
- 70.09%American Indian alone
- 10.01%Other race alone
- 10.01%Native Hawaiian and Other
Pacific Islander alone
2000
2022
-
- 2,652,29166.1%White alone
- 1,178,48629.4%Black alone
- 95,0762.4%Hispanic
- 35,5680.9%Asian alone
- 33,2900.8%Two or more races
- 12,7650.3%American Indian alone
- 3,2660.08%Other race alone
- 1,2700.03%Native Hawaiian and Other
Pacific Islander alone

-
- 3,301,73962.5%White alone
- 1,313,29024.9%Black alone
- 343,7836.5%Hispanic
- 190,5083.6%Two or more races
- 89,8881.7%Asian alone
- 29,3900.6%Other race alone
- 12,1120.2%American Indian alone
- 1,9240.04%Native Hawaiian and Other
Pacific Islander alone

Income and house value in Fairmont Mills
- Median household income in 2022
- $89,494White non-Hispanic householders
- $73,523Black householders
- $52,739American Indian and Alaska Native householders
- $148,099Asian householders
- over $200,000Hispanic or Latino race householders
- Median 2022 house value
- $403,678White Non-Hispanic householders
- $261,993Black or African American householders
- $376,821American Indian or Alaska Native householders
- $462,600Asian householders
- $476,850Hispanic or Latino householders
Household income for White non-Hispanic householders

Household income for Black householders

Household income for American Indian and Alaska Native householders

Household income for Asian householders

Household income for Hispanic or Latino race householders

Zip code: 29369